Geotechnical Investigation Bow Ridge Subdivision Phase 3 Cochrane, Alberta
|
|
|
- Bathsheba Gilbert
- 5 years ago
- Views:
Transcription
1 Geotechnical Investigation Bow Ridge Subdivision Phase 3 Cochrane, Alberta FINAL Prepared for: The Town of Cochrane 101 Ranchehouse Road Cochrane, Alberta Prepared by: Stantec Consulting Ltd. Calgary, Alberta PROJECT NO April 6, 2010
2 Geotechnical Investigation Bow Ridge Subdivision Phase 3 Final Executive Summary As requested by the Town of Cochrane, Stantec Consulting Ltd. (Stantec) has carried out a geotechnical investigation in Bow Ridge Subdivision Phase 3 in Cochrane, Alberta (see Figures 1 and 2, Appendix B). The purpose of the investigation is to determine the cause of differential movements of two (2) rows of gabion retaining walls within Phase 3, and to provide geotechnical recommendations for remedial measures from the geotechnical engineering perspective. Field Work Stantec advanced a total of twelve (12) boreholes along the retaining walls. Representative soil samples were collected at regular intervals. Standpipe piezometers and slope inclinometers were installed in all the boreholes to permit groundwater level and ground displacement monitoring. Groundwater level and ground displacement monitoring were carried out on a monthly basis between July 2009 and February In addition, a 3D laser survey was completed to measure and document the existing conditions of the retaining walls. Existing Design Review The original design of the retaining walls was reviewed. It is understood that a section of the retaining wall has been repaired with a Retrofit Wall design, and reconstructed with a Rebuild Wall design. Both Retrofit Wall and Rebuild Wall designs were also reviewed by Stantec. Stability analyses against both overturning and sliding of the retaining walls in all three (3) designs were completed. Based on the parameters provided in the designs, the Factor of Safety against both overturning and sliding appeared to be adequate. The Factor of Safety was recalculated based on recommendations provided in the Canadian Foundation Engineering Manual. The results indicated that all three (3) existing wall designs have inadequate Factors of Safety against sliding. In addition, Stantec is of the opinion that frost action of the clay fill material contributed to the differential movements of the retaining walls. Other factors such as poor quality of the base drainage gravel, undermining of the base of the retaining walls during construction, and migration of the subgrade soil into the gabion baskets may also have contributed to the differential movements. Based on the results of the inclinometer monitoring, the maximum accumulated lateral displacements of the retaining walls during the measurement period were in the order of 8 mm. The measured displacements represent movements that occurred within the monitoring period only and do not represent total displacements experienced by the wall since construction. Based on the inclinometer results, we are of the opinion that failure planes do not exist within the measurement depths at the borehole locations, with the exception of borehole BH8. At borehole BH8, the inclinometer results indicate an impending bearing capacity failure in the soil below the retaining wall. Conclusion Based on the information provided and our observations during the field investigation, no signs of global instability were observed or reported within the subdivision outside of the immediate areas of the retaining walls. However continued localized movements or failure of the retaining walls should be expected. Recommendation Stantec is of the opinion that remediation of the existing retaining walls using the existing design will not be effective. It is recommended that the retaining walls be removed entirely and reconstructed using other alternate wall systems. The wall at and near borehole BH8 should be repaired or reconstructed as soon as possible. Continued monitoring at all borehole locations on a monthly basis should be carried out prior to repair or reconstruction to provide warning of potentially dangerous situations. The monitoring program should be reviewed annually. Homeowners need to be advised that downspouts should not discharge directly on to the gabion retaining walls. Construction of other retaining walls within backyards without proper geotechnical design is not recommended. E.1
3 Geotechnical Investigation Bow Ridge Subdivision Phase 3 Final Table of Contents 1 INTRODUCTION Site and Geology Background METHOD OF INVESTIGATION Field Investigation Laboratory Testing Laser Survey Scan of Walls Slope Inclinometer Installation RESULTS OF INVESTIGATION General Surficial Materials Fill Materials Clay Gravel Clay (CL-CH) Sandy Silt (ML) and Silty Sand (SM) Low Plastic Clay (CL) Groundwater DISCUION Original Wall Design Data Stability Analyses Wall Construction Retrofit Wall Rebuilt Wall Slope Inclinometer Results Global Stability of the Subdivision and Local Stability of the Walls RECOMMENDATIONS CLOSURE i
4 Geotechnical Investigation Bow Ridge Subdivision Phase 3 Final APPENDIX A APPENDIX B APPENDIX C APPENDIX D APPENDIX E APPENDIX F APPENDIX G STATMENT OF GENERAL CONDITIONS FIGURES BOREHOLE RECORDS LABORATORY TESTING SLOPE INCLINOMETER READINGS UNIFIED SOIL CLAIFICATION SYSTEM EXAMPLES OF MSE WALLS FROM SIERRA List of Tables Table 3-1 Groundwater Levels July 2009 to September Table 3-2 Groundwater Levels November 2009 to February Table 4-1 Analysis Parameters based on Stantec Investigation Original Wall Analyses Table 4-2 Calculated Factor of Safety (Original Wall) Table 4-3 Calculated Factor of Safety (Original Wall using k a = 1.0) Table 4-4 Analysis Parameters based on Stantec Investigation Retrofit Wall Analyses Table 4-5 Analysis Parameters based on Stantec Investigation Rebuilt Wall Analyses List of Figures Figure 1 Figure 2 Site Location Plan... APPENDIX B Site Plan... APPENDIX B Figure 4-1 Original Wall Design Cross Sections Figure 4-2 Retrofit Wall Design Figure 4-3 Cross Section at Borehole BH ii
5 Geotechnical Investigation Bow Ridge Subdivision Phase 3 Final Figure 4-4 Rebuilt Wall Design Figure 4-5 Cross Sections through Rebuilt Wall List of Photos Photo 1-1 Failure of stairway connecting Bow Ridge Link and Bow Ridge Close. 3 Photo 1-2 Support Column of Stairway... 3 Photo 1-3 Evidence of settlement at 10 Bow Ridge Close... 4 Photo 2-1 Typical laser scanned image... 6 Photo 4-1 Progressive Buckling of Fence iii
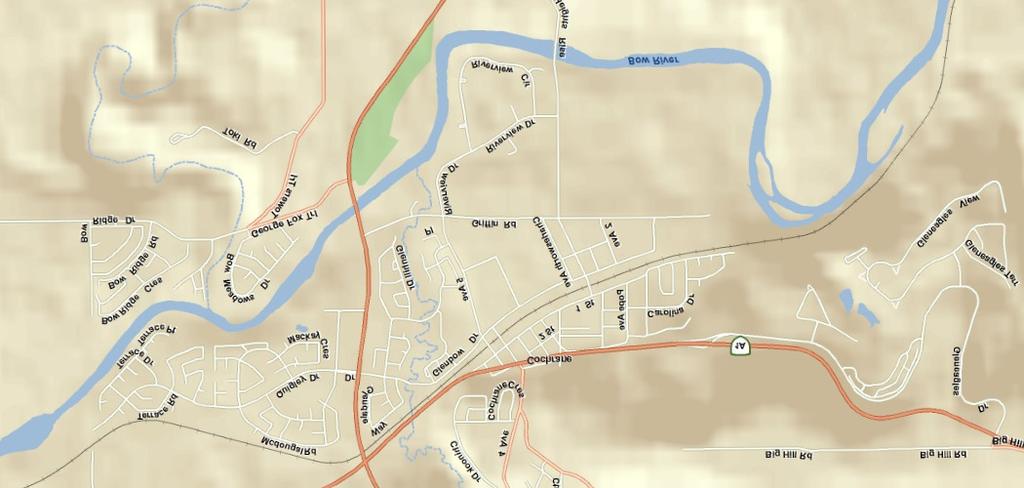
6 Geotechnical Investigation Bow Ridge Subdivision Phase 3 Final 1 INTRODUCTION Stantec Consulting Ltd. (Stantec), acting in accordance with the terms of reference provided by our proposal number , has carried out a geotechnical investigation in Bow Ridge Subdivision Phase 3 in Cochrane, Alberta. Specifically, Stantec was requested to investigate the stability of the two (2) rows of gabion retaining walls within Phase 3, and if necessary, to provide conceptual remedial recommendations to stabilize the walls. Authorization to proceed with the work was received from Mr. Mike Saley, P.Eng., Director of Planning and Engineering, from the Town of Cochrane on May 19, The scope of the geotechnical investigation was carried out as indicated in the above mentioned proposal and as discussed within the text of this report. The scope of work for this investigation included the following: Coordinate and supervise underground utility locates Conduct site visits to observe differential movements of the gabion retaining walls Conduct a field drilling program to characterize the soil and groundwater conditions and assess their possible contribution to observed deformations and measured displacements of the gabion retaining walls Preparation of a report presenting the factual information obtained during this investigation and provide geotechnical recommendations for remedial measures from the geotechnical engineering perspective 1.1 Site and Geology Bow Ridge Subdivision Phase 3 is located in SW¼ of Section 4, Township 26, Range 4, West of 5 Meridian in Cochrane, Alberta (Figure 1, Appendix B); herein referred to as the Site. The two subject gabion retaining walls are located on the back of the lots along Bow Ridge Link and Bow Ridge Drive (see Figure 2, Appendix B). For the purpose of this report, the walls located on the south and north are labeled as Retaining Wall A and B, respectively. Based on published geological information 1 and our experience in the area, it was expected that the Site would be located within a lacustrine deposit of silt and clay. 1.2 Background The following documents were reviewed prior to completion of this report: Almor Engineering Associates Ltd. (Almor) report Retaining Wall Evaluation Bow Ridge Phase 3 Subdivision, Cochrane, dated October 17, 2003 McIntosh-Lalani Engineering Ltd. report Bow Ridge Gabion Basket Retaining Wall, dated September 12, 2003 Almor report Foundation Considerations Bow Ridge Phase 2 and 3, dated July 27, 2000 Almor report Retaining Wall Recommendations Bow Ridge Phase 3 Subdivision, dated March 15, Shetsen, I., Quaternary Geology, Southern Alberta, Alberta Research Council 1
7 Geotechnical Investigation Bow Ridge Subdivision Phase 3 Final Almor report Subsoil Investigation Bow Ridge Subdivision, dated October, 1996 Geo-Engineering (M.S.T.) Ltd. report Bow Ridge Developments Report on Preliminary Slope Stability Assessment, dated June, 1994 Based on the information from the above listed documents, communication with the Town of Cochrane, and our observations, it is understood that the subject gabion retaining walls have undergone differential movements. We also understand that the east portion of Retaining Wall B has been repaired. Two (2) methods (referred to in this report as Retrofit Wall and Rebuilt Wall) were used to repair this section of the retaining wall. Based on the results of our site visits, the observed distresses and conditions of the retaining walls and the surrounding structures are as follows: Gabion baskets were pushed out in various locations along the retaining wall. Ground subsidence was noted behind the retaining wall at several locations. Adjacent fences of the walkway connecting Bow Ridge Link and Bow Ridge Drive, at the toe of Retaining Wall B, showed progressively more buckling of the panels towards the toe of the wall. Fences at both the top and toe of the walls at several locations were observed to be leaning. Two (2) wood-framed stairways, located between Bow Ridge Close and Bow Ridge Link, and between Bow Ridge Link and Bow Ridge Drive, were damaged and the wood components were separated at various locations (see Photo 1-1). Water discharge from roof downspouts towards the back of the retaining walls were observed at some locations. Private retaining walls built in some backyards (behind the gabion walls) were observed. The support columns of the stairways were supposed to be founded on concrete piers. However, due to differential movements, the support columns were pushed away from the piers and were no longer bearing on the concrete piers (see Photo 1-2). Evidence of backyard subsidence was observed at 10 Bow Ridge Close behind the retaining wall adjacent to the stairways connecting Bow Ridge Link and Bow Ridge Close (see Photo 1-3, note the elevation difference on both sides of the red line). 2


8 Geotechnical Investigation Bow Ridge Subdivision Phase 3 Final Photo 1-1 Failure of stairway connecting Bow Ridge Link and Bow Ridge Close Photo 1-2 Support Column of Stairway 3

9 Geotechnical Investigation Bow Ridge Subdivision Phase 3 Final Photo 1-3 Evidence of settlement at 10 Bow Ridge Close 4
10 Geotechnical Investigation Bow Ridge Subdivision Phase 3 Final 2 METHOD OF INVESTIGATION 2.1 Field Investigation Prior to the start of the investigation, Stantec personnel made arrangements to verify the locations of underground utilities at and near the proposed borehole locations. The fieldwork for the investigation was carried out from June 4 to 18, Twelve (12) boreholes (numbered BH1 to BH12) were advanced using a track-mounted solid stem auger drill rig operated by Mobile Augers and Research Ltd. of Calgary, Alberta. The boreholes were advanced to depths ranging from 6.9 m to 9.9 m below existing grade. Borehole locations are shown on Figure 2, Appendix B. The subsurface stratigraphy encountered in the boreholes was recorded by Stantec personnel as the boreholes were advanced. Representative samples of each stratum encountered were collected at close intervals during the performance of Standard Penetration Tests (SPTs) and from the auger flights. Pocket penetrometer tests were carried out on samples of cohesive soils to assist with the assessment of the shear strengths of the soils. Standpipe piezometers were installed in all boreholes to permit groundwater level monitoring. The standpipe piezometers were monitored between July 2, 2009 and February 9, The groundwater levels are shown in Table 3-1 and Table 3-2 (see Section 3.7) and on the Borehole Records in Appendix C. 2.2 Laboratory Testing All samples recovered were stored in moisture tight containers and were returned to our Calgary laboratory for detailed classification and testing. Laboratory testing was performed on selected samples. The results of the laboratory testing are provided on the Borehole Records in Appendix C, presented in Appendix D, or are discussed in Section 3 of this report. Symbols and terms used in the borehole records are included in Appendix C. Laboratory testing was carried for the purposes of determining the classifications and strengths of the site soils accurately, in order to understand past behaviour and predict future behaviour of the soils. The tests carried out and the corresponding information of the tests are outlined below. Moisture Content determination of the percentage of water to soil solids by weight Atterberg Limits determination of the degree of plasticity of a soil through the determination of moisture contents at which the soil exhibits solid, plastic and liquid states Grain Size Analysis determination of the percentages by weight of gravel, sand, silt/clay sized particles in a soil using sieves Samples remaining after testing will be stored for a period of three (3) months after issuance of this report. Samples will be discarded after this period unless we are otherwise directed. 5

11 Geotechnical Investigation Bow Ridge Subdivision Phase 3 Final 2.3 Laser Survey Scan of Walls To accurately measure and document the existing conditions of the retaining walls, state-of-the-art 3D laser scanning techniques were employed to produce 3D topographic visuals of the wall surface. 3D laser scanners collect approximately 50,000 points per second, gathering more data in less time than traditional surveying techniques, with higher accuracy and less inconvenience to the homeowners. Whereas conventional survey techniques allow for the walls to be documented and analyzed only at pre-defined locations, the volume of data using the laser scanner allows the entire walls to be analyzed. If deemed required, laser scanning also allows for ongoing monitoring of wall deformation by providing a fast, convenient way of comparing the current wall locations to measurements made previously. A typical laser scanned image is shown in Photo 2-1. Photo 2-1 Typical laser scanned image 6
12 Geotechnical Investigation Bow Ridge Subdivision Phase 3 Final 2.4 Slope Inclinometer Installation Slope inclinometers were installed in all the boreholes for ground displacement monitoring. Inclinometer casings are heavy-walled PVC pipes with 2 sets of grooves at 90 degrees to each other (typically installed perpendicular and parallel to the face of the wall). These grooves allow the instrument to provide a three dimensional (x-y-z directions, i.e. parallel-perpendicular-depth) model of soil movements. The inclinometers were protected with flush-mounted road boxes. The slope inclinometers were monitored between July 2, 2009 and February 9, The results of the monitoring are presented in Appendix E and are discussed in the text of this report (see Section 4.4). 3 RESULTS OF INVESTIGATION 3.1 General The subsurface conditions encountered in the boreholes are described in detail on the Borehole Records, with additional and supplementary information provided in this section. All soil descriptions and identifications during drilling were made in accordance with ASTM Standard D2488 (Visual Manual Procedure). The Borehole Records, along with an explanation of the symbols and terms used in their description, are provided in Appendix C. In general, the observed stratigraphy consisted of topsoil or fill overlying clay, which extended to silt and sand deposits. 3.2 Surficial Materials Topsoil was present at the surface in eight (8) of the twelve (12) boreholes (BH1, BH2, BH4, BH5, BH6, BH9, BH11, and BH12) and ranged in thickness from 200 mm to 300 mm. It should be noted that borehole BH3 was drilled through existing pavement; a 150 mm thick layer of asphalt and 350 mm thick layer of base gravel were encountered at the surface. Gravel surfacing (approximately 100 mm to 200 mm thick) was noted in boreholes BH7, BH8 and BH Fill Materials Clay Clay fill was encountered beneath the asphalt pavement structure in borehole BH3, beneath the topsoil in boreholes BH4 and BH12, and beneath the gravel surfacing in boreholes BH7 and BH10. The clay fill extended to depths ranging from 1.4 m to 4.3 m below existing grade. It contained trace silt, sand, gravel, organics and rootlets. It should be noted that the fill was gravelly in boreholes BH7 and BH10. The fill was generally brown in color and damp to moist. Results of the Atterberg Limits testing on a representative sample of the fill indicated a Liquid Limit of 49 and a Plasticity Index of 32. Based on the laboratory testing and following the Unified Soils Classification (USC) System 2 as set forth in ASTM D2487, this material is classified as low to medium plastic clay (CL-CH). Moisture content of the fill ranged from 15% to 30%, with an average moisture content of 22%. 2 For reference purposes, detail of the USC System is included in Appendix F. 7
13 Geotechnical Investigation Bow Ridge Subdivision Phase 3 Final Results of SPTs conducted in the clay fill indicated N-values 3 between 3 and 10, with an average N-value of 6. Pocket penetrometer test within this stratum indicated an undrained shear strength of 144 kpa. In terms of relative consistency, based on Standard Penetration Test N-values and pocket penetrometer result, the fill may be described as firm to stiff Gravel Gravel fill was encountered beneath surface gravel in borehole BH8 and beneath the clay fill in boreholes BH7 and BH10. The gravel fill extended to a depth of 3.8 m below existing grade in all three boreholes. It was clayey, contained trace silt and sand, and was generally brown in color and damp to moist. A grain size analysis completed on a representative sample of this material indicated the following group percentages: 69% gravel; 4% sand; and 27% silt and clay size particles. Based on the laboratory testing and following the USC system, this material may be classified as clayey gravel (GC). Moisture content of the gravel fill ranged from 8% to 25%, with an average moisture content of 17%. Results of SPTs indicated N-values of 4 and 5. In terms of relative density, based on Standard Penetration Test N-values, the gravel fill may be described as loose. 3.4 Clay (CL-CH) Clay was encountered under the topsoil and fill in boreholes BH1 to BH6 and BH12. It extended to beyond the termination depths (6.9 m to 9.9 m below existing grade) in boreholes BH1 to BH4, and to depths ranging from 3.5 m to 7.3 m below existing grade in the remaining boreholes. The clay contained trace silt and gravel, was generally brown with grey mottling in color and damp to moist. Results of the Atterberg Limits testing on four (4) representative samples of the clay indicated Liquid Limits ranging from 43 to 50 and Plasticity Indices ranging from 27 to 31. Based on the laboratory testing and following the USC system, this material is classified as medium to high plastic clay (CL-CH). Moisture contents of the clay samples were between 20% and 35%, with an average moisture content of 23%. Results of SPTs conducted on the clay indicated N-values between 6 and 39, with an average N-value of 19. Pocket penetrometer tests within this stratum indicated undrained shear strength ranging from approximately 84 kpa to 120 kpa, with an average value of 106 kpa. In terms of relative consistency, based on Standard Penetration Test N-values and pocket penetrometer results, the clay may be described as firm to very stiff. 3.5 Sandy Silt (ML) and Silty Sand (SM) Interbedded sandy silt and silty sand were logged beneath the clay and fill in boreholes BH5 to BH12. The silt and sand extended to a depth of 8.4 m below existing grade in boreholes BH8 and BH10, and beyond the termination depths in the remaining boreholes (6.9 m to 9.9 m below existing grade). The silt and sand was generally brown in color, interbedded with clay layers and dry to wet. Grain size analyses were completed on two (2) representative samples of these materials. The results indicated that one sample had 33% sand and 67% fines (silt and clay size particles) and the second sample had 58% sand and 42% fines. Based on the laboratory testing and following the USC system, this material may be classified as sandy silt (ML) and silty sand (SM). Moisture contents ranged from 1% to 25%, with an average moisture content of 12%. 3 For reference purposes, determination of relative density and consistency based on N-values and undrained shear strengths are outlined in the Symbols and Terms Used on Borehole and Test Pit Records provided in Appendix C. 8
14 Geotechnical Investigation Bow Ridge Subdivision Phase 3 Final Results of SPTs conducted on the silt and sand indicated N-values between 8 and 45, with an average N- value of 26. In terms of relative density, based on Standard Penetration Test N-values, the silt and sand may be described as loose to dense. 3.6 Low Plastic Clay (CL) A low plastic clay layer was noted beneath the topsoil and medium to high plastic clay in boreholes BH5 and BH11, and beneath the silt and sand in boreholes BH8 and BH10. The low plastic clay extended to depths ranging from 2.1 m to 4.6 m below existing grade in boreholes BH5 and BH11, and beyond the termination depths ranging from 9.0 m to 9.1 m below existing grade in the remaining boreholes. The clay had trace silt, sand and gravel. It was generally brown in color and damp to moist. Results of the Atterberg Limits testing on a representative sample of the clay indicated a Liquid Limit of 36 and a Plasticity Index of 20. Based on the laboratory testing and following the USC system, this material is classified as low plastic clay (CL). Moisture content of the clay ranged from 13% to 26%, with an average moisture content of 19%. Results of SPTs conducted on the clay indicated N-values between 12 and 30, with an average N-value of 22. Pocket penetrometer test within this stratum indicated an undrained shear strength of 108 kpa. In terms of relative consistency, based on Standard Penetration Test N-values and pocket penetrometer result, the clay may be described as stiff to very stiff. 3.7 Groundwater Groundwater levels within the standpipe piezometers were monitored from July 2, 2009 to February 9, The measured groundwater levels are presented in Table 3-1, Table 3-2, and on the Borehole Records in Appendix C. Groundwater levels vary from year to year and from season to season, and depend on many factors including surface and subsurface drainage, precipitation, and the hydrogeology of the area. Fluctuations in the groundwater levels should be anticipated. Additional groundwater monitoring may be conducted to confirm the measured groundwater levels. Groundwater levels in Alberta can typically experience fluctuation of up to 1 m with the peak groundwater levels generally occurring in June or July. 9
15 Geotechnical Investigation Bow Ridge Subdivision Phase 3 Final Table 3-1 Groundwater Levels July 2009 to September 2009 Borehole Number July 2, 2009 (m) July 16, 2009 (m) August 7, 2009 (m) September 10, 2009 (m) BH BH2 Dry Dry Dry Dry BH BH BH5 Dry Dry Dry Dry BH BH7 Dry BH8 Dry Dry Dry Dry BH9 Dry Dry Dry Dry BH10 Dry Dry Dry Dry BH11 Dry Dry Dry Dry BH Table 3-2 Groundwater Levels November 2009 to February 2010 Borehole Number November 4, 2009 (m) December 3, 2009 (m) January 12, 2010 (m) February 9, 2010 (m) BH BH2 Dry Dry Dry Dry BH BH BH5 Dry Dry Dry Dry BH BH Dry Dry BH8 Dry Dry Dry Dry BH9 Dry Dry Dry Dry BH10 Dry Dry Dry Dry BH11 Dry Dry Dry Dry BH
16 Geotechnical Investigation Bow Ridge Subdivision Phase 3 Final 4 DISCUION Based on review of the information available and the results of our investigation, Stantec is of the opinion that the observed differential movements of the gabion retaining walls may be due to a combination of the following possible factors: Low factor of safety against sliding Poor construction method Post construction factors, such as excess water discharge towards the back of the walls, surcharge of the walls due to other retaining structures apparently constructed after the gabion walls were installed Based on the available information, there are three (3) different types of gabion retaining walls: the original wall, the retrofit wall and the rebuilt wall. Each wall design is discussed in detail in the following sections. 4.1 Original Wall Design Data The original retaining walls included locations near boreholes BH1 to BH6 and BH12. Details of the original design were provided in the March 1999 Almor report. It should be noted that the design provided in the report was completed by G. Douglas Dey Engineering. A copy of the design cross section drawing is presented in Figure 4-1. The key geotechnical features of the design are summarized below: The offset of the gabion baskets was to range from 0.15 m to 0.30 m. A layer of drainage gravel was to be placed behind and beneath the retaining wall. Filter fabric was to be placed between the drainage gravel and gabion baskets. Clay material was identified as the backfill behind the retaining wall. The report stated a wet unit wight (sic) of the soils of 2100 kg/m³ and a co-efficient of passive earth pressure (k) of 0.5 were used in the design. Although the report used the term passive earth pressure, it is assumed that the author was referring rather to the active earth pressure coefficient. 11
17 Geotechnical Investigation Bow Ridge Subdivision Phase 3 Final Figure 4-1 Original Wall Design Cross Sections Stability Analyses Using the above design and soil parameters derived from the soils encountered during drilling (see Table 4-1) the factor of safety (FOS) against sliding and overturning of the retaining wall were analyzed at each borehole location. Active earth pressure coefficients (k a ) ranging from 0.33 to 0.43 were used for the above analyses. A FOS of 1.5 against sliding is typically accepted as industry standard in retaining wall design. The results are presented in Table 4-2. Table 4-1 Analysis Parameters based on Stantec Investigation Original Wall Analyses Parameter Value Clay Fill Unit Weight (kn/m³) 18 Clay Fill Friction Angle, φ ( ) 25 Gabion Basket Unit Weight (kn/m³) 20.5 Friction Angle between Gabions and Clay Fill, δ ( ) 17 Friction Angle between Gabions and Base Drainage Gravel, δ ( ) 25 Back Slope, β ( ) 6 to 10 12
18 Geotechnical Investigation Bow Ridge Subdivision Phase 3 Final Table 4-2 Calculated Factor of Safety (Original Wall) Borehole Number Against Overturning Calculated Factor of Safety Against Sliding BH BH BH BH BH It should be noted that the Canadian Foundation Engineering Manual (CFEM), 4 th Edition, Section states that Soils classified as CH, CL, MH, ML or OL, according to the USCS, are often subject to excessive frost action and swelling when used as wall backfill. Wall movement is likely to be excessive; the use of these materials should be avoided. Where they must be used, frost protection should be provided and an earthpressure coefficient of 1.0 used in design. Since clay was used as the backfill material behind the retaining walls and excessive wall movements were observed, the comments from CFEM are considered to be applicable. As such, the FOS was recalculated using a k a of 1.0 as recommended in CFEM. The calculated FOS values are presented in Table 4-3. The calculations indicate that if the recommendations in CFEM are followed the original design has an inadequate FOS at most wall locations. It should be noted that an FOS less than 1.0 indicates a failure condition. Table 4-3 Calculated Factor of Safety (Original Wall using k a = 1.0) Borehole Number Against Overturning Calculated Factor of Safety Against Sliding BH BH BH BH BH Wall Construction Based on our review of the design drawing and the results of our investigation, it appears that frost protection was not provided. Since gabion retaining walls contain numerous large void spaces between the rock fill in the baskets, frost penetration into the clay backfill is expected both vertically and horizontally. The results of the laboratory testing indicated that the average moisture content of the clay fill was 22%. As moisture content is defined by weight and that the weight of water is about half the weight of soil solids, approximately 44% of the clay mass by volume is water. Since water expands by 9% when it changes from water to ice, and assuming frost penetration depth of 1.5 m horizontally, lateral movements of the walls based on water freezing expansion alone could be in the order of 60 mm throughout each winter. The observed lateral movements of sections of the retaining walls appear to confirm this calculated magnitude of movements. If the walls do not move back entirely upon thawing, the lateral movements can be cumulative over several years. 13
19 Geotechnical Investigation Bow Ridge Subdivision Phase 3 Final If the construction was not adequately supervised, it may have also contributed to the movement of the retaining wall. The Factor of Safety against sliding of the retaining wall is based on the friction between the gabion rocks and the drainage gravel layer beneath the base of the retaining walls. Poor quality or preparation of the base drainage gravel can reduce the FOS of the retaining walls. Poor preparation of the subgrade materials can cause longitudinal differential settlements of the retaining wall as observed. The differential movements of the retaining walls and the surrounding structures listed in Section 1.2 are most likely due to the lateral movement (sliding) of the retaining wall. As the retaining walls move laterally outward, the backfill behind the retaining walls settles to fill up the extra space created by the walls moving outward. Since the wood framed stairways were constructed adjacent to the retaining walls, the walls pushed the columns of the stairways outward, causing the columns off the support piers, and causing the damage observed. It should be noted that although the lower stairway structure connecting Bow Ridge Link and Bow Ridge Drive has not failed at this time, the same lateral movement of the retaining walls is observed and similar failure is considered likely. The timing of such failure is unknown but is inevitable. Water discharge towards the back of the retaining walls either through natural runoff or excessive discharge from roof downspouts are expected to reduce the Factor of Safety of the retaining walls since water contributes to the swelling of the clay backfill and increased moisture content leading to larger lateral movements due to freezing. Retaining walls built in the backyards may also surcharge the gabion retaining walls which, in turn, would also reduce the Factor of Safety against both sliding and overturning. The slope inclinometer installed in borehole BH1 measured a maximum movement of 7 mm during the monitoring period. Groundwater depths at BH1 were measured at less than 1.0 m from the ground surface during the summer and at about 1.8 m from the ground surface over the winter months. These groundwater levels are significantly higher than those measured at other borehole locations. We are of the opinion that the shallow groundwater levels play a significant part in contributing to the outward movements of the wall at this location, as observed prior to and during the inclinometer monitoring period. Slope inclinometer results are further discussed in Section Retrofit Wall It is understood that a section of Retaining Wall B was repaired previously using the Retrofit design provided in Almor s October 17, 2003 report. The Retrofit Wall is located near BH7. According to the drawing, it appears that the Retrofit Wall design was intended to provide reinforcement to the original retaining wall without complete reconstruction. The key geotechnical features of the Retrofit Wall design as shown in Figure 4-2 are summarized below. Three (3) gabion baskets were installed at the back of the retaining wall, starting from the base and extended to 1.5 m below existing grade, with the width of the base increased from 1.5 m to 2.5 m. Two (2) concrete blocks were placed on the base gabion baskets. Clay material was used as backfill for the top 1.0 m behind the retaining wall. Gravel material was used as backfill beneath the clay backfill. Filter fabrics were placed between the gravel fill, clay fill and gabion baskets. 14
20 Geotechnical Investigation Bow Ridge Subdivision Phase 3 Final The analysis of the design of the Retrofit Wall was done using the parameters provided in Table 4-4. The analyzed FOS against sliding and overturning of the Retrofit Wall design were 10.0 and 2.7, respectively, when a k a of 0.34 was used in the analysis. As stated in the previous section, CFEM recommends against using clay materials as backfill, and a k a of 1.0 be used for the analysis should clay be used as backfill. Should k a of 1.0 be used for the analysis, the FOS against sliding would be reduced significantly to 1.1. It should also be noted that frost protection was not included in the design; hence frost action of the clay backfill as discussed above is expected to have contributed to the lateral movement of the retaining wall at this location. Table 4-4 Analysis Parameters based on Stantec Investigation Retrofit Wall Analyses Parameter Value Clay Fill Unit Weight (kn/m³) 18 Gravel Fill Unit Weight (kn/m ³ ) 20 Gravel Fill Friction Angle, φ ( ) 35 Clay Fill Friction Angle, φ ( ) 25 Gabion Basket Unit Weight (kn/m³) 20.5 New Gabion Basket Unit Weight (kn/m³) 19.5 Friction Angle between Gabions and Clay Fill, δ ( ) 17 Friction Angle between Gabions and Gravel Fill, δ ( ) 25 Back Slope, β ( ) 22 15
21 Geotechnical Investigation Bow Ridge Subdivision Phase 3 Final Figure 4-2 Retrofit Wall Design Stantec conducted a survey of the retaining wall at borehole BH7. The cross-section showed evidence of the influence of the frost action within the clay fill. According to the cross-section, the offset between the top and the middle gabion baskets was larger than the offset between the middle and the base gabion baskets. Our investigation identified that clay fill was used as the top part of the backfill and gravel backfill was used as the bottom part. The clay backfill in borehole BH7 extended to 1.4 m below existing grade, which is near the top of the base gabion basket. It is expected that expansion from the clay backfill due to frost action pushed the top and middle gabion baskets outward, while the gravel backfill did not. Hence, the observed offsets between the gabions are different. 16
22 Geotechnical Investigation Bow Ridge Subdivision Phase 3 Final Figure 4-3 Cross Section at Borehole BH7 In order to place the new gabion baskets behind the retaining wall, a vertical excavation into the subgrade soil would have been required. The field investigation indicated that the subgrade soil at this location consisted of silt and sand material. It is anticipated that sloughing of side walls of these materials would have occurred during excavation. Hence, it is likely that the original base gabion was undermined during construction. In addition, from a constructability perspective, it would have been difficult to backfill and compact the sloughed area while installing the gabion baskets. Therefore, it is possible that a gap would have existed between the gabion baskets and the subgrade soil. According to the design drawing, there was no filter fabric between the gabion baskets and the subgrade soil. Since the subgrade soil was silt and sand materials, migration of the subgrade silt and sand into the gabion baskets is likely. Migration of the subgrade soil would cause the front portion of the retaining wall (the gabion baskets of the original design) to settle. Combined with the lateral movement due to frost expansion of the clay fill materials, the retaining wall would have a tendency to tilt forward, which is what was observed at this location. In addition to visual observations, the slope inclinometer installed in borehole BH7 measured a maximum movement of 7 mm during the monitoring period. The result of the slope inclinometer matched closely with the hypothesized failure mechanism discussed above. Slope inclinometer results are further discussed in Section 4.4. It is expected that the effects of water discharge behind the gabion walls and homeowner constructed walls would have the same negative effects to the FOS of the Retrofit Wall as discussed in Section
23 Geotechnical Investigation Bow Ridge Subdivision Phase 3 Final 4.3 Rebuilt Wall It is understood that the original wall was completely removed and reconstructed near boreholes BH8 and BH10. Details of the Rebuilt Wall were also provided in the October 17, 2003 Almor report (see Figure 4-4). The key geotechnical features of the Rebuilt Wall design are summarized below. The configuration of the top three (3) gabion baskets was unchanged from the Original Wall design. A 2.5 m wide and 1.5 m high base gabion basket was added below the original wall and buried into the subgrade soil. Clay material was used as backfill for the top 1.0 m behind the retaining wall. Gravel material was used as backfill beneath the clay backfill. Filter fabric was placed between the gravel fill, clay fill and gabion baskets. The analysis of the design of the Rebuilt Wall was carried out using the parameters provided in Table 4-5. The analyzed FOS against sliding and overturning of the Rebuilt Wall design were 2.7 and 1.2, respectively, if a k a of 0.57 was used in the analysis. As stated in the previous section, CFEM recommends against using clay materials as backfill and a k a of 1.0 be used for the analysis should clay be used. Should a k a of 1.0 be used for the analysis, the FOS against sliding would be reduced significantly to a value of 0.8, suggesting failure of the wall. It should also be noted that frost protection was not included in the design; hence frost action of the clay backfill as discussed above is expected to have contributed to the lateral movement of the retaining wall at this location. Table 4-5 Analysis Parameters based on Stantec Investigation Rebuilt Wall Analyses Parameter Value Clay Fill Unit Weight (kn/m³) 18 Gravel Fill Unit Weight (kn/m³) 25 Gravel Fill Friction Angle, φ ( ) 20 Clay Fill Friction Angle, φ ( ) 35 Gabion Basket Unit Weight (kn/m³) 19.5 New Gabion Basket Unit Weight (kn/m³) 17 Friction Angle between Gabions and Clay Fill, δ ( ) 25 Friction Angle between Gabions and Gravel Fill, δ ( ) 18 Back Slope, β ( ) 18 18
24 Geotechnical Investigation Bow Ridge Subdivision Phase 3 Final Figure 4-4 Rebuilt Wall Design Results of the survey at the Rebuilt Wall section (from boreholes BH8 to BH10) as shown in Figure 4-5 indicated similar offset conditions between the gabion baskets as evidenced in the Retrofit Design. The offset between the top and the middle gabion baskets was larger than the offset between the middle and the base gabion baskets, which is most likely due to the frost action within the clay backfill as discussed in the previous section. It is expected that the effects of water discharge behind the gabion walls and homeowner constructed walls would have the same negative effects to the FOS of the Retrofit Wall as discussed in Section
25 Geotechnical Investigation Bow Ridge Subdivision Phase 3 Final Figure 4-5 Cross Sections through Rebuilt Wall 4.4 Slope Inclinometer Results The slope inclinometers installed in the boreholes were monitored between July 2, 2009 and February 9, Displacements along both perpendicular and parallel to the retaining wall directions were measured. The results of the monitoring are presented in graphical format, plotted as borehole depth versus accumulated displacement, in Appendix E. It should be noted that due to ice blockage in the road boxes, inclinometers measurements in boreholes BH1 and BH4 were not possible between December 2009 and February Some inclinometer measurements have been removed from the graphs due to measurement errors. 20
26 Geotechnical Investigation Bow Ridge Subdivision Phase 3 Final The inclinometer measurements indicated that the maximum accumulated lateral displacements of the retaining walls during the measurement period were in the order of 7 mm at borehole BH1 and 8 mm at borehole BH8. Measured displacements at the other borehole locations ranged from negligible to less than 8 mm. It should be pointed out that the measured displacements represent the movements that occurred within the monitoring period only. The measured displacements do not represent total displacements experienced by the wall since construction, as significant displacements were observed prior to commencement of monitoring. It is also difficult to predict the rates of future displacements at a particular location, as future displacement rates depend on many factors such as backfill materials, moisture content, frost penetration, and seepage conditions. As such factors are highly variable along the walls, displacements rates can be expected to be highly variable as well. At borehole BH1, the inclinometer monitoring results indicated that the retaining wall is leaning forward at a gradual rate. It does not appear that a shear plane (failure plane) exists at this location. Based on the inclinometer results, we are of the opinion that failure planes do not exist within the measurement depths at the other borehole locations, with the exception of borehole BH8. At borehole BH8, the inclinometer results indicated that the gabion blocks are moving independently of each other, but generally tilting backwards. The results further show that there are movements indicative of impending bearing capacity failure in the soil below the retaining wall. From January 12, 2010 to February 9, 2010, the incremental movement was measured to be about 2 mm. It is expected that this movement will continue until bearing capacity failure of the underlying soil. 4.5 Global Stability of the Subdivision and Local Stability of the Walls Based on conversations with representatives of the Town of Cochrane, it is understood that there are concerns regarding the global stability of the entire Bow Ridge Subdivision. A study of the stability of the subdivision was not within Stantec s scope of work and therefore the opinion offered below is a conditional one. The only definitive method of determining the potential for global instability would be to extend the geotechnical study to cover the subdivision as a whole. In this way, relevant geotechnical data could be gathered and a technical recommendation could be prepared. Stantec has only studied the stability conditions of the retaining walls and has not studied the global stability of the subdivision. However, we are of the opinion that there are no immediate signs of global instability observed or reported within the subdivision outside of the immediate areas of the retaining walls. Should there be global stability issues affecting the subdivision outside of the immediate areas of the retaining walls, we are of the opinion that some or all of the following distresses would be evident: Cracking or differential movements of asphalt pavements, concrete sidewalks, and other surface structures Damages to underground utilities Cracking and other distresses of houses Tension cracks within the subdivision outside of the areas immediately adjacent to the retaining walls Should the above noted distresses be observed, Stantec should be contacted immediately to determine if a study of global instability of the subdivision is required. 21
.")
27 Geotechnical Investigation Bow Ridge Subdivision Phase 3 Final The wooden fences adjacent to the walkway connecting Bow Ridge Link and Bow Ridge Drive have observed to have buckled (see Photo 4-1). The severity of buckling of the fence panels appears to be progressive (i.e. the panels buckle more near the slope and progressively less away from the slope). Stantec is of the opinion that the buckling is the result of the retaining wall moving laterally (forward) pushing on the soil underneath the walkway and the asphalt pavement. Typically the effect of the pushing would be expected to be quite localized and immediately in front of the wall. We are of the opinion that the reason why the effect of the pushing is observed a long distance from the wall at this location is due to the asphalt pavement. Since asphalt is a stiff material, it moves as a rigid unit thus essentially transmits the lateral movement of the wall a long distance from the wall, dissipating the total displacement gradually, thus causing progressively less buckling of the fence panels with increased distance from the wall. We are of the opinion that this progressive buckling observed is not a sign of global instability of the subdivision. Photo 4-1 Progressive Buckling of Fence 22
28 Geotechnical Investigation Bow Ridge Subdivision Phase 3 Final As indicated in Section 4.4, we are of the opinion that shear planes do not exist behind the retaining wall with the exception of borehole BH8. Therefore, sudden shear type failure of the walls is not expected. As such, residential structures adjacent to the walls are considered to be safe. However, it should be expected that lateral displacements of the walls will continue. In time, localized failures of the walls can be expected. Such failures may include the collapse of localized gabion baskets, which may pose dangerous conditions to people and properties located immediately adjacent to the wall when the event occurs. At borehole BH8 location, there are signs indicative of an impending bearing capacity failure. At the time of failure, it is expected that the wall will undergo excessive settlement and tilting, leading to rapid collapse of the wall. However, it is difficult to predict when the bearing capacity failure will occur. 23
29 Geotechnical Investigation Bow Ridge Subdivision Phase 3 Final 5 RECOMMENDATIONS Based on our observations, investigation, and analysis, it is anticipated that observed distresses will continue to worsen, including the following conditions: The retaining walls will continue to move laterally (outward), pushing onto stairways, fences, decks, etc. where such structures are close by. As the retaining walls continue to move outward, the backfill soil behind the walls will continue to settle, and tension cracks will develop. Water will seep into the soils and accelerate the movement and settlement. The above mechanism will ultimately lead to localized failures of gabion baskets. Continued longitudinal differential settlements of the retaining walls will occur. Based on the study presented herein, Stantec offers the following recommendations: Remediation of the existing retaining walls using the existing design will not be effective, as the original design has deficiencies as outlined above. Previous remediation incorporating the original wall has proven to be ineffective. It is, therefore, our opinion that the retaining walls should be removed entirely and reconstructed. Based on the existing soil and groundwater conditions, it is expected that Mechanically Stabilized Earth (MSE) walls (see Appendix G) or reinforced concrete walls will be the most suitable retaining structure types for the Site. Should it be decided to proceed with the replacement of the walls, the type of retaining structures and geotechnical recommendations for the detailed design of the walls can be provided. The wall at and near borehole BH8 should be repaired or reconstructed as soon as possible. Continued monitoring at all borehole locations on a monthly basis should be carried out prior to repair or reconstruction to provide warning of potentially dangerous situations. The monitoring program should be reviewed annually. Homeowners need to be advised that downspouts should not discharge directly on to the gabion retaining walls. Construction of other retaining walls within backyards without proper geotechnical design is not recommended. 24
30 Geotechnical Investigation Bow Ridge Subdivision Phase 3 Final 6 CLOSURE This report has been prepared for the sole benefit of The Town of Cochrane and their agents, and may not be used by any third party without the express written consent of Stantec and The Town of Cochrane. Any use which a third party makes of this report is the responsibility of such third party. Use of this report is subject to the Statement of General Conditions provided in Appendix A. It is the responsibility of the Town of Cochrane who is identified as the Client within the Statement of General Conditions, and its agents to review the conditions and to notify Stantec should any of these not be satisfied. The Statement of General Conditions addresses the following: Use of the report Basis of the report Standard of care Interpretation of site conditions Varying or unexpected site conditions Planning, design or construction We trust the above information meets with your present requirements. Should you have any questions or require further information, please contact us. Yours truly, STANTEC CONSULTING LTD. Signed By Edwin Choy Signed By Charles Kwok Edwin C.H. Choy, M.Sc., P.Eng. Charles C.K. Kwok, M.Sc., P.Eng. Geotechnical Engineer Senior Principal Senior Geotechnical Engineer Tel: (403) Tel: (403) Fax: (403) Fax: (403) edwin.choy@stantec.com charles.kwok@stantec.com V:\1233\active\ \bow_ridge_subdivision\Report\R06_Fnl_Geo_Apr Bow Ridge.docx APEGGA Permit No. P258 25
31 Geotechnical Investigation Bow Ridge Subdivision Phase 3 Final APPENDIX A Statement of General Conditions
32 Geotechnical Investigation Bow Ridge Subdivision Phase 3 Final USE OF THIS REPORT: This report has been prepared for the sole benefit of the Client or its agent and may not be used by any third party without the express written consent of Stantec and the Client. Any use which a third party makes of this report is the responsibility of such third party. BASIS OF THE REPORT: The information, opinions, and/or recommendations made in this report are in accordance with Stantec s present understanding of the site specific project as described by the Client. The applicability of these is restricted to the site conditions encountered at the time of the investigation or study. If the proposed site specific project differs or is modified from what is described in this report or if the site conditions are altered, this report is no longer valid unless Stantec is requested by the Client to review and revise the report to reflect the differing or modified project specifics and/or the altered site conditions. STANDARD OF CARE: Preparation of this report, and all associated work, was carried out in accordance with the normally accepted standard of care in the state or province of execution for the specific professional service provided to the Client. No other warranty is made. INTERPRETATION OF SITE CONDITIONS: Soil, rock, or other material descriptions, and statements regarding their condition, made in this report are based on site conditions encountered by Stantec at the time of the work and at the specific testing and/or sampling locations. Classifications and statements of condition have been made in accordance with normally accepted practices which are judgmental in nature; no specific description should be considered exact, but rather reflective of the anticipated material behaviour. Extrapolation of in situ conditions can only be made to some limited extent beyond the sampling or test points. The extent depends on variability of the soil, rock and groundwater conditions as influenced by geological processes, construction activity, and site use. VARYING OR UNEXPECTED CONDITIONS: Should any site or subsurface conditions be encountered that are different from those described in this report or encountered at the test locations, Stantec must be notified immediately to assess if the varying or unexpected conditions are substantial and if reassessments of the report conclusions or recommendations are required. Stantec will not be responsible to any party for damages incurred as a result of failing to notify Stantec that differing site or sub-surface conditions are present upon becoming aware of such conditions. PLANNING, DESIGN, OR CONSTRUCTION: Development or design plans and specifications should be reviewed by Stantec, sufficiently ahead of initiating the next project stage (property acquisition, tender, construction, etc), to confirm that this report completely addresses the elaborated project specifics and that the contents of this report have been properly interpreted. Specialty quality assurance services (field observations and testing) during construction are a necessary part of the evaluation of sub-subsurface conditions and site preparation works. Site work relating to the recommendations included in this report should only be carried out in the presence of a qualified geotechnical engineer; Stantec cannot be responsible for site work carried out without being present.
33 Geotechnical Investigation Bow Ridge Subdivision Phase 3 Final APPENDIX B Figures

34 SITE Ã 22 EK V:\1233\active\ \bow_ridge_subdivision\Drawings\cad\Figure_1_0.mxd 1: ,000 1,500m Date: February 16, 2010 Project Number Client/Project TOWN OF COCHRANE GEOTECHNICAL INVESTIGATION BOW RIDGE SUBDIVISION PHASE 3, COCHRANE, AB Figure No th St. SE Calgary, AB T2A 7H8 This map is not intended to replace a survey by a licensed Surveyor. Stantec does not certify the accuracy of the data. This map is for reference only and should not be used for construction. SITE Title 1.0 SITE LOCATION PLAN


35
36 Geotechnical Investigation Bow Ridge Subdivision Phase 3 Final APPENDIX C Borehole Records
37 SOIL DESCRIPTION SYMBOLS AND TERMS USED ON BOREHOLE AND TEST PIT RECORDS Terminology describing common soil genesis: Topsoil - mixture of soil and humus capable of supporting vegetative growth Peat - mixture of visible and invisible fragments of decayed organic matter Till - unstratified glacial deposit which may range from clay to boulders Fill - material below the surface identified as placed by humans (excluding buried services) Terminology describing soil structure: Desiccated - having visible signs of weathering by oxidization of clay minerals, shrinkage cracks, etc. Fissured - having cracks, and hence a blocky structure Varved - composed of regular alternating layers of silt and clay Stratified - composed of alternating successions of different soil types, e.g. silt and sand Layer - > 75 mm in thickness Seam - 2 mm to 75 mm in thickness Parting - < 2 mm in thickness Terminology describing soil types: The classification of soil types are made on the basis of grain size and plasticity in accordance with the Unified Soil Classification System (USCS) (ASTM D 2487 or D 2488). The classification excludes particles larger than 76 mm (3 inches). The USCS provides a group symbol (e.g. SM) and group name (e.g. silty sand) for identification. Terminology describing cobbles, boulders, and non-matrix materials (organic matter or debris): Terminology describing materials outside the USCS, (e.g. particles larger than 76 mm, visible organic matter, construction debris) is based upon the proportion of these materials present: Trace, or occasional Less than 10% Some 10-20% Frequent > 20% Terminology describing compactness of cohesionless soils: The standard terminology to describe cohesionless soils includes compactness (formerly "relative density"), as determined by the Standard Penetration Test N-Value (also known as N-Index). A relationship between compactness condition and N-Value is shown in the following table. Compactness Condition SPT N-Value Very Loose <4 Loose 4-10 Compact Dense Very Dense >50 Terminology describing consistency of cohesive soils: The standard terminology to describe cohesive soils includes the consistency, which is based on undrained shear strength as measured by in situ vane tests, penetrometer tests, or unconfined compression tests. Consistency Undrained Shear Strength kips/sq.ft. kpa Very Soft <0.25 <12.5 Soft Firm Stiff Very Stiff Hard >4.0 >200 SYMBOLS AND TERMS USED ON BOREHOLE AND TEST PIT RECORDS MARCH 2009 Page 1 of 3
38 ROCK DESCRIPTION Terminology describing rock quality: RQD Rock Mass Quality 0-25 Very Poor Poor Fair Good Excellent Rock quality classification is based on a modified core recovery percentage (RQD) in which all pieces of sound core over 100 mm long are counted as recovery. The smaller pieces are considered to be due to close shearing, jointing, faulting, or weathering in the rock mass and are not counted. RQD was originally intended to be done on NW core; however, it can be used on different core sizes if the bulk of the fractures caused by drilling stresses are easily distinguishable from in situ fractures. The terminology describing rock mass quality based on RQD is subjective and is underlain by the presumption that sound strong rock is of higher engineering value than fractured weak rock. Terminology describing rock mass: Spacing (mm) Joint Classification Bedding, Laminations, Bands > 6000 Extremely Wide Very Wide Very Thick Wide Thick Moderate Medium Close Thin Very Close Very Thin <20 Extremely Close Laminated <6 - Thinly Laminated Terminology describing rock strength: Strength Classification Unconfined Compressive Strength (MPa) Extremely Weak < 1 Very Weak 1 5 Weak 5 25 Medium Strong Strong Very Strong Extremely Strong > 250 Terminology describing rock weathering: Term Fresh Slightly Weathered Moderately Weathered Highly Weathered Completely Weathered Description No visible signs of rock weathering. Slight discolouration along major discontinuities Discolouration indicates weathering of rock on discontinuity surfaces. All the rock material may be discoloured. Less than half the rock is decomposed and/or disintegrated into soil. More than half the rock is decomposed and/or disintegrated into soil. All the rock material is decomposed and/or disintegrated into soil. The original mass structure is still largely intact. SYMBOLS AND TERMS USED ON BOREHOLE AND TEST PIT RECORDS MARCH 2009 Page 2 of 3
39 STRATA PLOT Strata plots symbolize the soil or bedrock description. They are combinations of the following basic symbols. The dimensions within the strata symbols are not indicative of the particle size, layer thickness, etc. Boulders Cobbles Gravel Sand Silt Clay Organics Asphalt Concrete Fill Igneous Bedrock Metamorphic Bedrock Sedimentary Bedrock SAMPLE TYPE ST DP PS WS HQ, NQ, BQ, etc. Split spoon sample (obtained by performing the Standard Penetration Test) Shelby tube or thin wall tube Direct-Push sample (small diameter tube sampler hydraulically advanced) Piston sample Bulk sample Wash sample Rock core samples obtained with the use of standard size diamond coring bits. WATER LEVEL MEASUREMENT measured in standpipe, piezometer, or well inferred RECOVERY For soil samples, the recovery is recorded as the length of the soil sample recovered. For rock core, recovery is defined as the total cumulative length of all core recovered in the core barrel divided by the length drilled and is recorded as a percentage on a per run basis. N-VALUE Numbers in this column are the field results of the Standard Penetration Test: the number of blows of a 140 pound (64 kg) hammer falling 30 inches (760 mm), required to drive a 2 inch (50.8 mm) O.D. split spoon sampler one foot (305 mm) into the soil. For split spoon samples where insufficient penetration was achieved and N-values cannot be presented, the number of blows are reported over sampler penetration in millimetres (e.g. 50/75). Some design methods make use of N value corrected for various factors such as overburden pressure, energy ratio, borehole diameter, etc. No corrections have been applied to the N-values presented on the log. DYNAMIC CONE PENETRATION TEST (DCPT) Dynamic cone penetration tests are performed using a standard 60 degree apex cone connected to A size drill rods with the same standard fall height and weight as the Standard Penetration Test. The DCPT value is the number of blows of the hammer required to drive the cone one foot (305 mm) into the soil. The DCPT is used as a probe to assess soil variability. OTHER TESTS S H k γ G s CD CU UU DS C Q u I p Sieve analysis Hydrometer analysis Laboratory permeability Unit weight Specific gravity of soil particles Consolidated drained triaxial Consolidated undrained triaxial with pore pressure measurements Unconsolidated undrained triaxial Direct Shear Consolidation Unconfined compression Point Load Index (I p on Borehole Record equals I p(50) in which the index is corrected to a reference diameter of 50 mm) Single packer permeability test; test interval from depth shown to bottom of borehole Double packer permeability test; test interval as indicated Falling head permeability test using casing Falling head permeability test using well point or piezometer SYMBOLS AND TERMS USED ON BOREHOLE AND TEST PIT RECORDS MARCH 2009 Page 3 of 3
40 Page 1 of 1 BOREHOLE RECORD BH1 DEPTH(m) CLIENT LOCATION DATES (mm/dd/yy): BORING ELEVATION(m) Stantec Consulting Ltd. Bow Ridge, Cochrane, AB 6/4/09 SOIL DESCRIPTION TOPSOIL Very stiff brown CLAY (CL-CH) - with light brown and grey mottling, trace silt and gravel, damp to moist STRATA PLOT TYPE WATER LEVEL NUMBER SAMPLES RECOVERY mm m (7/2/09) N-VALUE OR RQD % MONITOR WELL/ PIEZOMETER PROJECT No. BH SIZE DATUM mm UNDRAINED SHEAR STRENGTH - kpa WATER CONTENT & ATTERBERG LIMITS Pocket Penetrometer kpa STANDARD PENETRATION TEST, BLOWS/0.3m WP W WL greyish brown below 7.3 m - brown, trace claystone fragments below 8.4 m End of Borehole (9.9 m) Borehole dry and open upon completion 25 mm standpipe hand slotted from 3.8 m to 6.9 m Annulus backfilled with sand and cuttings Bentonite seal at surface App'd Sep :23:22
41 Page 1 of 1 BOREHOLE RECORD BH2 DEPTH(m) CLIENT LOCATION DATES (mm/dd/yy): BORING ELEVATION(m) Stantec Consulting Ltd. Bow Ridge, Cochrane, AB 6/8/09 SOIL DESCRIPTION TOPSOIL Very stiff brown CLAY (CL-CH) - with light brown and grey mottling, trace silt, damp to moist STRATA PLOT TYPE WATER LEVEL NUMBER SAMPLES RECOVERY mm 400 Dry (7/2/09) N-VALUE OR RQD % 17 MONITOR WELL/ PIEZOMETER PROJECT No. BH SIZE DATUM mm UNDRAINED SHEAR STRENGTH - kpa WATER CONTENT & ATTERBERG LIMITS Pocket Penetrometer kpa STANDARD PENETRATION TEST, BLOWS/0.3m WP W WL End of Borehole (6.9 m) Borehole dry and open upon completion 25 mm standpipe hand slotted from 2.3 m to 5.3 m Annulus backfilled with sand and cuttings Bentonite seal at surface App'd Sep :23:28
42 Page 1 of 1 BOREHOLE RECORD BH3 DEPTH(m) CLIENT LOCATION DATES (mm/dd/yy): BORING ELEVATION(m) Stantec Consulting Ltd. Bow Ridge, Cochrane, AB 6/4/09 SOIL DESCRIPTION ASPHALT FILL: gravel, trace cobbles FILL: brown clay - trace to some gravel, trace silt and sand, damp to moist STRATA PLOT TYPE WATER LEVEL NUMBER SAMPLES RECOVERY mm m (7/2/09) N-VALUE OR RQD % 7 MONITOR WELL/ PIEZOMETER PROJECT No. BH SIZE DATUM WATER CONTENT & ATTERBERG LIMITS mm UNDRAINED SHEAR STRENGTH - kpa Pocket Penetrometer kpa STANDARD PENETRATION TEST, BLOWS/0.3m WP W WL Stiff brown CLAY (CL-CH) - with light brown and grey mottling, trace silt and gravel, damp to moist ST trace sand lenses and claystone fragments below 8.7 m End of Borehole (9.9 m) Borehole dry and open upon completion 25 mm standpipe hand slotted from 5.3 m to 8.4 m Annulus backfilled with sand and cuttings Bentonite seal at surface App'd Sep :23:34
43 Page 1 of 1 BOREHOLE RECORD BH4 DEPTH(m) CLIENT LOCATION DATES (mm/dd/yy): BORING ELEVATION(m) Stantec Consulting Ltd. Bow Ridge, Cochrane, AB 6/10/09 SOIL DESCRIPTION TOPSOIL FILL: brown clay - trace silt, organics and rootlets, damp Stiff brown CLAY (CL-CH) - with light brown and grey mottling, trace silt, gravel and oxides, damp to moist STRATA PLOT TYPE WATER LEVEL NUMBER SAMPLES RECOVERY mm m (7/2/09) N-VALUE OR RQD % MONITOR WELL/ PIEZOMETER PROJECT No. BH SIZE DATUM mm UNDRAINED SHEAR STRENGTH - kpa WATER CONTENT & ATTERBERG LIMITS Pocket Penetrometer kpa STANDARD PENETRATION TEST, BLOWS/0.3m W P W WL trace coal and claystone fragments below 6.6 m End of Borehole (9.9 m) Borehole dry and open upon completion 25 mm standpipe hand slotted from 5.3 m to 8.4 m Annulus backfilled with sand and cuttings Bentonite seal at surface App'd Sep :23:39
44 Page 1 of 1 BOREHOLE RECORD BH5 DEPTH(m) CLIENT LOCATION DATES (mm/dd/yy): BORING ELEVATION(m) Stantec Consulting Ltd. Bow Ridge, Cochrane, AB 6/10/09 SOIL DESCRIPTION TOPSOIL Stiff brown CLAY (CL-CH) - with light brown and grey mottling, trace silt and gravel, damp to moist Very stiff brown CLAY (CL) - silty, trace sand, damp STRATA PLOT TYPE WATER LEVEL NUMBER SAMPLES RECOVERY mm Dry (7/2/09) N-VALUE OR RQD % MONITOR WELL/ PIEZOMETER PROJECT No. BH SIZE DATUM mm UNDRAINED SHEAR STRENGTH - kpa WATER CONTENT & ATTERBERG LIMITS Pocket Penetrometer kpa STANDARD PENETRATION TEST, BLOWS/0.3m WP W WL Dense brown silty SAND (SM) - dry to damp m thick layer of clay at 6.3 m - moist to wet below 6.9 m End of Borehole (7.3 m) Borehole dry and open upon completion 25 mm standpipe hand slotted from 3.0 m to 6.9 m Annulus backfilled with sand and cuttings Bentonite seal at surface App'd Sep :23:43
45 Page 1 of 1 BOREHOLE RECORD BH6 DEPTH(m) CLIENT LOCATION DATES (mm/dd/yy): BORING ELEVATION(m) Stantec Consulting Ltd. Bow Ridge, Cochrane, AB 6/17/09 SOIL DESCRIPTION TOPSOIL Firm to stiff brown CLAY (CL-CH) - with grey mottling, trace silt and gravel, damp to moist STRATA PLOT TYPE WATER LEVEL NUMBER SAMPLES RECOVERY mm m (7/2/09) N-VALUE OR RQD % 6 14 MONITOR WELL/ PIEZOMETER PROJECT No. BH SIZE DATUM WATER CONTENT & ATTERBERG LIMITS mm UNDRAINED SHEAR STRENGTH - kpa Pocket Penetrometer kpa STANDARD PENETRATION TEST, BLOWS/0.3m W P W WL silty, damp below 6.6 m Compact brown sandy SILT (ML) - trace gravel, dry to damp - interbedded with clay layers below 8.2 m End of Borehole (9.9 m) Borehole dry and open upon completion 25 mm standpipe hand slotted from 3.8 m to 6.9 m Annulus backfilled with sand and cuttings Bentonite seal at surface App'd Sep :23:47
46 Page 1 of 1 BOREHOLE RECORD BH7 DEPTH(m) CLIENT LOCATION ELEVATION(m) Stantec Consulting Ltd. Bow Ridge, Cochrane, AB 6/16/09 DATES (mm/dd/yy): BORING SOIL DESCRIPTION FILL: 40 mm gravel FILL: brown gravelly clay - trace silt and sand, damp to moist FILL: brown gravel - trace to some clay, trace silt and sand, damp to moist STRATA PLOT TYPE WATER LEVEL NUMBER SAMPLES RECOVERY mm Dry (7/2/09) N-VALUE OR RQD % 3 5 MONITOR WELL/ PIEZOMETER PROJECT No. BH SIZE DATUM mm UNDRAINED SHEAR STRENGTH - kpa WATER CONTENT & ATTERBERG LIMITS Pocket Penetrometer kpa STANDARD PENETRATION TEST, BLOWS/0.3m WP W WL 4 5 Compact brown silty SAND (SM) - damp End of Borehole (7.9 m) due to auger refusal Slough to 3.4 m Borehole dry upon completion 25 mm standpipe hand slotted from 3.0 m to 6.1 m Annulus backfilled with sand and cuttings Bentonite seal at surface App'd Sep :23:51
47 Page 1 of 1 BOREHOLE RECORD BH8 DEPTH(m) 0 1 CLIENT LOCATION DATES (mm/dd/yy): BORING ELEVATION(m) Stantec Consulting Ltd. Bow Ridge, Cochrane, AB 6/12/09 SOIL DESCRIPTION FILL: 40 mm gravel FILL: brown clayey gravel 1 - trace silt and sand, moist STRATA PLOT TYPE WATER LEVEL NUMBER SAMPLES RECOVERY mm Dry (7/2/09) N-VALUE OR RQD % MONITOR WELL/ PIEZOMETER PROJECT No. BH SIZE DATUM mm UNDRAINED SHEAR STRENGTH - kpa WATER CONTENT & ATTERBERG LIMITS Pocket Penetrometer kpa STANDARD PENETRATION TEST, BLOWS/0.3m WP W WL Loose to compact brown silty SAND (SM) - interbedded with clay layers, trace clay, damp Very stiff brown CLAY (CL) - trace silt, sand and gravel, damp to moist End of Borehole (9.1 m) due to auger refusal Slough to 3.4 m Borehole dry upon completion 25 mm standpipe hand slotted from 3.0 m to 6.1 m Annulus backfilled with sand and cuttings Bentonite seal at surface App'd Sep :23:55
48 Page 1 of 1 BOREHOLE RECORD BH9 DEPTH(m) CLIENT LOCATION DATES (mm/dd/yy): BORING ELEVATION(m) Stantec Consulting Ltd. Bow Ridge, Cochrane, AB 6/11/09 SOIL DESCRIPTION TOPSOIL Compact brown silty SAND (SM) - damp - interbedded with clay layers below 0.8 m STRATA PLOT TYPE WATER LEVEL 1 2 NUMBER SAMPLES RECOVERY mm Dry (7/2/09) N-VALUE OR RQD % MONITOR WELL/ PIEZOMETER PROJECT No. BH SIZE DATUM mm UNDRAINED SHEAR STRENGTH - kpa WATER CONTENT & ATTERBERG LIMITS Pocket Penetrometer kpa STANDARD PENETRATION TEST, BLOWS/0.3m W P W WL moist to wet below 5.3 m End of Borehole (6.9 m) Borehole dry and open upon completion 25 mm standpipe hand slotted from 3.0 m to 6.1 m Annulus backfilled with sand and cuttings Bentonite seal at surface App'd Sep :23:58
49 Page 1 of 1 BOREHOLE RECORD BH10 DEPTH(m) CLIENT LOCATION ELEVATION(m) Stantec Consulting Ltd. Bow Ridge, Cochrane, AB 6/16/09 DATES (mm/dd/yy): BORING SOIL DESCRIPTION FILL: 40 mm gravel FILL: brown gravelly clay - trace silt and sand, damp to moist FILL: brown gravel - trace to some clay, trace silt and sand, damp to moist STRATA PLOT TYPE WATER LEVEL NUMBER 1 2 SAMPLES RECOVERY mm 0 0 Dry (7/2/09) N-VALUE OR RQD % 4 5 MONITOR WELL/ PIEZOMETER PROJECT No. BH SIZE DATUM mm UNDRAINED SHEAR STRENGTH - kpa WATER CONTENT & ATTERBERG LIMITS Pocket Penetrometer kpa STANDARD PENETRATION TEST, BLOWS/0.3m WP W W L 4 5 Compact brown silty SAND (SM) - interbedded with clay layers, dry to damp Very stiff brown CLAY (CL) - trace to some gravel, trace silt, sand and coal, damp to moist End of Borehole (9.0 m) due to auger refusal Slough to 3.4 m Borehole dry upon completion 25 mm standpipe hand slotted from 3.0 m to 6.1 m Annulus backfilled with sand and cuttings Bentonite seal at surface App'd Sep :24:35
50 Page 1 of 1 BOREHOLE RECORD BH11 DEPTH(m) CLIENT LOCATION DATES (mm/dd/yy): BORING ELEVATION(m) Stantec Consulting Ltd. Bow Ridge, Cochrane, AB 6/11/09 SOIL DESCRIPTION TOPSOIL Stiff brown CLAY (CL) - with light brown mottling, trace silt, damp to moist - silty, trace gravel, seepage below 1.2 m Compact brown SILT and SAND (ML-SM) - dry to damp STRATA PLOT TYPE WATER LEVEL Dry (7/2/09) NUMBER SAMPLES RECOVERY mm N-VALUE OR RQD % MONITOR WELL/ PIEZOMETER PROJECT No. BH SIZE DATUM mm UNDRAINED SHEAR STRENGTH - kpa WATER CONTENT & ATTERBERG LIMITS Pocket Penetrometer kpa STANDARD PENETRATION TEST, BLOWS/0.3m WP W W L interbedded with clay layers below 4.8 m - trace clay, moist to wet below 5.2 m End of Borehole (6.9 m) Borehole dry and open upon completion 25 mm standpipe hand slotted from 3.0 m to 6.1 m Annulus backfilled with sand and cuttings Bentonite seal at surface App'd Sep :24:39
: BORING ELEVATION(m) SOIL DESCRIPTION TOPSOIL FILL: brown clay - silty, trace sand, gravel and rootlets, moist Stiff brown CLAY (CL-CH) - with grey")
51 Page 1 of 1 BOREHOLE RECORD BH12 DEPTH(m) CLIENT LOCATION Stantec Consulting Ltd. Bow Ridge, Cochrane, AB 6/18/09 DATES (mm/dd/yy): BORING ELEVATION(m) SOIL DESCRIPTION TOPSOIL FILL: brown clay - silty, trace sand, gravel and rootlets, moist Stiff brown CLAY (CL-CH) - with grey mottling, trace silt and gravel, damp to moist STRATA PLOT WATER LEVEL SAMPLES TYPE NUMBER RECOVERY N-VALUE OR RQD % mm m (7/2/09) MONITOR WELL/ PIEZOMETER PROJECT No. BH SIZE DATUM mm UNDRAINED SHEAR STRENGTH - kpa WP W WL WATER CONTENT & ATTERBERG LIMITS Pocket Penetrometer kpa STANDARD PENETRATION TEST, BLOWS/0.3m interbedded with silt seams, trace oxides below 6.9 m Compact to dense brown silty SAND (SM) - dry to damp End of Borehole (9.9 m) Borehole dry and open upon completion 25 mm standpipe hand slotted from 3.0 m to 6.1 m Annulus backfilled with sand and cuttings Bentonite seal at surface App'd Sep :24:43
52 Geotechnical Investigation Bow Ridge Subdivision Phase 3 Final APPENDIX D Laboratory Testing
53 Grain Size Analysis ASTM C136, ASTM C117 or CSA A23.3-2A, CSA A23.2-5A Client: Stantec Consulting Ltd. Project Name: Bow Ridge Retaining Wall Project No: OFFICE LABORATORY 805-8th Avenue SW th Street SE Suite 300 Calgary, Alberta Calgary, Alberta Canada T2C 1G4 Canada T2P 1H7 Tel: (403) Tel: (403) SAMPLE No: 7 SOURCE: BH5 TESTED BY: S.Evans SAMPLE DESCRIPTION: Silty Sand (SM) DATE SAMPLED: DATE RECEIVED: DATE TESTED: /09/09 Fax: (403) Fax: (403) Sieve Sample Specifications (mm) % Passing Lower Upper Percent Passing Sieve Size (mm) 0.01 COMMENTS: Reviewed By: % Passing Upper Limit Lower Limit Reporting of these test results constitutes a testing service only. Engineering interpretation or evaluation of the test results is provided only on written request. The data presented above is for the sole use of the client stipulated above. Stantec is not responsible, nor can be held liable, for the use of this report by any other party, with or without the knowledge of Stantec. Form MAT.003B, Rev. 3, 2009/04/20 One Team. Infinite Solutions.
54 Grain Size Analysis ASTM C136, ASTM C117 or CSA A23.3-2A, CSA A23.2-5A Client: Stantec Consulting Ltd. Project Name: Bow Ridge Retaining Wall Project No: OFFICE LABORATORY 805-8th Avenue SW th Street SE Suite 300 Calgary, Alberta Calgary, Alberta Canada T2C 1G4 Canada T2P 1H7 Tel: (403) Tel: (403) SAMPLE No: 10 SOURCE: BH6 TESTED BY: K.Asgarpour SAMPLE DESCRIPTION: Sandy Silt (ML) DATE SAMPLED: DATE RECEIVED: DATE TESTED: /10/09 Fax: (403) Fax: (403) Sieve Sample Specifications (mm) % Passing Lower Upper Percent Passing Sieve Size (mm) COMMENTS: Reviewed By: % Passing Upper Limit Lower Limit Reporting of these test results constitutes a testing service only. Engineering interpretation or evaluation of the test results is provided only on written request. The data presented above is for the sole use of the client stipulated above. Stantec is not responsible, nor can be held liable, for the use of this report by any other party, with or without the knowledge of Stantec. Form MAT.003B, Rev. 3, 2009/04/20 One Team. Infinite Solutions.
55 Grain Size Analysis ASTM C136, ASTM C117 or CSA A23.3-2A, CSA A23.2-5A Client: Stantec Consulting Ltd. Project Name: Bow Ridge Retaining Wall Project No: OFFICE LABORATORY 805-8th Avenue SW th Street SE Suite 300 Calgary, Alberta Calgary, Alberta Canada T2C 1G4 Canada T2P 1H7 Tel: (403) Tel: (403) SAMPLE No: 3 SOURCE: BH8 TESTED BY: S.Evans SAMPLE DESCRIPTION: Clayey Gravel (GC) DATE SAMPLED: DATE RECEIVED: DATE TESTED: /09/09 Fax: (403) Fax: (403) Percent Passing Sieve Sample Specifications (mm) % Passing Lower Upper Sieve Size (mm) COMMENTS: Reviewed By: % Passing Upper Limit Lower Limit Reporting of these test results constitutes a testing service only. Engineering interpretation or evaluation of the test results is provided only on written request. The data presented above is for the sole use of the client stipulated above. Stantec is not responsible, nor can be held liable, for the use of this report by any other party, with or without the knowledge of Stantec. Form MAT.003B, Rev. 3, 2009/04/20 One Team. Infinite Solutions.
56 Geotechnical Investigation Bow Ridge Subdivision Phase 3 Final APPENDIX E Slope Inclinometer Readings
57 Borehole BH1 Depth vs Displacement (Perpendicular to the Retaining Wall) Depth (m) IN OUT 10 Aug Sep 09 4 Nov 09 3 Dec Cumulative Displacement (mm)
58 Borehole BH1 Depth vs Displacement (Parallel to the Retaining Wall) Depth (m) RIGHT Facing Wll Wall LEFT Facing Wll Wall 10 Aug Sep 09 4 Nov 09 3 Dec Cumulative Displacement (mm)
59 Borehole BH2 Depth vs Displacement (Perpendicular to the Retaining Wall) Depth (m) IN OUT 10 Aug Sep 09 4 Nov 09 3 Dec Jan 10 9 Feb Cumulative Displacement (mm)
60 Borehole BH2 Depth vs Displacement (Parallel to the Retaining Wall) Depth (m) RIGHT Facing Wll Wall LEFT Facing Wll Wall 10 Aug Sep 09 4 Nov 09 3 Dec Jan 10 9 Feb Cumulative Displacement (mm)
61 Borehole BH3 Depth vs Displacement (Perpendicular to the Retaining Wall) Depth (m) IN OUT 4 Nov 09 3 Dec Jan Feb Cumulative Displacement (mm)
62 Borehole BH3 Depth vs Displacement (Parallel to the Retaining Wall) Depth (m) RIGHT Facing Wll Wall LEFT Facing Wll Wall 4 Nov 09 3 Dec Jan Feb Cumulative Displacement (mm)
63 Borehole BH4 Depth vs Displacement (Perpendicular to the Retaining Wall) Depth (m) IN 5 6 OUT 10 Aug Sep 09 4 Nov Cumulative Displacement (mm)
64 Borehole BH4 Depth vs Displacement (Parallel to the Retaining Wall) Depth (m) RIGHT Facing Wll Wall 5 6 LEFT Facing Wll Wall 10 Aug Sep Cumulative Displacement (mm)
65 Borehole BH5 Depth vs Displacement (Perpendicular to the Retaining Wall) Depth (m) IN OUT 10 Aug Sep 09 4 Nov 09 3 Dec Jan 10 9 Feb Cumulative Displacement (mm)
66 Borehole BH5 Depth vs Displacement (Parallel to the Retaining Wall) Depth (m) RIGHT Facing Wll Wall LEFT Facing Wll Wall 10 Aug Sep 09 4 Nov 09 3 Dec Jan 10 9 Feb Cumulative Displacement (mm)
67 Borehole BH6 Depth vs Displacement (Perpendicular to the Retaining Wall) Depth (m) IN 5 6 OUT 10 Sep 09 4 Nov 09 3 Dec Jan Feb Cumulative Displacement (mm)
68 Borehole BH6 Depth vs Displacement (Parallel to the Retaining Wall) Depth (m) RIGHT Facing Wll Wall 5 6 LEFT Facing Wll Wall 10 Sep 09 4 Nov 09 3 Dec Jan Feb Cumulative Displacement (mm)
69 Borehole BH7 Depth vs Displacement (Perpendicular to the Retaining Wall) Depth (m) IN 5 6 OUT 10 Sep 09 4 Nov 09 3 Dec Jan Feb Cumulative Displacement (mm)
70 Borehole BH7 Depth vs Displacement (Parallel to the Retaining Wall) Depth (m) RIGHT Facing Wll Wall 5 6 LEFT Facing Wll Wall 10 Sep 09 4 Nov 09 3 Dec Jan Feb Cumulative Displacement (mm)
71 Borehole BH8 Depth vs Displacement (Perpendicular to the Retaining Wall) Depth (m) IN OUT 10 Sep 09 4 Nov Jan Feb Cumulative Displacement (mm)
72 Borehole BH8 Depth vs Displacement (Parallel to the Retaining Wall) Depth (m) RIGHT Facing Wll Wall LEFT Facing Wll Wall 10 Sep 09 4 Nov Jan Feb Cumulative Displacement (mm)
73 Borehole BH9 Depth vs Displacement (Perpendicular to the Retaining Wall) Depth (m) IN OUT 10 Aug Sep 09 4 Nov 09 3 Dec Jan 10 9 Feb Cumulative Displacement (mm)
74 Borehole BH9 Depth vs Displacement (Parallel to the Retaining Wall) Depth (m) RIGHT Facing Wll Wall 5 6 LEFT Facing Wll Wall 10 Sep 09 4 Nov 09 3 Dec Jan Feb Cumulative Displacement (mm)
75 Borehole BH10 Depth vs Displacement (Perpendicular to the Retaining Wall) Depth (m) IN OUT 10 Sep 09 4 Nov 09 3 Dec Jan Cumulative Displacement (mm)
76 Borehole BH10 Depth vs Displacement (Parallel to the Retaining Wall) Depth (m) RIGHT Facing Wll Wall LEFT Facing Wll Wall 10 Sep 09 4 Nov 09 3 Dec Jan Cumulative Displacement (mm)
77 Borehole BH11 Depth vs Displacement (Perpendicular to the Retaining Wall) Depth (m) IN 5 6 OUT 10 Sep 09 4 Nov 09 3 Dec Jan Feb Cumulative Displacement (mm)
78 Borehole BH11 Depth vs Displacement (Parallel to the Retaining Wall) Depth (m) RIGHT Facing Wll Wall 5 6 LEFT Facing Wll Wall 10 Sep 09 4 Nov 09 3 Dec Jan Feb Cumulative Displacement (mm)
79 Borehole BH12 Depth vs Displacement (Perpendicular to the Retaining Wall) Depth (m) IN OUT 10 Aug Sep 09 4 Nov 09 3 Dec Jan 10 9 Feb Cumulative Displacement (mm)
80 Borehole BH12 Depth vs Displacement (Parallel to the Retaining Wall) Depth (m) RIGHT Facing Wll Wall 5 6 LEFT Facing Wll Wall 10 Sep 09 4 Nov 09 3 Dec Jan Feb Cumulative Displacement (mm)
81 Geotechnical Investigation Bow Ridge Subdivision Phase 3 Final APPENDIX F Unified Soil Classification System
82 UNIFIED SOIL CLAIFICATION SYSTEM 1. INTRODUCTION Most soils are a heterogeneous accumulation of mineral grains not cemented together. However, the term `soil' or `earth', as used by engineers, includes virtually every type of uncemented or partially cemented inorganic and organic material found in the ground. Only hard rock which remains firm after exposure is wholly excluded. In order for engineers, both in the field and in the office, to be able to `speak the same language' with respect to soils, a standard method of identifying and classifying soils regarding their engineering characteristics rather than agricultural or geological or other characteristics is needed. A system of describing the soil (identification) and placing it into a category or group (classification) which has distinct engineering properties enables engineers to exchange information and to profit by one another's experiences. Borehole logs of soil profile explorations containing adequate descriptions and soil classifications (often from field identification) can be used in making preliminary estimates to determine the extent of additional field investigation needed for (a) final design, (b) planning an economical testing program, and (c) extending test results to additional explorations. For final design of important structures, however, visual soil classification must be supplemented by laboratory tests to determine performance characteristics of the soil, such as permeability, shearing strength, and compressibility, under expected field conditions. Knowledge of soil classification, including typical engineering properties of soils of the various groups, is especially valuable to the engineer engaged in prospecting for earth materials or investigating foundations for structures. Initially much work was concentrated on grain size relationships as illustrated by the U.S. Bureau of Public Roads classification system shown in Figure 1 (Rose, 1924), however this was found insufficient for engineering use. Figure 1. Textural classification system found inappropriate for engineering use. In 1952, the Bureau of Reclamation and the Corps of Engineers, with Professor A. Casagrande as consultant, reached agreement on a modification of Professor Casagrande's airfield classification, which they named the `Unified Soil Classification System' or `USCS' (Casagrande, 1948). Today (1996) the classification of soils is still base on the USCS it is more extensive and is periodically updated by the American Society for Testing Materials (ASTM) via their two Standards ASTM-D2457 and ASTM-D2488. The system takes into account the engineering properties of soils: it is descriptive and easy to associate with actual soils, and it has the flexibility of being adaptable both to the field and to the laboratory. Probably its greatest advantage is that a soil can be classified readily by visual and manual examination without the necessity for laboratory testing. The Unified Classification System is based on the sizes of the particles, the amounts of the various sizes, and the characteristics of the very fine grains. This method of classification of soils is recommended for use by the Canadian Foundation Engineering Manual and is described in the following text and summarized in Table SOIL COMPONENTS (A) Size (i) General Particles larger than 76 mm (3 inches) are excluded from the Unified Soil Classification System. However, the amount of such oversized material may be of great importance in the selection of sources for embankment material: hence borehole logs of explorations always contain information on quantity and size of particles larger than 76 mm (3 inches). Within the size range of the system (i.e. less than 76 mm) there are two major engineering performance divisions. (A third division is used for highly organic material, i.e. Peat): (a) Coarse grained soils have 50% by weight of their particles greater than the No. 200 sieve size (0.075 mm), approximately the smallest size visible by the unaided human eye. (b) Fine grained soils have 50% by weight of their particles less than the No. 200 sieve size (0.075 mm) and thus no individual particle should be visible by the unaided human eye. (c) Organic material (Symbol Pt): - Organic soils composed of more than 50% organic material by weight are known as Peat. (ii) Coarse Grained Fraction The coarse grain fraction is further divided into two soil types again based on sizing. These two types form part of the initial identification regarding engineering performance classification. For brevity they are given an identification symbol. The soil types and their symbol are - (a) Gravel (Symbol G) which identifies a coarse grained soil where 50% by weight of only that fraction of the soil retained on the No. 200 sieve (0.074 mm) is larger than the No. 4 sieve size (4.75 mm or about 3/16 inch). Size Subdivision: In order to aid the identification of particle sizes gravel has two particle size subdivisions as shown on Figure 2 and as given by:- Coarse gravel mm (3 inch) to 19 mm (3/4 inch), Figure 2. Ranges for coarse particle sizing. Fine Gravel mm (3/4 inch) to 4.75 mm (No. 4 sieve). There are no symbol identifications for size. (b) Sand (Symbol S) which identifies a coarse grained soil where 50% by weight of only that fraction of the soil retained on the No. 200 sieve (0.075 mm) is smaller than the No. 4 sieve size (4.75 mm). Size Subdivision: In order to aid the identification of particle sizes sand has three particle size subdivisions as shown on Figure 2 and as given by:- Coarse sand -- No. 4 (4.75 mm) to No. 10 sieves (2.00 mm), Medium sand -- No. 10 (2.00 mm) to No. 40 sieves (0.425 mm), Fine sand -- No. 40 (0.425 mm) to No. 200 sieves (0.074 mm). There are no symbol identifications for size. Unified Soil Classification System -- GEOTECHNICAL ENGINEERING Prof. G.P. Raymond. 9
83 Grading/Fines Subdivision -- In actual fact the engineering behaviour of the coarse grained soil is more dependent on whether it is clean or not (less than 5% by weight of fines being clean and more than 12% by weight of fines being dirty). If clean, the gradation influences performance and, if dirty, the fines influence performance. Thus in the Unified Soil Classification System gravels and sands are subdivided for classification purposes into (these subdivisions are defined under the heading of grading):- (i) Well Graded (Symbol _W) clean fraction, (ii) Poorly Graded (Symbol _P) clean fraction, (iii) Silt (Symbol _M) behaviour of fines of dirty fraction, and (iv) Clay (Symbol _C) behaviour of fines of dirty fraction. Note: Silt and Clay are also primary classification types for describing fine grained soils. Their definitions are given later. Extension -- Burmister (1951) proposed as an extension of the USCS that the proportions of the minor fractions may be identified by adding in small letters (percentages are by weight). (i) a for `and' representing 35 to 50% (ii) s for `some' representing 20 to 35% (iii) l for `little' representing 10 to 20% (iv) t for `trace' representing 0 to 10% Thus a well graded sand with 5% gravel sizes would be SWtG. ASTM D2488 uses the terms: Trace < 5%, Few for 5% to 10%; Little for 15% to 25%; Some for 30% to 45%; and Mostly for 50% to 100%. In addition Burmister suggested the size fractions in quantities larger than the 10% are recommended as being identified as (i) c where coarse sizes constitute more than 10% (ii) m where medium sizes constitute more than 10% (iii) f where fine sizes constitute more than 10% so that, where all three sand sizes are each present in quantities greater than 10% of the total, the identification would be `cmfs' placed after the main classification type (i.e. Swtg cmfs). These suggestions require little extra effort to include and may be useful. (iii) Fine Grained Fraction, or Fines The fine grained fraction of the soil sample is that portion smaller than the No. 200 (0.074 mm) sieve size. In the Unified Soil Classification System fines are not subdivided by sizing but by behaviour. The fines, if of inorganic origin, are of two types (these types are further described later under the heading relating to moisture): (a) SILT (Symbol M for the Swedish word Mo), and (b) CLAY (Symbol C). Older classification systems define clay as those particles smaller than mm (6 microns) as seen on Figure 1 (some use mm) and define silt as fines larger than clay sizes. However, it is a mistaken idea that the typical engineering characteristics of silt and clay correspond to particular grain sizes. Natural deposits of rock flour that exhibit all the properties of silt and none of clay may consist entirely of grains smaller than mm. On the other hand, typical clays may consist mainly of particles larger than mm, but containing small quantities of extremely fine colloidal-sized particles. Thus in the Unified Soil Classification System, no size distinction is made between silt and clay, but rather, they are differentiated by their behaviour, and are further subdivided according to the amount of water required to make them act plastically or to flow as a semi liquid. (iv) Organic Material (Symbol O) Organic material is often a component of soil, but in the Unified Soil Classification System it has no specific grain size. It is distinguished by the composition of its particles rather than by their sizes which range from colloidal-sized particles of molecular dimensions to fibrous pieces of partly decomposed vegetable matter several inches in length. Subdivision of organic soils is the same as for silt or clay. Organic soils composed of more than 50% organic material by weight are known as Peat (Symbol Pt). A useful classification system for peat (given at the end of this section) is due to Von Post (1922). (B) Gradation The amounts of the various sizes of grains present in a soil can be determined in the laboratory by means of sieving for the coarse grains and sedimentation (wet mechanical analysis) for the fines. The laboratory results are presented in the form of a cumulative grain-size curve as shown in Figure 3. For soils consisting mainly of coarse grains, the grain-size distribution reveals something of the physical properties of the material. On the other hand, grain size is much less significant for soils containing a preponderance of fine grains. In the Unified Soil Classification System two gradings for coarse soils free of fines (less than 12% by weight) are used. They are: (a) Well Graded (Symbol _W) -- Good representation of all particle sizes from largest to smallest (b) Poorly Graded (Symbol _P) which includes: Uniform Gradation -- Most particles about the same size, or Skip Gradation -- Absence of one or more intermediate sizes. Note that a dual classification is given if the fines are between 5% and 12%. In the field, soil is estimated to be well graded or poorly graded by visual examination. For laboratory purposes, the type of gradation can be determined by the use of criteria based on the range of sizes by weight and on the shape of the grain-size curve. The measure of Figure 3. Definition requirements for soil to be classified as well graded. size range is called the coefficient of uniformity, C u, which is the ratio of the 60 percent finer than size (D 60 ) to the 10 percent finer than size (D 10 ). The shape of the grain-size curve is given by the coefficient of curvature, C c, which is the ratio of the square of the 30 percent finer than size (D 30 ) to the product (D 60 ) (D 10 ). The definitions used distinguish between well and poorly graded Gravel or Sand and are shown in Figure 3. (C) Shape The shape of the particles is not a direct part of the Unified Classification System but nevertheless has an important influence on the physical properties of a soil (e.g. cubical shaped particles generally interlock better than plate-like particles, and as previously presented roundness effects void ratio). The following shapes are most common and are a useful addition. (i) Bulky or Equidimensional Grains -- These may be further described as rounded, sub-rounded, subangular, and angular as illustrated in Figure 4. The coarse-grained components of a soil are usually of the bulky type, consisting chiefly of the minerals quartz and feldspar. The interlocking ability of angular cubic particles is many times greater than rounded or subrounded particles such that mainline railway ballast is required to be from a quarried source (i.e. crushed rock). (ii) Flat or Flaky grains, also called plate-like particles -- These are present in appreciable quantities in many fine-grained soils and have width/thickness ratios > 3. Mica and some clay minerals have this shape, which is mainly responsible for their high compressibility. (iii) Elongated Grains -- These are long needle shaped particles and have length to width ratios > 3. Length, Width and thickness are measured between two parallel plates. Length and thickness are maximum and minimum possible distance between two surface points measured by the two plates. Unified Soil Classification System -- GEOTECHNICAL ENGINEERING Prof. G.P. Raymond. 10
84 Figure 4. Typical description of bulky or equidimensional grains. Figure 5. Liquid limit device. (D) Soil Moisture The effect of soil moisture on the fines forms a major part of the Unified Soil Classification System. A typical soil mass has three constituents - soil grains, air and water. In soils consisting largely of fine grains, the amount of water present in the voids has a pronounced effect on the soil properties. Three main states of soils consistency are recognizable -- Liquid state in which the soil is either in suspension or has the nature of a viscous fluid. Plastic state in which the soil can be rapidly deformed or moulded without elastic rebound, change of volume, cracking, or crumbling. Solid state in which the soil will crack when deformed or will exhibit elastic rebound. (i) Consistency Limits In describing these soil states it is customary to consider only the fraction of soil smaller than the No. 40 sieve (0.425 mm) size. For this fraction the water content in percentage of dry weight at which the soil passes from the liquid state into the plastic state is called the `liquid limit' (LL or w L ) and is recorded as a whole number. A device illustrated in Figure 5 which causes the soil to flow under certain conditions (25 drops of the cup through 10 mm) is used in the laboratory to determine the liquid limit. In practice the 25 blow moisture content is often determined from a single test result using the equation (a) Low (_L) liquid limit, and (b) High (_H) liquid limits (c) Intermediate? (an intermediate range is sometimes used, LL = 30-50). These divisions are shown in Figure 6. By definition a clay soil has limits which plot above the "A" line shown on Figure 6 and silts plot below the "A" line with the exceptions shown in the range liquid limit and plastic limit less than 7. LL ' w L ' m/c Blows (1) Similarly, the water content of the soil at the boundary between the plastic state and the solid state is called the `plastic limit' (PL or w P ) and is recorded as a whole number. The laboratory test consists of repeatedly rolling threads of the soil to 3 mm (1/8 inch) in diameter until they crumble, and then determining the water content. The difference between the liquid limit and the plastic limit corresponds to the range of water contents within which the soil is plastic. This difference of water content is called the `plasticity index' (PI or I p ). Highly plastic soils have high PI values. In a non-plastic soil the plastic limit and the liquid limit are the same (and the PI equals 0) or the liquid limit test is impossible to perform. These limits of consistency, which are called `Atterberg limits' after a Swedish scientist, are used in the Unified Soil Classification System as the basis for laboratory differentiation between materials of appreciable plasticity (clays) and slightly plastic or non-plastic materials (silts). They are also used to subdivide the silts, clays and organic materials into those with Figure 6. The plasticity chart. With sufficient experience a soils engineer may acquire the ability to estimate the Atterberg limits of a soil. Such an estimation may be facilitated by three simple hand tests which have been found adequate for field identification and classification of fine soils. These three tests determine whether the fine-grained fraction of a soil is silty or clayey, without requiring estimation of Atterberg limits. These hand tests, which are part of the field procedure in the Unified Soil Classification System, are - Dilatancy (reaction to shaking) Dry strength (crushing characteristics) Toughness (consistency near plastic limit) These tests are described in the next section. There use is given below: Unified Soil Classification System -- GEOTECHNICAL ENGINEERING Prof. G.P. Raymond. 11
85 Soil Dry Strength Dilatancy Toughness Strength Visual Response of Dry Specimen ML MH CL CH None to Low Low to Medium Medium to High High to Very High Slow to Rapid None to Slow None to Slow None Low. Cannot form thread Low to Medium Medium High None Low Medium High Very High Crubles with handling. Crubles with light finger pressure. Breaks with considerable finger pressure. Requires thumb pressure to break. Cannot be broken with thumb pressure. 3. FIELD IDENTIFICATION TESTS The procedures for field identification of the fine grained fraction are performed on the minus No. 40 sieve (0.425 mm) size particles, approximately 1/64 in. For field classification purposes, sieving or screening is not intended, simply remove by hand the coarse particles that interfere with the tests. (A) Dilatancy Dilatancy or reaction to shaking: -- After removing particles larger than No. 40 sieve (0.425 mm) size, prepare a pat of moist soil with a volume of about two cubic cm (one-half inch). Add enough water, if necessary to make the soil soft but not sticky. Place the pat in the open palm of one hand and shake horizontally, striking vigorously against the other hand several times. A positive reaction consists of the appearance of water on the surface of the pat which changes to a livery consistency and becomes glossy. When the sample is squeezed between the fingers, the water and gloss disappear from the surface, the pat stiffens, and finally it cracks or crumbles. The rapidity of appearance of water during shaking and of its disappearance during squeezing assist in identifying the character of the fines in a soil. Very fine clean sands give the quickest and most distinct reaction whereas a plastic clay has no reaction. Inorganic silts, such as a typical rock flour, show a moderately quick reaction. Typical criteria for classification is: (C) Toughness Toughness or consistency near plastic limit: -- After removing particles larger than the No. 40 sieve (0.425 mm) size, a specimen of soil about two cubic cm (one-half inch) volume in size is moulded to the consistency of putty. If too dry, water must be added and if sticky, the specimen should be spread out in a thin layer and allowed to lose some moisture by evaporation. Then the specimen is rolled out by hand on a smooth surface or between the palms into a thread about 3 mm (oneeighth inch) in diameter. The thread is then folded and then rerolled repeatedly. During this manipulation the moisture content is gradually reduced and the specimen stiffens, finally loses its plasticity, and crumbles when the plastic limit is reached. After the thread crumbles, the pieces should be lumped together and a slight kneading action continued until the lump crumbles. The tougher the thread near the plastic limit and the stiffer the lump when it finally crumbles, the more potent is the colloidal clay fraction in the soil. Weakness of the thread at the plastic limit and quick loss of cohesion of the lump below the plastic limit indicate either inorganic clay of low plasticity, or materials such as kaolin-type clays and organic silts which occur below the A-line. Highly organic clays have a very weak and spongy feel at the plastic limit. Typical criteria for classification is: Toughness Response to Rolling 3 mm diameter thread. Reaction Low Medium High Visual Response No visible change. Water appears slowly on shaking and disappears slowly on squeezing. Water appears quickly on shaking and disappears quickly on squeezing. (B) Dry Strength Dry strength or crushing characteristics: -- After removing particles larger than a No. 40 sieve (0.425 mm) size, mould a pat of soil to the consistency of putty, adding water if necessary. Allow the pat to dry completely by oven, sun, or air drying, and then test its strength by breaking and crumbling between the fingers. This strength is a measure of the character and quantity of the colloidal fraction contained in the soil. The dry strength increases with increasing plasticity. High dry strength is characteristics for clays of high plasticity index which by deduction must also have a high liquid limit and thus must be in the CH group or high range of the CL group. A low dry strength indicates low plasticity index and thus a silt. Silty fine sands and silts have about the same slight dry strength, but can be distinguished by the feel after powdering the dried specimen. Fine sand feels gritty whereas a typical silt has the smooth feel of flour. Typical criteria for classification is: Low Medium High Slight pressure required to roll at PL. Medium pressure required to roll at PL. High pressure required to roll at PL. 4. CLAIFICATION OF SOILS (see Table 1). (A) General Soils in nature seldom exist separately as a gravel, sand, silt, clay, or organic matter, but are usually found as mixtures with varying proportions of these components. The Unified Soil Classification System is based on recognition of the type and predominance of the constituents, considering grain size, gradation, plasticity and compressibility. As already described it divides soils into three major divisions - coarse-grained soils, fine-grained soils, and highly organic (peaty) soils. In the field, identification is accomplished by visual examination for the coarse grains and by a few simple hand tests for the fine-grained soils or fraction. In the laboratory, the grain-size curve and the Atterberg limits can be used. The peaty soils (Pt) are readily identified by colour, odour, spongy feel, and fibrous texture and are not further sub-divided in the classification. (B) Field Classification A representative sample of soil (excluding particles larger than 76 mm or 3 inches) is first classified as coarse grained or fine grained by estimating whether 50 percent, by weight, of the particles can be seen individually by the naked eye. Soils containing more than 50 percent of particles that can be seen are coarse-grained soils, soils containing more than 50 percent of particles smaller than the eye can see are fine-grained soils. If the soil is predominantly coarse grained, it is then identified as being a gravel or a sand by estimating whether 50 percent or more of the Unified Soil Classification System -- GEOTECHNICAL ENGINEERING Prof. G.P. Raymond. 12
86 fraction of coarse grains are larger or smaller than the No. 4 sieve (4.75 mm) size (about 1/4 inch). If the soil is a gravel, it is next identified as being `clean' and containing little or no fines (by definition less than 5 percent by weight), or `dirty' and containing an appreciable amount of fines (by definition more than 12 percent by weight). For clean gravels, final classification is made by estimating the gradation, the well-graded gravels belong to the GW group, and uniform or well sorted (not to be confused with well graded) and skip-graded gravels belong to the GP group. Dirty gravels are of two types - those with non-plastic (silty) fines, GM, and those with plastic (clayey) fines, GC. The determination of whether the fines are silty or clayey is made by the three manual (i.e. by hand) tests for finegrained soils. If a soil is a sand, the same steps and criteria are used as for the gravels in order to determine whether the soil is a well-graded clean sand (SW), poorly graded clean sand (SP), sand with silty fines (SM), or sand with clayey fines (SC). If a material is predominantly (more than 50 percent by weight) fine grained, it is classified into one or six groups (ML, CL, OL, MH, CH, OH) by estimating its dilatancy (reaction to shaking), dry strength (crushing characteristics), and toughness (consistency near plastic limit), and by identifying it as being organic or inorganic. Soils that are typical of the various groups are readily classified by the foregoing procedures. However, many natural soils will have property characteristics of two groups because they are close to the borderline between the groups, either in percentages of the various sizes or in plasticity characteristics. For this substantial number of soils, boundary classifications are used, that is, the two group symbols most nearly describing the soil are connected by a hyphen, such as GW-GC. If the percentages of gravel and sand sizes in a coarse-grained soil are nearly equal, the classification procedure is to assume that the soil is a gravel, and then continue in the chart until the final soil group, say GC, is reached. Since we could have assumed that the soil is a sand, the correct field classification is GC-SC, because the criteria for the gravel and sand subgroups are identical. Similarly, within the gravel or sand groupings, boundary classifications such as GW-GP, GM-GC, GW-GM, SW-SP, SM-SC, and SW-SM can occur. Proper boundary classification of a soil near the borderline between coarse-grained and fine-grained soils is accomplished by classifying it first as a coarse-grained soil and then as a fine-grained soil. Such classifications as SM-ML and SC-CL are common. Within the fine-grained division, boundary classifications can occur between low liquid limit soils and high liquid limit soils as well as between silty and clayey materials in the same range of liquid limits. For example, we may have ML-MH, CL-CH, OL-OH and ML-CL, ML-OL, CL-OL, MH-CH, MH-OH, CH-OH soils. A guide for a textural classification of soils is shown in Figure 7. The textural properties can be supplemented by manually performed tests already presented for field classification purposes. (C) Laboratory Classification Although most classifications of soils will be done visually and by the manually performed tests, the Unified Soil Classification System provides a precise delineation of the soil groups by mechanical analyses and Atterberg limits tests in the laboratory. Laboratory classifications are often performed on representative samples of soils which are being subjected to extensive testing for strength, compressibility, and permeability. They also can be used to advantage in training the field classifier of soils to improve his ability to estimate percentages and degrees of plasticity. The grain-size curve is used to classify the soil as being coarse grained or fine grained, and if coarse grained, into gravel or sand by size, using the 50 percent criterion. Within the gravel or sand groupings, soils containing less than 5 percent finer than the No. 200 sieve (0.074 mm) size are considered `clean' and are then classified as well graded or poorly graded by their coefficients of uniformity and curvature. In order for a clean gravel to be well graded (GW), it must have both a coefficient of uniformity (C u ) greater than 4 and a coefficient of curvature (C c ) between 1 and 3 (see Figure 3) - otherwise, it must be classified as a poorly graded gravel (GP). A clean sand, having both a C u greater than 6 and a C c between 1 and 3, is in the SW group - otherwise, it is a poorly graded sand (SP). Figure 7. Guide for field soil textural classification using unified system. `Dirty' gravels or sands are those containing more than 12 percent of fines, and they are classified as silty (GM or SM) or clayey (GC or SC) by results of their Atterberg limits tests as plotted on the plasticity chart shown. Silty fines are those which have a plasticity index (PI) less than 4 or which plot below the `A' line. Clayey fines are those which have a PI greater than 7 and which plot above the `A' line. Coarse-grained soils containing between 5 and 12 percent of fines are borderline cases between the clean and dirty gravels or sands (GW, GP, SW, SP, and GM, GC, SM, SC). Similarly, borderline cases may occur in dirty gravels and dirty sands where the PI is between 4 and 7 (GM- GC, SM-SC). It is theoretically possible, therefore, to have a borderline case of a borderline case - but this is not permitted, and the rule for correct classifications is to favour the non-plastic one. For example, a gravel with 10 percent fines, a C u of 20, a C c of 2.0, and a PI of 6 would be classified GW-GM rather than GW-GC. Once a soil is determined to be fine grained by the grain-size curve, its classification into one of the six groups is done by the results of Atterberg limits tests as plotted on the plasticity chart, with attention being given to the organic content. Inorganic fine-grained soils with PI greater than 7 and above the `A' line are CL or CH, depending on whether their liquid limits are below 50 percent or above 50 percent respectively. Similarly, inorganic fine-grained soils with PI less than 4 or below the `A' line are ML or MH, depending on whether their liquid limits are below or above 50 percent, respectively. Fine-grained soils which fall above the `A' line but which have a plasticity index between 4 and 7 are classified ML-CL. Soils which plot below the `A' line that are definitely organic are classified as OL if they have liquid limits less than 50 and as OH if the liquid limit is above 50. Organic silts and clays are usually distinguished from inorganic silts and clays which have the same position on the plasticity chart, by odour and colour. However, when the organic content is doubtful the material can be oven dried, remixed with water, and retested for liquid limit. The plasticity of fine-grained organic soils is greatly reduced on oven drying, due to irreversible changes in the organic colloids. Oven drying also affects the liquid limit of inorganic soils, but to a much smaller degree. A reduction in liquid limit after oven drying to a value less than three-fourths of the liquid limit before oven drying is positive identification of organic soils. 5. ENGINEERING CHARACTERISTICS OF SOIL COMPONENTS Some of the main engineering properties of the various soil types are given in summary form in Table 2 and typical safe bearing pressures and Unified Soil Classification System -- GEOTECHNICAL ENGINEERING Prof. G.P. Raymond. 13
87 California Bearing Ratios (CBR) as used in main class highways and airport design are shown in Figure 8. These may be considered somewhat conservative for use with railroads whose support need not be as rigid. A fifty percent increase in scale values is suggested for use with railway track support subgrades Figure 8. Safe Bearing Stresses developed for highway and airport design (PCA, 1956). sand and gravel may make the soil virtually impervious, especially when the coarse grains are well graded. Also, serious frost heaving in wellgraded sands and gravels may be caused by less than 12 percent of fines. Typically 6% fines at the surface results in some frost heave. The allowable amount increases with depth. Soils containing large quantities of silt and clay are the most troublesome to the engineer. These materials exhibit marked changes in physical properties with change of water content. A hard, dry clay, for example, may be suitable as a foundation for heavy loads so long as it remains dry, but may turn into a quagmire when wet. Many of the fine soils shrink on drying and expand on wetting, which may adversely effect structures founded on them or constructed on them. Even when moisture content does not change, the properties of fine soils may vary considerably between their natural condition in the ground and their state after being disturbed. Deposits of fine particles which have been subjected to loading in geologic time frequently have a structure which gives the material unique properties in the undisturbed state. When the soil is excavated for use as a construction material or when the natural deposit is disturbed by driving piles, for example, the soil structure is destroyed and the properties of the soil are changed radically. Silts are different from clays in many important respects, but because of their similarity in appearance, they often have been mistaken one for the other sometimes with unfortunate results. Dry, powdered silt and clay are indistinguishable, but they are easily identified by their behaviour in the presence of water. The importance of the recognition of the difference in behaviour of fines as being silt or clay is an essential part of the Unified Soil Classification System. (i) Silts Silts are the non-plastic fines. They are inherently unstable in the presence of water and have a tendency to become `quick' when saturated. Silts are fairly impervious, difficult to compact, and are highly susceptible to frost heaving. Silt masses undergo change of volume with change of shape (the property of dilatancy) in contrast to clays which retain their volume with change of shape (the property of plasticity). Thus silts, at the same liquid limit, have relatively low plasticity compared with clays. In terms of the classification chart (Figure 6) they plot below the `A' line. The dilatancy property of silts, together with the `quick' reaction to vibration, affords a means of identifying typical silt in the loose wet state. When dry, silt can be pulverized easily under finger pressure (has very slight dry strength), and will have a smooth feel between the fingers in contrast to the grittiness of fine sand..(a) Gravel and Sand Both of the coarse-grained components of soil (gravel and sand) have essentially the same engineering properties, differing mainly in degree. The division of gravel and sand sizes by the No. 4 sieve (4.75 mm) is arbitrary and does not correspond to a sharp change in properties. Wellgraded, compacted gravels, or sands are stable materials. The coarsegrained soils when devoid of fines are pervious, easy to compact, little affected by moisture, and not subject to frost action. Although grain shape and gradation as well as size affect these properties, for the same amount of fines gravels are generally more pervious, more stable, and less affected by water or frost than are sands. Similarly angular particles result in stronger strengths than rounded particles. As a sand becomes finer and more uniform, it approaches the characteristics of silt with corresponding decrease in permeability and reduction in stability in the presence of water. Very fine, uniform sands are difficult to distinguish visually from silt. However, dried sand exhibits no cohesion (does not hold together) and feels gritty in contrast to the very slight cohesion and smooth feel of dried silt. (B) Silt and Clay Even small amounts of fines may have important effects on engineering properties of the soils in which they are found. As little as 12 percent of particles smaller than the No. 200 sieve (0.074 mm) size in Silts differ among themselves in size and shape of grains which are reflected mainly in the property of compressibility. For similar conditions of previous loading, the higher liquid limit of a silt the more compressible it is. This is also true for clays and a general pattern of results for remould fine grained soils is shown in Figure 9 demonstrating this point. The liquid limit of a typical bulky-grained inorganic silt is about 30, while highly micaceous or diatomaceous silts (so-called `elastic' silts) consisting mainly of flaky grains, may have liquid limits as high as 100. The differences in quickness and dilatancy properties afford a means of distinguishing in the field between silts of low liquid limit Figure 9. Compressibility-Liquid Limit relationship for remoulded soils (Skempton, 1944). Unified Soil Classification System -- GEOTECHNICAL ENGINEERING Prof. G.P. Raymond. 14
88 and those of high liquid limit. (ii) Clays Clays are the plastic fines. Thus they plot above the `A' line on the plasticity chart (Figure 6). They have low resistance to deformation when wet, but they dry to hard cohesive masses. Clays are virtually impervious, difficult to compact when wet, and impossible to drain by ordinary means. Large expansion and contraction with changes in water content are characteristics of clays. The small size, flat shape, and mineral composition of clay particles combine to produce a material that is both compressible and plastic. The higher the liquid limit of a clay, the more compressible it will be when compared at equal conditions of previous loading (Figure 9), hence, in the Unified Soil Classification System, the liquid limit is used to distinguish between clays of high compressibility (symbol H) and those of low compressibility (symbol L). {Note:- The low range is sometimes subdivided into low (L) and intermediate (I).} Differences in plasticity of clays are reflected by their plasticity indexes. Since the plastic limit of a soil is rarely less than 15 the range of the plasticity index (PI = LL - PL) for a clay at any given liquid limit is small since they must plot above the `A' line on Figure 6. Thus clays are often referred to as low or high plasticity clays rather than low or high compressible clays. In general the higher the liquid limit and thus the plasticity index the more cohesive is the clay at the same overburden consolidation pressure, as seen in Figure 10 for Norwegian soft (normally consolidated) clays. Field differentiation among clays is accomplished by the toughness test in which the moist soil is moulded and rolled into threads until crumbling occurs and by the dry strength test which measures the resistance of the clay to breaking and pulverizing. With a little experience in performing these tests, the clays of low compressibility and also low plasticity, `lean' clays (symbol _L), can be readily distinguished from the highly compressible and also highly plastic `fat' clays (symbol _H). {Since the plastic index is less than the liquid limit low or high compressibility for clays also means low or high plasticity. This however is not true for silts. The subdivision L or H refers to compressibility (Liquid Limit see Figure 9) and not plasticity. This point is often misquoted.} (iii) Organic Matter Organic matter in the form of partly decomposed vegetation is the primary constituent of peaty soils. Varying amounts of finely divided vegetable matter are found in plastic and non-plastic sediments, and often affect their properties sufficiently to influence their classification. Thus we have organic silts and silt-clays of low plasticity and organic clays of medium to high plasticity. Even small amounts of organic material in colloidal form in a clay will result in an appreciable increase in liquid limit of the material without increasing its plasticity index. Organic soils are dark grey or black in colour, and usually have a characteristic odour of decay. Organic clays feel spongy in the plastic range as compared to inorganic clays. The tendency for soils high in organic content to create voids by decay or to change the physical characteristics of a soil mass through chemical alteration makes them undesirable for engineering use. Soils containing even moderate amounts of organic matter are significantly more compressible and less stable than inorganic soils, hence they are less desirable for engineering use. 6. ACTIVITY Although not part of the classification of soils Skempton (1953) has defined the `Activity' of a soil as the ratio of the Plasticity Index to the percentage by weight of the soil smaller than the 2 micrometre. The results that accommodated Skempton's definition are illustrated in Figure 11 and were done on clays that were basicly 100% passing the 75 µm sieve. The value of obtaining the activity of the fines fraction is that high activity is generally but not always associated with swelling soils. Figure 11. Typical activity relationship for three natural soils (Skempton, 1953). 7. VON POST CLAIFICATION OF PEAT Von Post's main classification of peat is for degree of decomposition or "Humidification" symbol H. Secondary subdivisions are for "Relative Moisture", symbol B; "Number of Fibres", symbol F; "Number of Root Threads", symbol R; and "Quantity of Wood" symbol V. These classifications are given below (see after references): Figure 10. Relationship suggested by Bjerrum (1954) between undrained strength and plasticity Index. 8. REFERENCES ASTM D-2487, "Classification of soils for engineering purposes", American Society for Testing Materials. (TA401.A5S). ASTM D-2488, "Description and identification of soils (visualmanual procedure)", American Society for Testing Materials. (TA401.A5S). Bjerrum, L. (1954), "Geotechnical properties of Norwegian marine clays". Geotechnique, Vol. 4, pp (TA1.G3). Burmister, D.M., 1951, "Identification and Classification of Soils". Symposium on Identification and Classification of Soils, Special Technical Publication No. 113, American Society for Testing Materials, Unified Soil Classification System -- GEOTECHNICAL ENGINEERING Prof. G.P. Raymond. 15
89 pp (TA710.A5) Casagrande, A., 1948, "Classification and Identification of Soils". Transactions of the American Society of Civil Engineers, Volume 113, pp (TA1.A5t) Helenelund, K.V. (1968), "Compression, Tension and Beam Tests on Fibrous Peat". Proceedings of the Third International Peat Congress, Quebec, Canada, pp (TN837.I58) "Peat Testing Manual", (1979). Technical Memorandum 125, National Research Council of Canada, Ed. Com. Day, J.H., Rennie, P.J., Stanek, W, and Raymond G.P. (Chairman). (TA710.A1N27). Portland Cement Association (1956), "PCA soil primer". Portland Cement Association, Chicago, IL. 86p. Rose, A.C. (1924), "Practical field tests for subgrade soils". Public Roads, Vol. 5, pp (TE23.A4). Skempton, A.W., 1944, "Notes on the compressibility of clays". Quart. J. Geol. Soc., London, C, pp (QE1.G345). Skempton, A.W., 1953, "The colloidal activity of clays". Proc. 3rd International Conference on Soil Mechanics and Foundation Engineering, Vol. 1, pp (TA710.I6t) Von Post, L. (1922) "Sveriges geologiska undersöknings torvinventering och några av dess hittills vunna resultat" Sv. Mosskulturför", Tidskr, 1:1-27. B. Relative Moisture: F. Number of Fibres: R. Number of Root Threads: V. Quantity of Wood: Secondary Classification for Peat B 1 Air dry B 2 Somewhat dry B 3 Normal moisture B 4 Wet B 5 Very wet F 1 No fibres F 2 Few fibres F 3 Plenty of fibres F 4 Mainly fibres R 1 No root threads R 2 Few root threads R 3 Plenty of root threads R 4 Root threads forming main part of peat V 1 No wood remainder V 2 Few wood remainders V 3 Plenty wood remainders V 4 Very many wood remainders H 1 Classification of Degree of Decomposition of Peat Completely unhumified and muck-free peat; upon pressing in the hand, gives off only colorless, clear water. H 2 Almost completely unhumified and muck-free peat; upon pressing, gives off almost clear but yellow-brown water. H 3 Little humified and little muck-containing peat; upon pressing, gives off distinctly turbid water, no peat substances pass between the fingers and the residue is not mushy. H 4 Poorly humified or some muck-containing peat; upon pressing, gives off strongly turbid water. The residue is somewhat mushy. H 5 Peat partially humified or with considerable muck-content. The plant remains are recognizable but not distinct. Upon pressing, some of the substance passes between the fingers together with mucky water. The residue in the hand is stronglv m1lshv H 6 Peat partially humified or with considerable muck-content. The plant remains are not distinct. Upon pressing, at the most, one third of the peat passes between the fingers. The residue is strongly mushy but the plant residue stands out more distinctly than in the unpressed peat. H 7 Peat quite well humified or with considerable muck-content, in which much of the plant remains can still be seen. Upon pressinr, about half of the peat passes between the fingers. If water separates it is soupy and very dark in color. H 8 Peat weil humified or with considerable muck-content. The plant remains are not recognizable. Upon pressing, about two-thirds of the peat passes between the fingers. If it gives off water at alln it is soupy. The remains consist mainly of more resistant root fibres, etc. H 9 Peat, very well humified or muck-like in which hardly any plant remains are apparent. Upon pressing, nearly all of the peat passes between the fingers like a homogeneous mush. H 10 Peat completely humified or muck-like in which no plant remains are apparent. Upon pressing all of the peat passes between the fingers. Unified Soil Classification System -- GEOTECHNICAL ENGINEERING Prof. G.P. Raymond. 16
90 Unified Soil Classification System -- GEOTECHNICAL ENGINEERING Prof. G.P. Raymond. 17
91 Unified Soil Classification System -- GEOTECHNICAL ENGINEERING Prof. G.P. Raymond. 18
92 Geotechnical Investigation : Examples of MSE Walls from Sierra April 6, 2010 APPENDIX G Examples of MSE Walls from Sierra
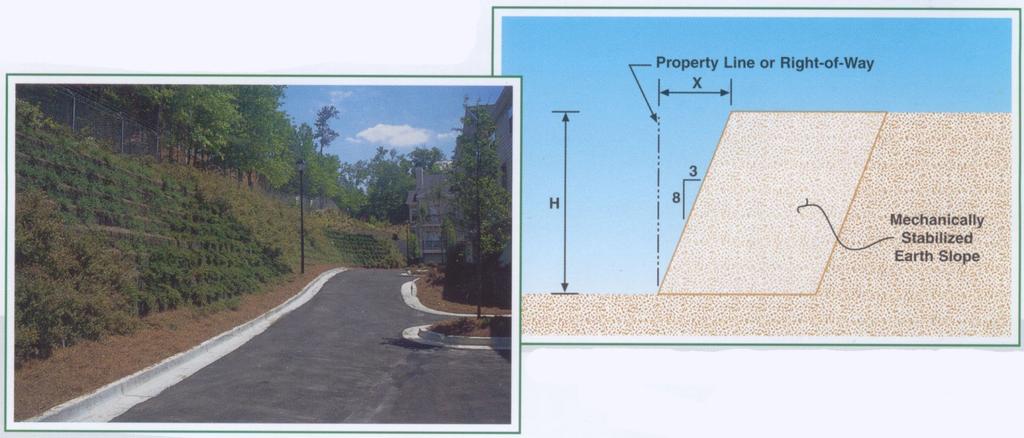
93
B-1 BORE LOCATION PLAN. EXHIBIT Drawn By: 115G BROOKS VETERINARY CLINIC CITY BASE LANDING AND GOLIAD ROAD SAN ANTONIO, TEXAS.
 N B-1 SYMBOLS: Exploratory Boring Location Project Mngr: BORE LOCATION PLAN Project No. GK EXHIBIT Drawn By: 115G1063.02 GK Scale: Checked By: 1045 Central Parkway North, Suite 103 San Antonio, Texas 78232
CENTRAL REGION GEOHAZARDS RISK ASSESSMENT SITE INSPECTION FORM
 SITE NUMBER AND NAME C55 H861:02 Slide LEGAL DESCRIPTION NW 14-40-14-W4 CENTRAL REGION GEOHAZARDS RISK ASSESSMENT SITE INSPECTION FORM HIGHWAY & KM NAD 83 COORDINATES N 5811217 E 437291 PREVIOUS INSPECTION
This report was prepared by Klohn Crippen Consultants Ltd. for Alberta Transportation Central Region under Contract No. CE053/2000.
 Alberta Transportation Central Region #401, 4902 51 Street Red Deer, Alberta T4N 6K8 June 7, 2002 Mr. Melvin Mayfield, P.Eng. Project Engineer Dear Mr. Mayfield: Central Region Landslide Assessment Site
 Project: ITHACA-TOMPKINS REGIONAL AIRPORT EXPANSION Project Location: ITHACA, NY Project Number: 218-34 Key to Soil Symbols and Terms TERMS DESCRIBING CONSISTENCY OR CONDITION COARSE-GRAINED SOILS (major
1 PROJECT BACKGROUND. August 14, Alberta Transportation Central Region #401, Street Red Deer, Alberta T4N 6K8
 August 14, 2013 Alberta Transportation Central Region #401, 4902 51 Street Red Deer, Alberta T4N 6K8 Mr. Dennis Grace, P.Eng. Construction Engineer Dear Mr. Grace: Central Region Geohazard Assessment 2013
 Photo 1 - Southerly view across 2700 parking lot toward existing building. Multi-residential building borders western side of property in upper right of view. Photo 2 - Southerly view across 2750 parking
patersongroup Consulting Engineers April 20, 2010 File: PG1887-LET.01R Novatech Engineering Consultants Suite 200, 240 Michael Cowpland Drive
 patersongroup April 20, 2010 File: PG1887-LET.01R Novatech Engineering Consultants Suite 200, 240 Michael Cowpland Drive Ottawa, Ontario K2M 1P6 Attention: Mr. Adam Thompson Consulting Engineers 28 Concourse
patersongroup Mineral Aggregate Assessment 3119 Carp Road Ottawa, Ontario Prepared For Mr. Greg LeBlanc March 7, 2014 Report: PH2223-REP.
 Geotechnical Engineering Environmental Engineering group Hydrogeology Geological Engineering Archaeological Studies Materials Testing 3119 Carp Road Prepared For Mr. Greg LeBlanc March 7, 2014 Paterson
DATA REPORT GEOTECHNICAL INVESTIGATION GALVESTON CRUISE TERMINAL 2 GALVESTON, TEXAS
 DATA REPORT GEOTECHNICAL INVESTIGATION GALVESTON CRUISE TERMINAL 2 GALVESTON, TEXAS SUBMITTED TO PORT OF GALVESTON 123 ROSENBERG AVENUE, 8TH FLOOR GALVESTON, TEXAS 77553 BY HVJ ASSOCIATES, INC. HOUSTON,
Appendix A. Producer Statement Advisory Note
 Appendix A Producer Statement Advisory Note Ref. No. 17095 26 May 2017 PRODUCER STATEMENT CONSTRUCTION REVIEW (PS4) IMPORTANT ADVISORY NOTE The Building Consent Authority (BCA) frequently requires Producer
General. DATE December 10, 2013 PROJECT No TO Mary Jarvis Urbandale/Riverside South Development Corporation
 DATE December 10, 201 PROJECT No. 10-1121-0260- TO Mary Jarvis Urbandale/Riverside South Development Corporation CC Justin Robitaille, Urbandale Jonathan Párraga, J.L. Richards & Associates Limited FROM
APPENDIX A GEOTECHNICAL REPORT
 The City of Winnipeg Bid Opportunity No. 529-2017 Template Version: C420170317 - RW APPENDIX A GEOTECHNICAL REPORT Quality Engineering Valued Relationships KGS Group 2017 Industrial Street Rehabilitation
Civil Engineering, Surveying and Environmental Consulting WASP0059.ltr.JLS.Mich Ave Bridge Geotech.docx
 2365 Haggerty Road South * Canton, Michigan 48188 P: 734-397-3100 * F: 734-397-3131 * www.manniksmithgroup.com August 29, 2012 Mr. Richard Kent Washtenaw County Parks and Recreation Commission 2330 Platt
ATTACHMENT A PRELIMINARY GEOTECHNICAL SUMMARY
 ATTACHMENT A PRELIMINARY GEOTECHNICAL SUMMARY Kevin M. Martin, P.E. KMM Geotechnical Consultants, LLC 7 Marshall Road Hampstead, NH 0384 603-489-6 (p)/ 603-489-8 (f)/78-78-4084(m) kevinmartinpe@aol.com
SLOPE STABILITY ASSESSMENT PROPOSED RESIDENTIAL SUBDIVISION 161 LAKESHORE ROAD EAST TOWN OF THE BLUE MOUNTAINS, ONTARIO
 SLOPE STABILITY ASSESSMENT PROPOSED RESIDENTIAL SUBDIVISION 161 LAKESHORE ROAD EAST TOWN OF THE BLUE MOUNTAINS, ONTARIO PETO MacCALLUM LTD. 19 CHURCHILL DRIVE BARRIE, ONTARIO L4N 8Z5 PHONE: (705) 734-3900
Depth (ft) USCS Soil Description TOPSOIL & FOREST DUFF
 USCS Soil Description TOPSOIL & FOREST DUFF") Test Pit No. TP-6 Location: Latitude 47.543003, Longitude -121.980441 Approximate Ground Surface Elevation: 1,132 feet Depth (ft) USCS Soil Description 0 1.5 1.5 5.0 SM 5.0 8.0 SM Loose to medium dense,
Test Pit No. TP-6 Location: Latitude 47.543003, Longitude -121.980441 Approximate Ground Surface Elevation: 1,132 feet Depth (ft) USCS Soil Description 0 1.5 1.5 5.0 SM 5.0 8.0 SM Loose to medium dense,
APPENDIX A. Borehole Logs Explanation of Terms and Symbols
 APPENDIX A Borehole Logs Explanation of Terms and Symbols Page 153 of 168 EXPLANATION OF TERMS AND SYMBOLS The terms and symbols used on the borehole logs to summarize the results of field investigation
Field Exploration. March 31, J-U-B ENGINEERS, Inc. 115 Northstar Avenue Twin Falls, Idaho Attn: Mr. Tracy Ahrens, P. E. E:
 March 31, 201 11 Northstar Avenue 83301 Attn: Mr. Tracy Ahrens, P. E. E: taa@jub.com Re: Geotechnical Data Report Preliminary Phase 1 Field Exploration Revision No. 1 Proposed Rapid Infiltration Basin
LANDSLIDES IN THE WHITE MOUNTAIN (GEOTECHNICAL STUDIES AND ENGINEERING TESTS)
") J. Al Azhar University Gaza 2004, Vol. 7, NO. 2 P 15-26 LANDSLIDES IN THE WHITE MOUNTAIN (GEOTECHNICAL STUDIES AND ENGINEERING TESTS) Isam G. Jardaneh (1), Jalal Al-Dabeek (2), Abdel hakeem Al-Jawhari
J. Al Azhar University Gaza 2004, Vol. 7, NO. 2 P 15-26 LANDSLIDES IN THE WHITE MOUNTAIN (GEOTECHNICAL STUDIES AND ENGINEERING TESTS) Isam G. Jardaneh (1), Jalal Al-Dabeek (2), Abdel hakeem Al-Jawhari
February 18, 2003 File: NORTH CENTRAL REGION LANDSLIDE ASSESSMENT HWY 43:16 WHITECOURT EAST HILL (NC1) 2002 ANNUAL INSPECTION REPORT
 2002 ANNUAL INSPECTION REPORT") February 18, 2003 File: 15-76-11 Alberta Transportation Room 223, Provincial Building 4709 44 Avenue Stony Plain, Alberta T7Z 1N4 Attention: Mr. Rob Lonson, P.Eng. NORTH CENTRAL REGION LANDSLIDE ASSESSMENT
February 18, 2003 File: 15-76-11 Alberta Transportation Room 223, Provincial Building 4709 44 Avenue Stony Plain, Alberta T7Z 1N4 Attention: Mr. Rob Lonson, P.Eng. NORTH CENTRAL REGION LANDSLIDE ASSESSMENT
The results of KCB s site inspection observations and our recommendations for further work are presented herein.
 July 14, 2015 Central Region 401, 4902 51 Street Red Deer, Alberta T4N 6K8 Mr. Tony Penney, P.Eng. Construction Engineer Dear Mr. Penney: June 25, 2015 Site Inspection Report The above site was visited
8.1. What is meant by the shear strength of soils? Solution 8.1 Shear strength of a soil is its internal resistance to shearing stresses.
 8.1. What is meant by the shear strength of soils? Solution 8.1 Shear strength of a soil is its internal resistance to shearing stresses. 8.2. Some soils show a peak shear strength. Why and what type(s)
REPORT ON SLOPE STABILITY INVESTIGATION DON MILLS ROAD AND EGLINTON AVENUE EAST TORONTO, ONTARIO. Prepared for:
 REPORT ON SLOPE STABILITY INVESTIGATION DON MILLS ROAD AND EGLINTON AVENUE EAST TORONTO, ONTARIO Prepared for: TORONTO AND REGION CONSERVATION AUTHORITY Prepared By: SIRATI & PARTNERS CONSULTANTS LIMITED
Geotechnical Investigation
 Geotechnical Investigation Slope Stability Analysis for the Existing Slope Southwest of the Proposed Condo Developments 50 Ann Street, Bolton, Ontario Prepared For: Brookfield Homes (Ontario) Limited GeoPro
16 January 2018 Job Number: RICHARD NEWMAN C\- CLARK FORTUNE MCDONALD AND ASSOCIATES PO BOX 553 QUEENSTOWN
 16 January 2018 Job Number: 50595 RICHARD NEWMAN C\- CLARK FORTUNE MCDONALD AND ASSOCIATES PO BOX 553 QUEENSTOWN CHANSEN@CFMA.CO.NZ STORMWATER DISPOSAL ASSESSMENT Dear Richard, RDAgritech were requested
Preliminary Geotechnical Evaluation Gooseberry Point Pedestrian Improvements Whatcom County, Washington SITE AND PROJECT DESCRIPTION
 File No. 12-100 Geotechnical & Earthquake Engineering Consultants Mr. Kevin Brown, P.E. Gray & Osborne, Inc. 3710 168 th Street NE, Suite B210 Arlington, Washington 98223 Subject: Draft Report Preliminary
Pierce County Department of Planning and Land Services Development Engineering Section
 Page 1 of 7 Pierce County Department of Planning and Land Services Development Engineering Section PROJECT NAME: DATE: APPLICATION NO.: PCDE NO.: LANDSLIDE HAZARD AREA (LHA) GEOLOGICAL ASSESSMENT REPORT
GEOTECHNICAL ENGINEERING II. Subject Code : 06CV64 Internal Assessment Marks : 25 PART A UNIT 1
 GEOTECHNICAL ENGINEERING II Subject Code : 06CV64 Internal Assessment Marks : 25 PART A UNIT 1 1. SUBSURFACE EXPLORATION 1.1 Importance, Exploration Program 1.2 Methods of exploration, Boring, Sounding
APPENDIX C HYDROGEOLOGIC INVESTIGATION
 Figure B-5.7 Figure B-5.8 Preliminary Geotechnical and Environmental Report Appendix C Hydrogeologic Investigation APPENDIX C HYDROGEOLOGIC INVESTIGATION December 21, 2011 WESTSIDE SUBWAY EXTENSION PROJECT
Milford Centre Ltd. Private Plan Change GEOTECHNICAL ASSESSMENT
 Milford Centre Ltd. Private Plan Change GEOTECHNICAL ASSESSMENT Final 15 April 2008 Milford Centre Ltd. Private Plan Change GEOTECHNICAL ASSESSMENT Final 15 April 2008 Sinclair Knight Merz 25 Teed Street
CONQUEST ENGINEERING LTD.
 CONQUEST ENGINEERING LTD. Geotechnical and Materials Engineers Concrete Technology, Blasting Consultants Construction Quality Assurance / Quality Control 8 Bluewater Road, Bedford, NS BB J6 Phone (9)85-7
December 5, Junction Gateway, LLC 7551 W. Sunset Boulevard #203 Los Angeles, CA Mr. James Frost P: Dear Mr.
 December 5, 2014 Junction Gateway, LLC 7551 W. Sunset Boulevard #203 90046 Attn: Re: Mr. James Frost P: 323.883.1800 Geotechnical Update Letter Sunset & Effie Mixed Use Development 4301 to 4311 Sunset
FROST HEAVE. GROUND FREEZING and FROST HEAVE
 FROST HEAVE The temperature of soils near the ground surface reflects the recent air temperatures. Thus, when the air temperature falls below 0 C (32 F) for extended periods, the soil temperature drops
GEOTECHNICAL ENGINEERING ECG 503 LECTURE NOTE ANALYSIS AND DESIGN OF RETAINING STRUCTURES
 GEOTECHNICAL ENGINEERING ECG 503 LECTURE NOTE 07 3.0 ANALYSIS AND DESIGN OF RETAINING STRUCTURES LEARNING OUTCOMES Learning outcomes: At the end of this lecture/week the students would be able to: Understand
August 10, 2007 File:
 August 10, 2007 File: 15-85-72 Alberta Infrastructure and Transportation Room 301, Provincial Building 9621-96 Avenue Peace River, AB T8S 1T4 Attention: Mr. Ed Szmata PEACE REGION (PEACE HIGH LEVEL AREA)
January 17, 2008 File:
 January 17, 2008 File: 15-85-73 Alberta Infrastructure and Transportation Room 301, Provincial Building 9621-96 Avenue Peace River, Alberta T8S 1T4 Attention: Mr. Ed Szmata PEACE REGION (SWAN HILLS AREA)
Limited Geotechnical Engineering Evaluation Classroom Additions Albany County Campus Laramie, Wyoming
 Limited Geotechnical Engineering Evaluation Classroom Additions Albany County Campus 2300 Missile Drive, Cheyenne, Wyoming 82001 Phone 307-635-0222 www.stratageotech.com Limited Geotechnical Engineering
A. V T = 1 B. Ms = 1 C. Vs = 1 D. Vv = 1
 Geology and Soil Mechanics 55401 /1A (2002-2003) Mark the best answer on the multiple choice answer sheet. 1. Soil mechanics is the application of hydraulics, geology and mechanics to problems relating
Geology and Soil Mechanics /1A ( ) Mark the best answer on the multiple choice answer sheet.
 Mark the best answer on the multiple choice answer sheet.") Geology and Soil Mechanics 55401 /1A (2003-2004) Mark the best answer on the multiple choice answer sheet. 1. Soil mechanics is the application of hydraulics, geology and mechanics to problems relating
Geology and Soil Mechanics 55401 /1A (2003-2004) Mark the best answer on the multiple choice answer sheet. 1. Soil mechanics is the application of hydraulics, geology and mechanics to problems relating
Lake Rotoiti Wastewater Scheme - Stage 1 Investigations. Rotorua Lakes Council
 Lake Rotoiti Wastewater Scheme - Stage 1 Investigations Rotorua Lakes Council i Contents 1 Introduction...1 2 Site Description...1 3 Geological Setting...1 4 Geotechnical Investigation...1 4.1 Borehole
SOIL AND AGGREGATE FUNDAMENTALS STUDENT GUIDE AMRC April, 2006 AREA MANAGER ROADS CERTIFICATION PROGRAM FOR EDUCATIONAL PURPOSES ONLY
 AREA MANAGER ROADS CERTIFICATION PROGRAM AMRC 2011 SOIL AND AGGREGATE FUNDAMENTALS STUDENT GUIDE FOR EDUCATIONAL PURPOSES ONLY April, 2006 WPC #28013 07/09 2009 by British Columbia Institute of Technology
(C) Global Journal of Engineering Science and Research Management
 Global Journal of Engineering Science and Research Management") GEOTECHNCIAL ASSESSMENT OF PART OF PORT HARCOURT, NIGER DELTA FOR STRUCTURAL ANALYSIS Warmate Tamunonengiyeofori Geostrat International Services Limited, www.geostratinternational.com. *Correspondence
GEOTECHNCIAL ASSESSMENT OF PART OF PORT HARCOURT, NIGER DELTA FOR STRUCTURAL ANALYSIS Warmate Tamunonengiyeofori Geostrat International Services Limited, www.geostratinternational.com. *Correspondence
GEOTECHNICAL INVESTIGATION REPORT
 GEOTECHNICAL INVESTIGATION REPORT SOIL INVESTIGATION REPORT FOR STATIC TEST FACILITY FOR PROPELLANTS AT BDL, IBRAHIMPATNAM. Graphics Designers, M/s Architecture & Engineering 859, Banjara Avenue, Consultancy
Reference No S072 APRIL 2012
 A REPORT TO SOLMAR DEVELOPMENT CORP. A PRELIMINARY SOIL INVESTIGATION FOR PROPOSED SUBDIVISION DEVELOPMENT NORTHEAST OF SIDEROAD 5 AND 0 LINE TOWN OF ERIN Reference No. 202-S072 APRIL 202 DISTRIBUTION
February 22, 2016 AG File No
 Ainley Graham & Associates Limited 1-50 Grant Timmins Drive, Kingston, Ontario, K7M 8N2 Tel: (343) 266-0002 Fax: (343) 266-0028 E-mail Kingston@ainleygroup.com February 22, 2016 AG File No. 15062-1 Ministry
Date: April 2, 2014 Project No.: Prepared For: Mr. Adam Kates CLASSIC COMMUNITIES 1068 E. Meadow Circle Palo Alto, California 94303
 City of Newark - 36120 Ruschin Drive Project Draft Initial Study/Mitigated Negative Declaration Appendix C: Geologic Information FirstCarbon Solutions H:\Client (PN-JN)\4554\45540001\ISMND\45540001 36120
June 9, R. D. Cook, P.Eng. Soils Engineer Special Services Western Region PUBLIC WORKS CANADA WESTERN REGION REPORT ON
 PUBLIC WORKS CANADA WESTERN REGION REPORT ON GEOTECHNICAL INVESTIGATION PROPOSED MARTIN RIVER BRIDGE MILE 306.7 MACKENZIE HIGHWAY Submitted by : R. D. Cook, P.Eng. Soils Engineer Special Services Western
Northern Colorado Geotech
 PRELIMINARY GEOTECHNICAL ENGINEERING REPORT PROPOSED CECIL FARMS DEVELOPMENT WELD COUNTY ROAD 7, BETWEEN ROADS 7 AND 7 SEVERANCE, COLORADO NORTHERN COLORADO GEOTECH PROJECT NO. 0-6 APRIL 0, 06 Prepared
APPENDIX F CORRELATION EQUATIONS. F 1 In-Situ Tests
 APPENDIX F 1 APPENDIX F CORRELATION EQUATIONS F 1 In-Situ Tests 1. SPT (1) Sand (Hatanaka and Uchida, 1996), = effective vertical stress = effective friction angle = atmosphere pressure (Shmertmann, 1975)
Geotechnical Data Report
 Geotechnical Data Report Downtown Greenville Future Conveyance Study December 1, 2015 Terracon Project No. 86155032 Prepared for: Prepared by: Terracon Consultants, Inc. December 1, 2015 561 Mauldin Road
Report of Preliminary Geotechnical Exploration. CSO-012 Sewer Separation Cincinnati, Hamilton County, Ohio. February, 2011
 11242843_GeoTech_Preliminary - Feburary 2011_1/40 Report of Preliminary Geotechnical Exploration CSO-012 Sewer Separation Cincinnati, Hamilton County, Ohio February, 2011 11242843_GeoTech_Preliminary -
ADDENDUM 1 FISHER SLOUGH RESTORATION PROJECT SKAGIT COUNTY, WASHINGTON
 F I N A L A D D E N D U M 1 R E P O R T ADDENDUM 1 FISHER SLOUGH RESTORATION PROJECT SKAGIT COUNTY, WASHINGTON REPORT OF GEOTECHNICAL INVESTIGATION URS JOB NO. 3376186 Prepared for Tetra Tech Inc. 142
Eastgate Parking Lot Geotechnical Investigation
 Eastgate Parking Lot Geotechnical Investigation Cambium Reference No.: 336- March 4, 24 Prepared for: City of Peterborough Cambium Inc. P.O. Box 325 52 Hunter Street East, Peterborough Ontario, K9H G5
Central Queensland Coal Project Appendix 4b Geotechnical Assessment. Environmental Impact Statement
 Central Queensland Coal Project Appendix 4b Geotechnical Assessment Environmental Impact Statement GEOTECHNICAL ASSESSMENT OF OPEN CUT MINING ADJACENT TO THE BRUCE HIGHWAY, CENTRAL QUEENSLAND COAL PROJECT
GEOTECHNICAL INVESTIGATION. Proposed Douglas Street Bus Lane
 May, 0 GEOTECHNICAL INVESTIGATION Proposed Douglas Street Bus Lane Submitted to: Greg Smith P.Eng. Senior Transportation Engineer Urban Systems Ltd. 0- Homer Street Vancouver, BC V6B W9 REPORT Report Number:
UNDP HARARE HOSPITAL PROPOSED NATPHARM WAREHOUSE
 UNDP HARARE HOSPITAL PROPOSED NATPHARM WAREHOUSE January 17 2016 TO CARRY OUT IN-SITU SOIL SURVEY, LABORATORY TESTS AND GEOTECHNICAL REPORTING. GEOTECHNICAL INVESTIGATIONS REPORT 1 2 Re: GEOTECHNICAL INVESTIGATIONS
SOIL INVESTIGATION REPORT. PROPOSED HOUSING DEVELOPMENT PROJECT Coral Spring, Trelawny, Jamaica.
 SOIL INVESTIGATION REPORT PROPOSED HOUSING DEVELOPMENT PROJECT Coral Spring, Trelawny, Jamaica. Prepared for: FCS Consultants 7a Barbados Avenue Kingston 5, Jamaica Prepared by: NHL Engineering Limited
Appendix H. Geotechnical Investigation Report. Krosno Creek Flood Reduction Project PROJECT FILE REPORT CITY OF PICKERING
 Krosno Creek Flood Reduction Project PROJECT FILE REPORT CITY OF PICKERING Appendix H Geotechnical Investigation Report TMIG THE MUNICIPAL INFRASTRUCTURE GROUP LTD Report on Geotechnical Investigation
M E M O R A N D U M. Mr. Jonathan K. Thrasher, P.E., Mr. Ian Kinnear, P.E. (FL) PSI
 PSI") M E M O R A N D U M TO: FROM: Mr. Mark Schilling Gulf Interstate Engineering Mr. Jonathan K. Thrasher, P.E., Mr. Ian Kinnear, P.E. (FL) PSI DATE: November 11, 2014 RE: Summary of Findings Geotechnical
M E M O R A N D U M TO: FROM: Mr. Mark Schilling Gulf Interstate Engineering Mr. Jonathan K. Thrasher, P.E., Mr. Ian Kinnear, P.E. (FL) PSI DATE: November 11, 2014 RE: Summary of Findings Geotechnical
Landslide stability analysis using the sliding block method
 Landslide stability analysis using the sliding block method E. Lino, R. Norabuena, M. Villanueva & O. Felix SRK Consulting (Peru) S.A., Lima, Peru A. Lizcano SRK Consulting (Vancouver) S.A., British Columbia,
Converse Consultants Geotechnical Engineering, Environmental & Groundwater Science, Inspection & Testing Services
 Converse Consultants Geotechnical Engineering, Environmental & Groundwater Science, Inspection & Testing Services Ms. Rebecca Mitchell Mt. San Antonio College Facilities Planning & Management 1100 North
IAEA SAFETY STANDARDS Geotechnical Aspects of Site Evaluation and Foundations in NPPs, NS-G-3.6
 IAEA SAFETY STANDARDS Geotechnical Aspects of Site Evaluation and Foundations in NPPs, NS-G-3.6 Regional Workshop on Volcanic, Seismic, and Tsunami Hazard Assessment Related to NPP Siting Activities and
Landslide FE Stability Analysis
 Landslide FE Stability Analysis L. Kellezi Dept. of Geotechnical Engineering, GEO-Danish Geotechnical Institute, Denmark S. Allkja Altea & Geostudio 2000, Albania P. B. Hansen Dept. of Geotechnical Engineering,
Slope Stability Assessment Proposed Development 4401 Fallowfield Road Lands Ottawa, Ontario Rev-02
 REPORT August 2014 REPORT ON Slope Stability Assessment Proposed Development 4401 Fallowfield Road Lands Ottawa, Ontario Submitted to: DCR Phoenix Homes 18 Bentley Avenue Ottawa, Ontario K2E 6T8 Report
Boreholes. Implementation. Boring. Boreholes may be excavated by one of these methods: 1. Auger Boring 2. Wash Boring 3.
 Implementation Boreholes 1. Auger Boring 2. Wash Boring 3. Rotary Drilling Boring Boreholes may be excavated by one of these methods: 4. Percussion Drilling The right choice of method depends on: Ground
CHAPTER FIVE 5.0 STABILITY OF CUT SLOPES IN THE STUDY AREA. them limited by a thick canopy of vegetation and steep slope angles.
 CHAPTER FIVE 5.0 STABILITY OF CUT SLOPES IN THE STUDY AREA 5.1. Introduction Ukay Perdana area is a developing community with continuous building activities and road construction. There are thus only left
Design of RC Retaining Walls
 Lecture - 09 Design of RC Retaining Walls By: Prof Dr. Qaisar Ali Civil Engineering Department UET Peshawar www.drqaisarali.com 1 Topics Retaining Walls Terms Related to Retaining Walls Types of Retaining
 SOIL CLASSIFICATION CHART COARSE-GRAINED SOILS MORE THAN 50% RETAINED ON NO.200 SIEVE FINE-GRAINED SOILS 50% OR MORE PASSES THE NO.200 SIEVE PRIMARY DIVISIONS GRAVELS MORE THAN 50% OF COARSE FRACTION RETAINED
Geotechnical Data Report
 Geotechnical Data Report ReWa Solar Farm at Durbin Creek Fountain Inn, South Carolina September 1, 2017 Terracon Project No. 86165043 Prepared for: Renewable Water Resources Greenville, South Carolina
Geotechnical Engineering Report
 Geotechnical Engineering Report Turner Turnpike Widening Bridge B Bridge Crossing: South 257 th West Avenue Creek County, Oklahoma June 1, 2016 Terracon Project No. 04155197 Prepared for: Garver, LLC Tulsa,
IV. ENVIRONMENTAL IMPACT ANALYSIS G. GEOLOGY AND SOILS
 IV. ENVIRONMENTAL IMPACT ANALYSIS G. GEOLOGY AND SOILS The following section is a summary of the geotechnical report conducted for the proposed project. The Report of Geotechnical Investigation Proposed
GEOTECHNICAL INVESTIGATION MULTIPLE STREETS AND ROADS F18-INF CITY OF CLARENCE-ROCKLAND
 GEOTECHNICAL INVESTIGATION MULTIPLE STREETS AND ROADS F18-INF-2018-012 CITY OF CLARENCE-ROCKLAND Prepared for: The City of Clarence-Rockland Attn: Mr. Alain Beaulieu, Coordinator, Capital Projects 1560
Solution:Example 1. Example 2. Solution: Example 2. clay. Textural Soil Classification System (USDA) CE353 Soil Mechanics Dr.
 CE353 Soil Mechanics Dr.") CE353 Soil Mechanics CE353 Lecture 5 Geotechnical Engineering Laboratory SOIL CLASSIFICATION Lecture 5 SOIL CLASSIFICATION Dr. Talat A Bader Dr. Talat Bader 2 Requirements of a soil Systems Why do we need
CE353 Soil Mechanics CE353 Lecture 5 Geotechnical Engineering Laboratory SOIL CLASSIFICATION Lecture 5 SOIL CLASSIFICATION Dr. Talat A Bader Dr. Talat Bader 2 Requirements of a soil Systems Why do we need
APPENDIX A - PART 2 GEOTECHNICAL AND ENVIRONMENTAL REPORTS
 The City of Winnipeg Appendix A - Part 2 Bid Opportunity No. 210-2014 Addendum #1 Page 1 of 1 Template Version: C420131129 - RW APPENDIX A - PART 2 GEOTECHNICAL AND ENVIRONMENTAL REPORTS Quality Engineering
Introduction to Soil Mechanics Geotechnical Engineering-II
 Introduction to Soil Mechanics Geotechnical Engineering-II ground SIVA Dr. Attaullah Shah 1 Soil Formation Soil derives from Latin word Solum having same meanings as our modern world. From Geologist point
Slope Stability Evaluation Ground Anchor Construction Area White Point Landslide San Pedro District Los Angeles, California.
 Slope Stability Evaluation Ground Anchor Construction Area White Point Landslide San Pedro District Los Angeles, California Submitted To: Mr. Gene Edwards City of Los Angeles Department of Public Works
GEOTECHNICAL SITE INVESTIGATION REPORT SUBDIVISION - SELECTED LOTS AKISQNUK FIRST NATION WINDERMERE, BC
 GEOTECHNICAL SITE INVESTIGATION REPORT SUBDIVISION - SELECTED LOTS AKISQNUK FIRST NATION WINDERMERE, BC Prepared For: Akisqnuk First Nation Windermere, BC Box 688 Fernie, BC V0B 1M0 250 423 4829 August
Internal C Unit Dilatanc y
 2 Grimsby Sub was not at any time definitively established. The preliminary analysis provided by Thurber Engineering Ltd indicates the slope should be stable with a factor of safety of 1.23 for a deep
1. PROJECT BACKGROUND. July 18, Alberta Infrastructure & Transportation Central Region #401, Street Red Deer, Alberta T4N 6K8
 July 18, 2005 Alberta Infrastructure & Transportation Central Region #401, 4902 51 Street Red Deer, Alberta T4N 6K8 Mr. Alain Momedi, P.Eng. Project Engineer Dear Mr. Momedi: H11:04 km 11.1 Erosion along
GEOTECHNICAL REPORT. Matanuska-Susitna Borough. Parks Highway Connections Museum Drive. Matanuska-Susitna Borough, Alaska.
 Matanuska-Susitna Borough GEOTECHNICAL REPORT Parks Highway Connections Museum Drive Matanuska-Susitna Borough, Alaska March 2, 20 Prepared By: John Thornley, PE Geotechnical Engineer 333 Arctic Blvd.,
Prediction of subsoil subsidence caused by opencast mining
 Land Subsidence (Proceedings of the Fifth International Symposium on Land Subsidence, The Hague, October 1995). IAHS Publ. no. 234, 1995. 167 Prediction of subsoil subsidence caused by opencast mining
GEOTECHNICAL INVESTIGATION REPORT INFRASTRUCTURE PVT LTD
 GEOTECHNICAL INVESTIGATION REPORT Client : TAEIN CONSTRUCTION & INFRASTRUCTURE PVT LTD Office address : Flat No.104, A -Wing,1st floor,gloria Park, Paranjape Scheme, Bavdhan Khurd, Chandni Chowk, Pune
Hydro One (Sept 2014) Hydro One (Sept 2014) Hydro One (Sept 2014)
 Hydro One (Sept 2014) Hydro One (Sept 2014)") TABLE 1 WELL CONSTRUCTION DETAILS MOE WWR No Well ID Location Installation Date Status Easting Coordinates Northing Source Elevation Screened Interval Screened Material Borehole Well Stick-up Ground Top
TABLE 1 WELL CONSTRUCTION DETAILS MOE WWR No Well ID Location Installation Date Status Easting Coordinates Northing Source Elevation Screened Interval Screened Material Borehole Well Stick-up Ground Top
3.0 SUMMARY OF FINDINGS
 AECOM 500 W Jefferson St. Suite 1600 Louisville, KY 40202 www.aecom.com 502-569-2301 tel 502-569-2304 fax October 17, 2018 Big Rivers Electric Corporation Sebree Generating Station 9000 Highway 2096 Robards,
IMAGING OF DEEP SINKHOLES USING THE MULTI-ELECTRODE RESISTIVITY IMPLANT TECHNIQUE (MERIT) CASE STUDIES IN FLORIDA
 CASE STUDIES IN FLORIDA") IMAGING OF DEEP SINKHOLES USING THE MULTI-ELECTRODE RESISTIVITY IMPLANT TECHNIQUE (MERIT) CASE STUDIES IN FLORIDA David Harro The G3 Group, 2509 Success Drive, Suite 1, Odessa, FL 33556, david.harro@geo3group.com
IMAGING OF DEEP SINKHOLES USING THE MULTI-ELECTRODE RESISTIVITY IMPLANT TECHNIQUE (MERIT) CASE STUDIES IN FLORIDA David Harro The G3 Group, 2509 Success Drive, Suite 1, Odessa, FL 33556, david.harro@geo3group.com
Geotechnical Engineering Study, Conifer Senior High School Football Field Improvements, Conifer, Colorado
 2390 South Lipan Street Denver, CO 80223 phone: (303) 742-9700 fax: (303) 742-9666 email: kadenver@kumarusa.com www.kumarusa.com Office Locations: Denver (HQ), Colorado Springs, Fort Collins, and Frisco,
J. Paul Guyer, P.E., R.A.
 J. Paul Guyer, P.E., R.A. Paul Guyer is a registered mechanical engineer, civil engineer, fire protection engineer and architect with over 35 years experience in the design of buildings and related infrastructure.
File: Highway 1 Admirals/McKenzie Interchange, Saanich, BC Pavement Drilling / Coring Geotechnical Investigation
 TECHNICAL MEMO To: Mr. Salem Bahamdun, P.Eng. Date: February 2, 2017 c: Memo No.: From: Ms. Susanne Ouellet, E.I.T. Mr. Andrew Walker, P.Eng. File: 704TRN.PAVE0303807 ISSUED FOR USE Subject: Highway 1
SITE INVESTIGATION 1
 SITE INVESTIGATION 1 Definition The process of determining the layers of natural soil deposits that will underlie a proposed structure and their physical properties is generally referred to as site investigation.
CCR Rule Annual Inspection Report (cont.) 2
 2") The inspection findings consisted of maintenance items and items that were not observed to be signs or potential signs of significant structural weakness. No deficiencies or disrupting conditions that
The inspection findings consisted of maintenance items and items that were not observed to be signs or potential signs of significant structural weakness. No deficiencies or disrupting conditions that
MEMORANDUM. wa.tsr..-z.n~.e.s-t.i~at.i.o.ns... Branch... Mr. Webster contends that prior to excavation of the gravel
 TO... J. C. Foweraker 2... Head Gr o w a t er S e c t i on... Hyar....og~~~.~.~vis.ion... wa.tsr..-z.n~.e.s-t.i~at.i.o.ns... Branch... eernment OF BRITISH COLUMBIA MEMORANDUM II 0 PROM A. P. Kohut, Geological
APPENDIX C. Borehole Data
 APPENDIX C Borehole Data MAJOR DIVISIONS SOIL CLASSIFICATION CHART SYMBOLS GRAPH LETTER TYPICAL DESCRIPTIONS ADDITIONAL MATERIAL
ARCH 1250 APPLIED ENVIRONMENTAL STUDIES
 John Seitz, RA, LEED AP Assistant Adjunct Professor Professor Paul C. King, RA, AIA, ARA Assistant Professor Geology Geology is the scientific study of the structure and composition of the earth s surface
GEOTECHNICAL REPORT CBSA Facility Redevelopment Thousand Islands International Crossing Lansdowne, Ontario
 GEOTECHNICAL REPORT CBSA Facility Redevelopment Thousand Islands International Crossing Lansdowne, Ontario Prepared For: The Federal Bridge Corporation Limited SPL Project No.: 10001084 Report Date: January
GEOLOGY, SOILS, AND SEISMICITY
 4.9 GEOLOGY, SOILS, AND SEISMICITY 4.9.1 Introduction Information about the geological conditions and seismic hazards in the study area was summarized in the FEIR, and was based on the Geotechnical Exploration
Geotechnical Indications Of Eastern Bypass Area In Port Harcourt, Niger Delta
 Geotechnical Indications Of Eastern Bypass Area In Port Harcourt, Niger Delta Warmate Tamunonengiyeofori Geostrat International Services Limited, Rivers State, Nigeria www.geostratinternational.com info@geostratinternational.com,
design, construction, operation, and maintenance of the BAP is consistent with recognized and generally accepted good engineering standards.
 design, construction, operation, and maintenance of the BAP is consistent with recognized and generally accepted good engineering standards. In addition to the field inspection, Associated Engineers, Inc.
KDOT Geotechnical Manual Edition. Table of Contents
 KDOT Geotechnical Manual 2007 Edition The KDOT Geotechnical Manual is available two volumes. Both volumes are very large electronic (pdf) files which may take several minutes to download. The table of
Geotechnical Investigation Report
 Geotechnical Investigation Report Proposed Salt Storage Shed Majestic Hills Drive Hamilton Township, Ontario Hamilton Township 7 Pido Road Peterborough Ontario K9J 6X7 Canada 568 0 Report No June 08 Table
Engineer. Engineering. Engineering. (in-ja-neer ) A person trained and skilled in any of the various branches of engineering: a civil engineer
 A person trained and skilled in any of the various branches of engineering: a civil engineer") Engineer (in-ja-neer ) A person trained and skilled in any of the various branches of engineering: a civil engineer (Random House Webster s College Dictionary, 1991) CE100 Introduction to Civil Geotechnical
Engineer (in-ja-neer ) A person trained and skilled in any of the various branches of engineering: a civil engineer (Random House Webster s College Dictionary, 1991) CE100 Introduction to Civil Geotechnical