Ice Shelf Melt Rates and 3D Imaging
|
|
|
- Andrew Hamilton
- 5 years ago
- Views:
Transcription

1 Ice Shelf Melt Rates and 3D Imaging Cameron Lewis University of Kansas 2335 Irving Hill Road Lawrence, KS Technical Report CReSIS TR

2 Ice Shelf Melt Rates and 3D Imaging Cameron Lewis 05/08/15
3 Presentation outline Background Recommendations from committee Radar system simulation Ice-shelf melt rates Petermann glacier Thickness profiles and thickness changes Surface vs basal melt rates 3D imaging Data set selection Bed maps and crossover analysis Summary and recommendations

4 What are ice shelves? Floating ice attached to land Distinct from sea ice which forms by freezing sea water Fed by glaciers and ice streams flowing off the land Typically found in embayments where side walls and pinning points provide protection from open ocean Largest (Ross and Ronne- Filchner) can cover 500,000 km 2 Thickness vary from 2 km at the grounding line to 100 m at the ocean edge Doake, 2001
5 Importance of ice shelves Play an important role in the global climate system Considered a sensitive indicators of climate change Two critical roles: Buttressing effect on glaciers and ice streams, regulating their flow velocities Ice shelf collapse could generate unchecked ice-sheet mass loss Loss of buttressing ice in Pine Island region has lead to significant glacial flow rates Basal melting and refreezing of large ice shelves influences the development of Antarctic Bottom Water Bottom water acts as a heat sink within the southern ocean circulation Thinning or loss of ice shelves can change bottom water development and subsequently global ocean circulation and ocean nutrient transport Monitoring changes in shelf mass balance can provide insight into shelf stability
6 Mass balance factors Lateral: Ice shelf mass balance Input glacial inflow from ice sheet Output ocean-edge calving Surface: Input snow accumulation Output blown snow, sublimation, surface melt Base: Input basal refreezing Output basal melting
7 Observed melt rates Region Melt Rate Thickness Reference George IV, Southern Antarctica ± m, measured over 12 days 450 m average Corr and others, 2002 peninsula 2.78 ± 0.08 m/yr equivalent Rutford Ice Stream grounding line, Ronne-Filchner ice shelf 1-4 m/yr 1.4 km average Jenkins and Doake, 1991 Ronne-Filchner ice shelf, 30 km from ice front, 50 km NW of Filchner Station 1.41 ± 0.45 m/yr, measured at a single point over 2 years 1.5 ± 0.15 m/yr, the mean of measurements from a 10 km square grid over 26 days 240 m average Grosfeld and others, 1992 Pine Island Glacier 44 ± 6 m/yr at grounding line 1 km average Rignot and Jacobs, 2002 Petermann Glacier 30 m/yr at grounding line 300 m average Rignot and Steffen, m/yr at ice front Petermann Glacier m/yr, spatially averaged 300 m average, 600 m maximum Münchow and others, 2014 Ross Ice Shelf, near Mercer ice stream grounding line 2.5 ± 0.7 m, measured over 1 month 900 m average Anandakrishnan and others, 2014 (AGU, unpublished)

8 UHF radar Wideband chirped-pulse, MHz Designed to work on ground-based and airborne platforms Designed to map layering in polar firn Field experiments confirmed its ability to sound shallow ice and ice shelves Cross-track array to allows for 3D processing Parameter Value Unit Center Frequency 750 MHz Bandwidth 300 MHz Waveform Pulsed Chirp Pulse Duration Airborne: µs Surface: Peak transmit power Airborne: 5 W Surface: 1 Pulse repetition frequency 50 khz Antennas Twin Otter: Vivaldi P-3: Elliptical Dipole Surface: PCB Dipole Polarization VV Sampling frequency 1 GHz Hardware coherent averages 128 Data rate 3.9 MB/s Dynamic Range 161 db DDS AMPS GPS TX MUX CLOCK RX MUX
9 Recommendations from Committee Demonstration of the technique to estimate basal melt rates from the UHF radar data and/or other depth sounder data Separate the effects of ice motion and surface accumulation from basal melt rate estimates Generate 3D basal images via the MUSIC algorithm using the UHF radar data Validation of 3D image results using cross lines Radar system response simulation using CAD tools and comparison with measurements

10 Radar system simulation Measured radar subsystems (transmitter, receiver, optical delay line) ADS used to create cascaded system response Transmitter BPF Filter Coupler Main Line Delay Line Isolators Attenuators τ Coupler Coupled Line BPF Filter Receiver
11 Radar system simulation ADS results exported to Matlab Ideal chirp: MHz, 2µs, -26 dbm, 20% tukey window Good main lobe and trailing sidelobe agreement First trailing sidelobe from delay line target Sidelobe pairs highlighted, high sidelobe response poor filter port VSWR Disagreement below -21 db level, 1/125 th of peak power Workflow Diagram Measured (S) Radar τ Measured Delay Line ADS Measured Response Matlab Plots


12 Petermann glacier Fast-flowing, marine-terminating glacier Drains roughly 4% of Greenland ice sheet Ice front at ~45 km from grounding line Average thickness: ~300 m Thickness at grounding line: ~550 m Major calving events in 2010 and 2012 Average velocity: ~1.2 km/yr Average reported surface melt: ~1.2 m/yr Average reported basal melt: m/yr

13 3 nearly identical flight lines May 7, 2011 April 20, 2013 May 12, 2014 Track follows flow streamline Thickness observed from grounding line to ice front Petermann glacier

14 Petermann glacier Basal interface traceable with UHF radar to ~5 km from grounding line Basal interface between 5 km and ground line filled in using VHF sounder
15 Thickness and velocity
16 Radar vs hydrostatic thickness
17 Thickness changes H t + uh = a m
18 Non-steady-state thickness change The change in ice thickness at a particular location (parcel) over a period of time Thickness changes H t + uh = a m Steady-state thickness change u H + H u Mass flux divergence + non-linear dynamic thinning External mass loss/gain a = surface accumulation ablation m = basal melt - freezing Advection of ice in/out of particular location Assume cross-track flow is negligible, u H = v 0 H y Non-linear dynamic thinning, H u, has been shown to be negligible
19 Consider steady-state thinning first Thickness changes y 1 2Hdy H = y 2 y 1 y 1 Create along-track cumulative average ice thickness to reduce noise of point-by-point thickness comparisons
20 Thickness changes Use cumulative average thickness to calculate flux divergence
21 Non-steady-state thinning Thickness changes Point-by-point subtraction of H divided by time difference
22 Total thickness loss Thickness changes
23 Bright internal layer tracked from yearto-year Internal layer assumed to be stable Thickness change calculation methods repeated Surface Layer Layer Bottom Surface vs basal melt
24 Melt rate summary UHF radar-tracked thickness UHF radar hydrostatic thickness ATM-derived hydrostatic thickness [Münchow and other, 2014] VHF radar thickness [Rignot and Steffen, 2008] Flux-gate [Rignot and others, 2001] Year v 0 H y [m/yr] H/ t [m/yr] Total [m/yr] Velocity [km/yr] Year Surface melt [m/yr] Basal melt [m/yr]
25 Major results: Melt rate summary In general, shelf in hydrostatic balance beyond 20km from grounding line Disagreement between radar-track and hydrostatic thickness close to grounding line suggests the shelf has some inertia after decoupling from the bedrock and needs time to come into general hydrostatic equilibrium Basal interface is heavily crevassed, hydrostatic assumption does not fully capture their number and magnitude Seaward accelerations jumped 15x (4m/yr 2 60m/yr 2 ) in the last decade Steady-state melt rates appear to be stable, non-steady-state melt appears to jump significantly following major calving events
26 3D image generation Ground-based version of UHF radar used to image shallow ice 12 or 16 virtual phase center cross-track antenna array MUSIC algorithm used to determine cross-track angle of arrival Two data sets collected in Antarctica Grid near exposed nunatak in Pirrit Hills region Square track on Kamb Ice Stream Basal interface exhibited off-nadir backscatter


27 Pirrit Hills Ice Surface Bedrock Ice Surface Bedrock 42 db

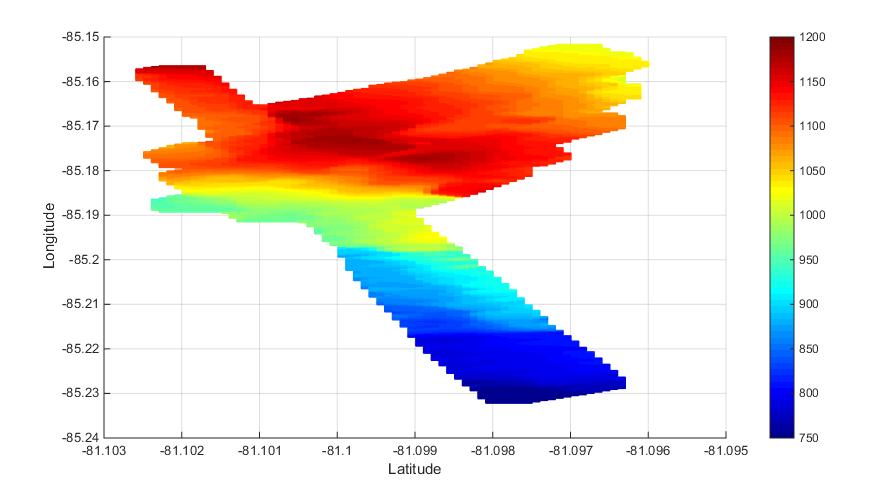
28 Pirrit Hills


29 Kamb Ice Stream Ice Surface Bedrock

30 Kamb Ice Stream

31 Crossover analysis Pirrit Hills parallel tracks Elevation error values range from 0 to 70 m Only 5% of pixels where error on the order of the radar resolution Largest elevation errors at steep transitions on the SW side of the ridge

32 Crossover analysis Pirrit Hills cross track Elevation error also varies between 0 and 70 m Only 2% of pixels where error on the order of the radar resolution Again, largest errors appear to occur mostly as sharp elevation transitions

33 Crossover analysis Kamb Ice Stream corner overlap Roughly 80m x 80m Errors range from 0 to 14 m Significant elevation error in one corner possibly due to low SNR
34 3D imaging summary Proposed 3D algorithm appears to produce coarse resolution topography Some major feature clearly distinguishable Shape and orientation of under-ice ridge in Pirrit Hills region Grooves in bedrock below Kamb Ice Stream parallel to flow Error analysis shows algorithm is not effective at imaging small scale features reliably MUSIC algorithm is calculating a spectrum based on the energy received from all targets within the radar footprint
 leads to ambiguity Desired spectrum with distinct peaks response from a point target Spatial Frequency")
35 Relative Power 3D imaging summary Antenna Array Footprint MUSIC divides footprint up into bins and evaluates the signal strength from each bin User can define the number of bins to divide the footprint into Spectrum from distributed target (red, green) leads to ambiguity Desired spectrum with distinct peaks response from a point target Spatial Frequency
36 Recommendations for Future Work Estimate cross-track angle of arrival using Fourier methods (e.g. periodogram Require large cross-track antenna array Need for agile platform, ability to perform repeatable tightly-spaced survey lines and accommodate a large antenna array Meridian UAV has 8 m wing span, 36 element antenna array, 5º resolution Sierra/Viking UAVs have 6 m wing span, 28 elements, 6.5º resolution Possible survey parameters: 100 m altitude ~8.7 m surface, ~35.8 m base of ice shelf 50% swath overlap, maximum swath width ±45º 340 m flight line spacing Resolution/swath width include 1 air/ice refraction at surface

37 Recommendations for Future Work Conformal PCB antennas built into wing skin Wideband 16-element VHF/UHF ( MHz) array successfully designed for Basler Elements could be scaled for MHz operation 16 element array size reduced to 0.98 m x 0.22 m Increased to 36 elements: 2.2 m length Ground plane height reduced to 4.4 cm, Meridian could accommodate with a wing thickness of about 11 cm 0.16 m 3.6 m 0.8 m Basler array dimensions
38 Contributions Refined radar hardware for both airborne and ground-based deployment Publication in high visibility journal: Lewis C, Gogineni SP, Rodriguez-Morales F, Panzer B, Stumpf T, Paden J, and Leuschen C (2015) Airborne fine-resolution UHF radar: an approach to the study of englacial reflections, firn compaction, and ice attenuation rates. Journal of Glaciology: Instruments and Methods, 61(225), Applied radar system to measure ice shelf basal melt rates Highly detailed look at Petermann glacier basal interface Ability to measure surface and basal melt separately through tracked internal layer Explored creation of 3D imagery Imaging of large-scale features possible Found significant limitations to fine-resolution imaging Sets a precedent for future use of a large antenna array aboard a UAV

39 Questions?
Basal topography and thinning rates of Petermann Gletscher, northern Greenland, measured by ground-based phase-sensitive radar
 Basal topography and thinning rates of Petermann Gletscher, northern Greenland, measured by ground-based phase-sensitive radar Craig Stewart British Antarctic Survey, Natural Environment Research Council,
Use of Geophysical Software for Interpretation of Ice-Penetrating Radar Data and Mapping of Polar Ice Sheets
 Use of Geophysical Software for Interpretation of Ice-Penetrating Radar Data and Mapping of Polar Ice Sheets Alex O. Martinez University of Kansas 2335 Irving Hill Road Lawrence, KS 66045-7612 http://cresis.ku.edu
Effect of Ocean Warming on West Antarctic Ice Streams and Ice Shelves. Bryan Riel December 4, 2008
 Effect of Ocean Warming on West Antarctic Ice Streams and Ice Shelves Bryan Riel December 4, 2008 Ice Sheet Mass Balance/WAIS Dynamics -Mass Balance = (Ice/Snow Accumulation) (Surface melting, ice outflux,
Ocean Ice Interactions: A
 Ocean Ice Interactions: A Cryospheric Perspective Tony Payne a.j.payne@bristol.ac.uk Steph Cornford, Rupert Gladstone and Dan Martin (LLNL) KISS short course Sept. 2013 Slide number 1/37 Outline Evidence
TEACHER PAGE Trial Version
 TEACHER PAGE Trial Version * After completion of the lesson, please take a moment to fill out the feedback form on our web site (https://www.cresis.ku.edu/education/k-12/online-data-portal)* Lesson Title:
Ice Sheets and Glaciers
 Ice Sheets and Glaciers Technical University of Denmark Kees van der Veen Department of Geography University of Kansas Why are glaciers and ice sheets important? Large volume of fresh water stored in ice
The State of the cryosphere
 The State of the cryosphere Course outline Introduction The cryosphere; what is it? The Earth; a unique planet Cryospheric components Classifications Lecture outlines The State of the cryosphere The State
Accelerating ice loss from the fastest Greenland and Antarctic glaciers
 GEOPHYSICAL RESEARCH LETTERS, VOL. 38,, doi:10.1029/2011gl047304, 2011 Accelerating ice loss from the fastest Greenland and Antarctic glaciers R. Thomas, 1 E. Frederick, 1 J. Li, 2 W. Krabill, 1 S. Manizade,
Glacier (and ice sheet) Mass Balance
 Mass Balance") Glacier (and ice sheet) Mass Balance The long-term average position of the highest (late summer) firn line is termed the Equilibrium Line Altitude (ELA) Firn is old snow How an ice sheet works (roughly):
Glacier (and ice sheet) Mass Balance The long-term average position of the highest (late summer) firn line is termed the Equilibrium Line Altitude (ELA) Firn is old snow How an ice sheet works (roughly):
Effect of Ocean Warming on West Antarctic Ice Streams and Ice Shelves
 Effect of Ocean Warming on West Antarctic Ice Streams and Ice Shelves By Bryan Riel GEO 387H Physical Climatology Dr. Zong-Liang Yang November 18, 2008 Abstract The Intergovernmental Panel on Climate Change
SUPPLEMENTARY INFORMATION
 This section includes additional information for the model parameters as well as the results of a set of sensitivity experiments to illustrate the dependence of the model behavior on different parameter
Buoyant flexure and basal crevassing in dynamic mass loss at Helheim Glacier
 SUPPLEMENTARY INFORMATION DOI: 10.1038/NGEO2204 Buoyant flexure and basal crevassing in dynamic mass loss at Helheim Glacier Timothy D. James*, Tavi Murray, Nick Selmes, Kilian Scharrer and Martin O Leary
Glaciers and Ice Sheets Mapping Orbiter
 Glaciers and Ice Sheets Mapping Orbiter A concept submitted to Decadal Study-Request for Information Kenneth Jezek 1, Ernesto Rodgriquez 2, Prasad Gogineni 3, Anthony Freeman 2, John Curlander 4 1. Byrd
Swath Mode Altimetry. Noel Gourmelen
 Swath Mode Altimetry Noel Gourmelen 1 Outline Background Impact case studies: Topography Rates of surface elevation change 2 Products and applications of radar altimetry over Ice Sheet, Ice Caps, Glaciers:
ACTIVITY II: THE FATE OF THE LARSEN S, A FAMILY OF ANTARCTIC ICE SHELVES
 ACTIVITY II: THE FATE OF THE LARSEN S, A FAMILY OF ANTARCTIC ICE SHELVES Ice Shelves play a critical role in Antarctica, serving as a buffer between the ocean and the continental ice sheet covering the
SUPPLEMENTARY INFORMATION
 SUPPLEMENTARY INFORMATION doi: 10.108/ngeo75 This section includes additional information for the model parameters as well as the results of a set of sensitivity experiments to illustrate the dependence
Coastal Antarctic polynyas: A coupled process requiring high model resolution in the ocean and atmosphere
 Coastal Antarctic polynyas: A coupled process requiring high model resolution in the ocean and atmosphere Mike Dinniman and John Klinck Center for Coastal Physical Oceanography Old Dominion University
Spectral Albedos. a: dry snow. b: wet new snow. c: melting old snow. a: cold MY ice. b: melting MY ice. d: frozen pond. c: melting FY white ice
 Spectral Albedos a: dry snow b: wet new snow a: cold MY ice c: melting old snow b: melting MY ice d: frozen pond c: melting FY white ice d: melting FY blue ice e: early MY pond e: ageing ponds Extinction
Advanced Lecture: Oceanographic regime of the West Antarctic Ice Shelves
 ACDC2010: Ice Sheet - Ocean Interactions 8-19 June 2010, MIT FABLAB, Lyngen, NORWAY Advanced Lecture: Oceanographic regime of the West Antarctic Ice Shelves Adrian Jenkins British Antarctic Survey, Natural
APPLICATION OF AIRCRAFT LASER ALTIMETRY TO GLACIER AND ICE CAP MASS BALANCE STUDIES
 APPLICATION OF AIRCRAFT LASER ALTIMETRY TO GLACIER AND ICE CAP MASS BALANCE STUDIES W. Abdalati and W.B. Krabill Laboratory for Hydrospheric Processes NASA Goddard Space Flight Center U.S.A. waleed.abdalati@gsfc.nasa.gov
Meltwater produced by wind-albedo interaction stored in an East Antarctic ice shelf Supplementary Information
 Meltwater produced by wind-albedo interaction stored in an East Antarctic ice shelf Supplementary Information 1 Supplementary Figure 1: (a) Upper and (b) lower surface of an englacial lake surveyed by
Airborne Measurement of Snow Thickness Over Sea Ice
 Airborne Measurement of Snow Thickness Over Sea Ice Uniquiea B. Wade Elizabeth City State University Elizabeth City, North Carolina 27909 Abstract Snow cover on sea ice plays an important role in the climate
Grounding line mapping in Antarctica using 15 years of DInSAR data
 Grounding line mapping in Antarctica using 15 years of DInSAR data Jérémie Mouginot 1 Eric Rignot 1,2, Bernd Scheuchl 1 1 University of California, Irvine 2 Jet Propulsion Laboratory Introduction Outline
BELISSIMA: BELgian Ice Sheet- Shelf Ice Measurements in Antarctica
 BELISSIMA: BELgian Ice Sheet- Shelf Ice Measurements in Antarctica Frank PATTYN 1, Jean-Louis TISON 1, Denis SAMYN 1, Kenichi MATSUOKA², Howard CONWAY², Bryn HUBBARD³ (1)Laboratoire de Glaciologie, DSTE,
Observations of Arctic snow and sea ice thickness from satellite and airborne surveys. Nathan Kurtz NASA Goddard Space Flight Center
 Observations of Arctic snow and sea ice thickness from satellite and airborne surveys Nathan Kurtz NASA Goddard Space Flight Center Decline in Arctic sea ice thickness and volume Kwok et al. (2009) Submarine
Summary for the Greenland ice sheet
 Contribution of Greenland and Antarctica to future sea level change Catherine Ritz, Gaël Durand, Fabien Gillet-Chaulet, Olivier Gagliardini, Vincent Peyaud EDGe team, LGGE, CNRS/UJF Grenoble, France Ice
4. What type of glacier forms in a sloping valley between rock walls? a. firn glacier b. ice sheet c. cirque d. alpine glacier
 Multiple Choice Questions 1. The term means the loss of snow and ice by evaporation and melting. a. sublimation b. ablation c. erosion d. abrasion 2. What condition must be met for a glacier to begin flowing
Ice in the climate system. Summary so far. Today. The Cryosphere. 1. Climate history of the Earth. 2. Paleo observations (1)
") Ice in the climate system 1. Climate history of the Earth 2. Paleo observations (1) 3. Paleo observations (2) 4. Ice ages 5. Climate sensitivity 6. Ice in the climate system Summary so far Radiation (Milankovitch
Ice in the climate system 1. Climate history of the Earth 2. Paleo observations (1) 3. Paleo observations (2) 4. Ice ages 5. Climate sensitivity 6. Ice in the climate system Summary so far Radiation (Milankovitch
SCIENTIFIC REPORT NERC GEF
 SCIENTIFIC REPORT NERC GEF Loan 927 Measuring changes in the dynamics of Pine Island Glacier, Antarctica A.M. Smith & E.C. King, British Antarctic Survey (BAS) pp J.B.T. Scott ABSTRACT A brief period of
2/23/2009. Visualizing Earth Science. Chapter Overview. Deserts and Drylands. Glaciers and Ice Sheets
 Visualizing Earth Science By Z. Merali and B. F. Skinner Chapter 6 Deserts, Glaciers and Ice Sheets Chapter Overview Deserts and Drylands Glaciers and Ice Sheets Deserts Geography Categorization of deserts
DETERMINATION OF ICE THICKNESS AND VOLUME OF HURD GLACIER, HURD PENINSULA, LIVINGSTONE ISLAND, ANTARCTICA
 Universidad de Granada MASTER S DEGREE IN GEOPHYSICS AND METEOROLOGY MASTER S THESIS DETERMINATION OF ICE THICKNESS AND VOLUME OF HURD GLACIER, HURD PENINSULA, LIVINGSTONE ISLAND, ANTARCTICA ÁNGEL RENTERO
Figure 3.1: Illustration showing the bathymetry s role for the tsunami propagation following the earth quake 26 December 2004 outside of Sumatra.
 Figure 3.1: Illustration showing the bathymetry s role for the tsunami propagation following the earth quake 26 December 2004 outside of Sumatra. The left globe shows the seafloor bathymetry as portrayed
Today s Lecture: Land, biosphere, cryosphere (All that stuff we don t have equations for... )
") Today s Lecture: Land, biosphere, cryosphere (All that stuff we don t have equations for... ) 4 Land, biosphere, cryosphere 1. Introduction 2. Atmosphere 3. Ocean 4. Land, biosphere, cryosphere 4.1 Land
Today s Lecture: Land, biosphere, cryosphere (All that stuff we don t have equations for... ) 4 Land, biosphere, cryosphere 1. Introduction 2. Atmosphere 3. Ocean 4. Land, biosphere, cryosphere 4.1 Land
Lecture 10 Glaciers and glaciation
 Lecture 10 Glaciers and glaciation Outline Importance of ice to people! Basics of glaciers formation, classification, mechanisms of movement Glacial landscapes erosion and deposition by glaciers and the
Glaciology (as opposed to Glacial Geology) Why important? What are glaciers? How do they work?
 Why important? What are glaciers? How do they work?") Glaciology (as opposed to Glacial Geology) Why important? What are glaciers? How do they work? Glaciers are important because of their role in creating glacial landscapes (erosional and depositional features).
Glaciology (as opposed to Glacial Geology) Why important? What are glaciers? How do they work? Glaciers are important because of their role in creating glacial landscapes (erosional and depositional features).
Validation of the Antarctic Snow Accumulation and Ice Discharge Basal Stress Boundary of the Southeastern Region of the Ross Ice Shelf, Antarctica
 Validation of the Antarctic Snow Accumulation and Ice Discharge Basal Stress Boundary of the Southeastern Region of the Ross Ice Shelf, Antarctica TEAM MEMBERS Ayanna Overton, junior Charlie Nelson, senior
Glaciers and Ice Sheets Mapping Orbiter Concept
 Glaciers and Ice Sheets Mapping Orbiter Concept Kenneth Jezek 1, Ernesto Rodríguez 2, Prasad Gogineni 3, Anthony Freeman 2, John Curlander 4, Xiaoqing Wu 4, John Paden 3, Chris Allen 3 1. Byrd Polar Research
Interactions between ice and ocean observed with phase-sensitive radar near an Antarctic ice-shelf grounding line
 Journal of Glaciology, Vol. 52, No. 178, 2006 325 Interactions between ice and ocean observed with phase-sensitive radar near an Antarctic ice-shelf grounding line Adrian JENKINS, Hugh F.J. CORR, Keith
UNSTOPPABLE COLLAPSE OF THE WEST ANTARCTIC ICE SHEET IS NOT HAPPENING
 UNSTOPPABLE COLLAPSE OF THE WEST ANTARCTIC ICE SHEET IS NOT HAPPENING Dr. Don J. Easterbrook, Western Washington University, Bellingham, WA May 19, 2014 A New York Times headline reads Scientists Warn
Is the Number of Icebergs Around Antarctica Really Increasing?
 Is the Number of Icebergs Around Antarctica Really Increasing? David G. Long* and Jarom Ballantyne Brigham Young University 459 Clyde Building Provo UT 84601 long@ee.byu.edu Cheryl Bertoia U. S. National
Figure 1: Two schematic views of the global overturning circulation. The Southern Ocean plays two key roles in the global overturning: (1) the
 the") Figure 1: Two schematic views of the global overturning circulation. The Southern Ocean plays two key roles in the global overturning: (1) the Antarctic Circumpolar Current connects the ocean basins, establishing
Figure 1: Two schematic views of the global overturning circulation. The Southern Ocean plays two key roles in the global overturning: (1) the Antarctic Circumpolar Current connects the ocean basins, establishing
Ice sheet mass balance from satellite altimetry. Kate Briggs (Mal McMillan)
") Ice sheet mass balance from satellite altimetry Kate Briggs (Mal McMillan) Outline Background Recap 25 year altimetry record Recap Measuring surface elevation with altimetry Measuring surface elevation
Ice sheet mass balance from satellite altimetry Kate Briggs (Mal McMillan) Outline Background Recap 25 year altimetry record Recap Measuring surface elevation with altimetry Measuring surface elevation
Antarctica & Greenland, Theory & Observations
 Ocean-Ice Interactions: Antarctica & Greenland, Theory & Observations Keck Institute for Space Studies September 9, 2013 David HOLLAND New York University + Abu Dhabi 0 Overview: Ocean-Ice Interface Delivery
"Ice Sheets and Sea Level Rise: How Should IPCC Handle Deep Uncertainty?" Michael Oppenheimer For Inside the IPCC Princeton University 1 April 2008
 "Ice Sheets and Sea Level Rise: How Should IPCC Handle Deep Uncertainty?" Michael Oppenheimer For Inside the IPCC Princeton University 1 April 2008 This Talk is about: IPCCs (controversial) assessment
Glaciers form wherever snow and ice can accumulate High latitudes High mountains at low latitudes Ice temperatures vary among glaciers Warm
 The Cryosphere Glaciers form wherever snow and ice can accumulate High latitudes High mountains at low latitudes Ice temperatures vary among glaciers Warm (temperate) glaciers: at pressure melting point,
Ice Sheets and Climate Change. William H. Lipscomb Los Alamos National Laboratory
 Ice Sheets and Climate Change William H. Lipscomb Los Alamos National Laboratory What is an expert? An expert is somebody who is more than 50 miles from home, has no responsibility for implementing the
Glacial Geomorphology Lecture 1: Glaciers & Glacial Environments. GGY 166: Geomorphology of Southern Africa
 Glacial Geomorphology Lecture 1: Glaciers & Glacial Environments GGY 166: Geomorphology of Southern Africa Relevance in Southern African Context South African landscape has been influenced by glacial action
Investigations of the mass balance of the southeastern Ronne Ice Shelf, Antarctica
 Annals of Glaciology 29 1999 # International Glaciological Society Investigations of the mass balance of the southeastern Ronne Ice Shelf, Antarctica A. Lambrecht, * C. Mayer, H. Oerter, U. Nixdorf Alfred
Thomas P. Phillips CIRES Prof K. Steffen, L. Colgan PhD ABD, D. McGrath MA
 Thomas P. Phillips CIRES Prof K. Steffen, L. Colgan PhD ABD, D. McGrath MA Problem: we know very little about the processes happening within the Greenland Ice Sheet. What is the velocity at the base? What
Ice shelves in a warming world: The Filchner-Ronne Ice Shelf system
 Ice shelves in a warming world: The Filchner-Ronne Ice Shelf system Svein Østerhus Oceanographer uni research climate NARE prosjekt: Long-term observing system for the oceanic regime of Filchner-Ronne
Glacier Elevation, Volume and Mass Change
 8/8/12 Glacier Elevation, Volume and Mass Change 1 Outline: Elevation, Volume and Mass Change ① Elevation change fundamentals ② Elevation measurement platforms ③ Calculating elevation change ④ Calculating
Orbit and Transmit Characteristics of the CloudSat Cloud Profiling Radar (CPR) JPL Document No. D-29695
 JPL Document No. D-29695") Orbit and Transmit Characteristics of the CloudSat Cloud Profiling Radar (CPR) JPL Document No. D-29695 Jet Propulsion Laboratory California Institute of Technology Pasadena, CA 91109 26 July 2004 Revised
Orbit and Transmit Characteristics of the CloudSat Cloud Profiling Radar (CPR) JPL Document No. D-29695 Jet Propulsion Laboratory California Institute of Technology Pasadena, CA 91109 26 July 2004 Revised
FORMATION OF THE WEST ANTARCTIC ICE SHEET
 Annals of Glaciology 1988 @ nternational Glaciological Society FORMATON OF THE WEST ANTARCTC CE SHEET by D.R. Lindstrom (University of Chicago, Department of the Geophysical Sc iences, 5734 S. Ellis Avenue,
Glaciers. (Shaping Earth s Surface, Part 6) Science 330 Summer 2005
 Science 330 Summer 2005") Glaciers (Shaping Earth s Surface, Part 6) Science 330 Summer 2005 1 Glaciers Glaciers are parts of two basic cycles Hydrologic cycle Rock cycle Glacier a thick mass of ice that originates on land from
Glaciers (Shaping Earth s Surface, Part 6) Science 330 Summer 2005 1 Glaciers Glaciers are parts of two basic cycles Hydrologic cycle Rock cycle Glacier a thick mass of ice that originates on land from
S3-A Land and Sea Ice Cyclic Performance Report. Cycle No Start date: 30/09/2017. End date: 27/10/2017
 PREPARATION AND OPERATIONS OF THE MISSION PERFORMANCE CENTRE (MPC) FOR THE COPERNICUS SENTINEL-3 MISSION Start date: 30/09/2017 End date: 27/10/2017 Ref. S3MPC.UCL.PR.08-023 Contract: 4000111836/14/I-LG
Atmospheric Lidar The Atmospheric Lidar (ATLID) is a high-spectral resolution lidar and will be the first of its type to be flown in space.
 is a high-spectral resolution lidar and will be the first of its type to be flown in space.") www.esa.int EarthCARE mission instruments ESA s EarthCARE satellite payload comprises four instruments: the Atmospheric Lidar, the Cloud Profiling Radar, the Multi-Spectral Imager and the Broad-Band Radiometer.
www.esa.int EarthCARE mission instruments ESA s EarthCARE satellite payload comprises four instruments: the Atmospheric Lidar, the Cloud Profiling Radar, the Multi-Spectral Imager and the Broad-Band Radiometer.
PISM, a Parallel Ice Sheet Model: Current status of our Antarctic ice sheet simulation
 PISM, a Parallel Ice Sheet Model: Current status of our Antarctic ice sheet simulation Craig Lingle, 1 Ed Bueler, 2 Jed Brown, 1 and David Covey, 1 1 Geophysical Institute, Univ. of Alaska, Fairbanks 2
Exploring The Polar Connection to Sea Level Rise NGSS Disciplinary Core Ideas Science & Engineering Crosscutting Concepts
 Exploring The Polar Connection to Sea Level Rise NGSS Disciplinary Core Ideas Science & Engineering Crosscutting Concepts Practices MS - ESS: Earth & Space Science 1. Ask questions 2. Developing and using
ATOC OUR CHANGING ENVIRONMENT Class 19 (Chp 6) Objectives of Today s Class: The Cryosphere [1] Components, time scales; [2] Seasonal snow
![ATOC OUR CHANGING ENVIRONMENT Class 19 (Chp 6) Objectives of Today s Class: The Cryosphere [1] Components, time scales; [2] Seasonal snow](/thumbs/95/126309683.jpg "ATOC OUR CHANGING ENVIRONMENT Class 19 (Chp 6) Objectives of Today s Class: The Cryosphere [1] Components, time scales; [2] Seasonal snow") ATOC 1060-002 OUR CHANGING ENVIRONMENT Class 19 (Chp 6) Objectives of Today s Class: The Cryosphere [1] Components, time scales; [2] Seasonal snow cover, permafrost, river and lake ice, ; [3]Glaciers and
ATOC 1060-002 OUR CHANGING ENVIRONMENT Class 19 (Chp 6) Objectives of Today s Class: The Cryosphere [1] Components, time scales; [2] Seasonal snow cover, permafrost, river and lake ice, ; [3]Glaciers and
K&C Phase 4 Status report. Ice Sheet Monitoring using ALOS-2. University of California, Irvine 2 JPL
 K&C Phase 4 Status report Ice Sheet Monitoring using ALOS-2 Bernd Scheuchl 1, Jeremie Mouginot 1, Eric Rignot 1,2 1 University of California, Irvine 2 JPL Science Team meeting #24 Tokyo, Japan, January
Any Questions? Glacier
 Geology of the Hawaiian Islands Class 25 13 April 2004 Any Questions? Earth Systems Today CD Click on Weather and Climate Look at the sections on El Niño Ozone Hole Glaciers Why do we care? They help control
Glaciers. Geology of the Hawaiian Islands. Any Questions? Earth Systems Today CD. Class April Why do we care?
 Geology of the Hawaiian Islands Class 25 13 April 2004 Any Questions? Earth Systems Today CD Click on Weather and Climate Look at the sections on El Niño Ozone Hole Glaciers Why do we care? They help control
S3-A Land and Sea Ice Cyclic Performance Report. Cycle No Start date: 21/04/2017. End date: 18/05/2017
 PREPARATION AND OPERATIONS OF THE MISSION PERFORMANCE CENTRE (MPC) FOR THE COPERNICUS SENTINEL-3 MISSION Cycle No. 017 Start date: 21/04/2017 End date: 18/05/2017 Ref. S3MPC.UCL.PR.08-017 Contract: 4000111836/14/I-LG
INTERPRETATION OF POLARISATION BEHAVIOUR OF RADAR WAVES TRANSMITTED THROUGH ANTARCTIC ICE SHELVES.
 INTERPRETATION OF POLARISATION BEHAVIOUR OF RADAR WAVES TRANSMITTED THROUGH ANTARCTIC ICE SHELVES. C S M Doake (1), H F J Corr (1), A Jenkins (1), K W Nicholls (1) and C Stewart (1) (1) British Antarctic
Geomorphologic Mapping by Airborne Laser Scanning in Southern Victoria Land
 Geomorphologic Mapping by Airborne Laser Scanning in Southern Victoria Land Bea Csatho, Terry Wilson, Tony Schenk, Garry McKenzie, Byrd Polar Research Center, The Ohio State University, Columbus, OH William
Future SAR mission concepts
 Future SAR mission concepts PREMIER M. Arcioni, M. Aguirre, P. Bensi, S. D Addio, K. Engel, F. Fois, F. Hélière, M. Kern, A. Lecuyot, C.C. Lin, M. Ludwig, K. Scipal, P. Silvestrin ESTEC, Keplerlaan 1,
Ice in a changing climate
 Ice in a changing climate ESA$Ice$sheets$CCI$$ Phase$1$Results$&$Contribu8on$to$Climate$ Research$ $ $ R"Forsberg,"L"Sørensen,"R"Meister,"J"Levinsen,"" J"Dall,"A"Kusk"(DTU>Space,"Denmark)" T"Nagler"(ENVEO,"Austria)"
Glaciers Earth 9th Edition Chapter 18 Glaciers: summary in haiku form Key Concepts Glaciers Glaciers Glaciers Glaciers
 1 2 3 4 5 6 7 8 9 10 11 12 13 14 Earth 9 th Edition Chapter 18 : summary in haiku form Ten thousand years thence big glaciers began to melt - called "global warming." Key Concepts and types of glaciers.
SEA ICE AND GLOBAL WARMING
 jkjk SEA ICE AND GLOBAL WARMING Lesson plan for grades K- 3 By: Laura Sanders, Environmental Science Institute, March 2011 Length of lesson: two 30- minute class periods SOURCES AND RESOURCES: Atmospheric
Glacier Thermodynamics: Ice Temperature and Heat Transfer Processes
 Glacier Thermodynamics: Ice Temperature and Heat Transfer Processes ESS431: Principles of Glaciology ESS505: The Cryosphere Wednesday, 10/24 Ben Hills Today s Objectives: Why do we care about ice temperature?
Dropping Ice Shelves onto an Ocean Model and Moving Grounding Lines. Robert Hallberg NOAA / GFDL
 Dropping Ice Shelves onto an Ocean Model and Moving Grounding Lines Robert Hallberg NOAA / GFDL Projected Global Mean Sea Level Rise Sources of uncertainty in 2100 global mean sea level projections: Forcing
Ice shelf thickness over Larsen C, Antarctica, derived from satellite altimetry
 Click Here for Full Article GEOPHYSICAL RESEARCH LETTERS, VOL. 36,, doi:10.1029/2009gl039527, 2009 Ice shelf thickness over Larsen C, Antarctica, derived from satellite altimetry J. A. Griggs 1 and J.
Figure 3.1: Illustration showing the bathymetry s role for the tsunami propagation following the earth quake 26 December 2004 outside of Sumatra.
 Figure 3.1: Illustration showing the bathymetry s role for the tsunami propagation following the earth quake 26 December 2004 outside of Sumatra. The left globe shows the seafloor bathymetry as portrayed
Supplementary Materials for
 advances.sciencemag.org/cgi/content/full/3/12/e1701169/dc1 Supplementary Materials for Abrupt shift in the observed runoff from the southwestern Greenland ice sheet Andreas P. Ahlstrøm, Dorthe Petersen,
INCREASED UTILITY OF SEA WINDS THROUGH ENHANCED CALIBRATION
 INCREASED UTILITY OF SEA WINDS THROUGH ENHANCED CALIBRATION Peter Yoho Brigham Young University Microwave Earth Remote Sensing Laboratory 459 Clyde Building, Provo, UT 84602 801-422-4884, FAX: 801-422-0201,
Recent changes in high-latitude glaciers, ice caps and ice sheets
 Recent changes in high-latitude glaciers, ice caps and ice sheets Waleed Abdalati NASA/Goddard Space Flight Center, Greenbelt, Maryland The glaciers and ice sheets of the world contain enough ice to raise
Acoustic seafloor mapping systems. September 14, 2010
 Acoustic seafloor mapping systems September 14, 010 1 Delft Vermelding Institute onderdeel of Earth organisatie Observation and Space Systems Acoustic seafloor mapping techniques Single-beam echosounder
Journal of Glaciology, Vol. 61, No. 225, 2015 doi: /2015JoG14J089 89
 Journal of Glaciology, Vol. 61, No. 225, 2015 doi: 10.3189/2015JoG14J089 89 Instruments and Methods Airborne fine-resolution UHF radar: an approach to the study of englacial reflections, firn compaction
Fri. Apr. 06, Map Projections Environmental Applications. Reading: Finish Chapter 9 ( Environmental Remote Sensing )
") Fri. Apr. 06, 2018 Map Projections Environmental Applications Reading: Finish Chapter 9 ( Environmental Remote Sensing ) Once again -- Satellites old but principles still apply Skim Sabins Chapter 10.
Fri. Apr. 06, 2018 Map Projections Environmental Applications Reading: Finish Chapter 9 ( Environmental Remote Sensing ) Once again -- Satellites old but principles still apply Skim Sabins Chapter 10.
POLAR I.C.E. (Interactive Climate Education) REMOTE SENSING: USING RADAR TO LOOK THROUGH ICE
 REMOTE SENSING: USING RADAR TO LOOK THROUGH ICE") POLAR I.C.E. (Interactive Climate Education) REMOTE SENSING: USING RADAR TO LOOK THROUGH ICE BUILD A 3D MODEL OF THE LANDSCAPE THAT LIES UNDER THE ICE! INTRODUCTION: It is hard to believe that melting
POLAR I.C.E. (Interactive Climate Education) REMOTE SENSING: USING RADAR TO LOOK THROUGH ICE BUILD A 3D MODEL OF THE LANDSCAPE THAT LIES UNDER THE ICE! INTRODUCTION: It is hard to believe that melting
Variations in valley glacier activity in the Transantarctic Mountains as indicated by associated flow bands in the Ross Ice Shelf*
 Sea Level, Ice, and Climatic Change (Proceedings of the Canberra Symposium, December 1979). IAHS Publ. no. 131. Variations in valley glacier activity in the Transantarctic Mountains as indicated by associated
Ice sheets of West Antarctica are warming fast. West Antarctic Ice Sheet warming twice earlier estimate
 Ice sheets of West Antarctica are warming fast 02 January 2013 Magazine issue 2898. Subscribe and save For similar stories, visit the Climate Change Topic Guide THE ice sheets of West Antarctica are warming
Investigating snow accumulation variability on the Antarctic Peninsula using Ground Penetrating Radar. - A tool for interpreting ice core records
 Investigating snow accumulation variability on the Antarctic Peninsula using Ground - A tool for interpreting ice core records Elizabeth R. Thomas June 2008 Scientific Report in support of Loan 824 Identifying
Frank PATTYN Laboratoire de Glaciologie Université Libre de Bruxelles Belgium
 Frank PATTYN Laboratoire de Glaciologie Université Libre de Bruxelles Belgium 200 x 10 6 people living in coastal floodplains IPCC, 2007 2 x 10 6 km 2 and 10 12 US$ worth of assets lying
Radar Investigations of Ice Stream Margins: Data Report
 Radar Investigations of Ice Stream Margins: Data Report N. A. Nereson and C. F. Raymond Department of Earth and Space Sciences, Box 35131, University of Washington, Seattle, WA 98195-131 Contents 1 Introduction
Ice on Earth: An overview and examples on physical properties
 Ice on Earth: An overview and examples on physical properties - Ice on Earth during the Pleistocene - Present-day polar and temperate ice masses - Transformation of snow to ice - Mass balance, ice deformation,
Observation of Surface Displacements on Glaciers, Sea Ice, and Ice Shelves Around Canisteo Peninsula, West Antarctica Using 4-Pass DInSAR
 4 hyangsun@kangwon.ac.kr, hoonyol@kangwon.ac.kr Observation of Surface Displacements on Glaciers, Sea Ice, and Ice Shelves Around Canisteo Peninsula, West Antarctica Using 4-Pass DInSAR Hyangsun Han and
Ice flux divergence anomalies on 79north Glacier, Greenland
 GEOPHYSICAL RESEARCH LETTERS, VOL. 38,, doi:10.1029/2011gl047338, 2011 Ice flux divergence anomalies on 79north Glacier, Greenland H. Seroussi, 1,2 M. Morlighem, 1,2 E. Rignot, 1,3 E. Larour, 1 D. Aubry,
ENIGMA: something that is mysterious, puzzling, or difficult to understand.
 Lecture 12. Attempts to solve the Eccentricity Enigma ENIGMA: something that is mysterious, puzzling, or difficult to understand. Milankovitch forcing glacier responses pre-900,000 yr BP glacier responses
SPQ Module 20 Ice Flows
 SPQ Module 20 Ice Flows When Ray, Richard & Kevin received their sleds in Southern Chili they opened them with excitement, and Kevin remarked they look like little canoes. It is perhaps appropriate that
Brita Horlings
 Knut Christianson Brita Horlings brita2@uw.edu https://courses.washington.edu/ess431/ Natural Occurrences of Ice: Distribution and environmental factors of seasonal snow, sea ice, glaciers and permafrost
Ice Sheets and Sea Level -- Concerns at the Coast (Teachers Guide)
") Ice Sheets and Sea Level -- Concerns at the Coast (Teachers Guide) Roughly 153 million Americans (~53% of the US population) live in coastal counties. World wide some 3 billion people live within 200 km
Ice Sheets and Sea Level -- Concerns at the Coast (Teachers Guide) Roughly 153 million Americans (~53% of the US population) live in coastal counties. World wide some 3 billion people live within 200 km
China France. Oceanography S A T. The CFOSAT project. e l l i t e. C. Tison (1), D. Hauser (2), A. Mouche (3) CNES, France (2)
, D. Hauser (2), A. Mouche (3) CNES, France (2)") China France The CFOSAT project C. Tison (1), D. Hauser (2), A. Mouche (3) (1) CNES, France (2) OVSQ, CNRS, LATMOS-IPSL, France (3) IFREMER, LOS, France celine.tison@cnes.fr Oceanography S A T e l l i
China France The CFOSAT project C. Tison (1), D. Hauser (2), A. Mouche (3) (1) CNES, France (2) OVSQ, CNRS, LATMOS-IPSL, France (3) IFREMER, LOS, France celine.tison@cnes.fr Oceanography S A T e l l i
Wind Imaging Spectrometer and Humidity-sounder (WISH): a Practical and Effective NPOESS P3I Sensor
: a Practical and Effective NPOESS P3I Sensor") Wind Imaging Spectrometer and Humidity-sounder (WISH): a Practical and Effective NPOESS P3I Sensor Jeffery J. Puschell Raytheon Space and Airborne Systems Hung-Lung Huang University of Wisconsin, Madison
Wind Imaging Spectrometer and Humidity-sounder (WISH): a Practical and Effective NPOESS P3I Sensor Jeffery J. Puschell Raytheon Space and Airborne Systems Hung-Lung Huang University of Wisconsin, Madison
CRACKS IN THE ARMOR?
 CRACKS IN THE ARMOR? R BY ROBERT MONROE ULE NO. 1 FOR BEHAVIOR around Loose Tooth : Maintain half a football field s distance from its rift zones at all times. As the name of the soon-to-be iceberg suggests,
Ice Sheet Modeling and Sea Level Rise. William Lipscomb, NCAR CESM Sea Level Session 10 January 2018
 Ice Sheet Modeling and Sea Level Rise William Lipscomb, NCAR CESM Sea Level Session 10 January 2018 Ice sheets in IPCC AR4 The IPCC Fourth Assessment Report (AR4) projected 0.18 to 0.59 m of sea level
Modeled and observed fast flow in the Greenland ice sheet
 Modeled and observed fast flow in the Greenland ice sheet Ed Bueler 1 Constantine Khroulev 1 Andy Aschwanden 2 Ian Joughin 3 1 Dept of Mathematics and Statistics, University of Alaska Fairbanks 2 Arctic
Climate-Cryosphere-Tectonics*
 Climate-Cryosphere-Tectonics*! S Anandakrishnan, E Kirby Penn State University * Change and Interactions among Climate, Hydrology, Surface Processes, and Tectonics:! Sean Gulick (co-chair), Kelin Whipple,
T. Perron Glaciers 1. Glaciers
 T. Perron 12.001 Glaciers 1 Glaciers I. Why study glaciers? [PPT: Perito Moreno glacier, Argentina] Role in freshwater budget o Fraction of earth s water that is fresh (non-saline): 3% o Fraction of earth
Changing Landscapes: Glaciated Landscapes. How do glaciers move?
 Changing Landscapes: Glaciated Landscapes How do glaciers move? What you need to know Differences between cold-and warm-based glaciers, their locations and rates of movement Glacier ice movement including