Geomorphologic Mapping by Airborne Laser Scanning in Southern Victoria Land
|
|
|
- Avice Gilmore
- 6 years ago
- Views:
Transcription
1 Geomorphologic Mapping by Airborne Laser Scanning in Southern Victoria Land Bea Csatho, Terry Wilson, Tony Schenk, Garry McKenzie, Byrd Polar Research Center, The Ohio State University, Columbus, OH William Krabill, NASA Wallops Flight Facility, Wallops, VA Cheryl Hallam, US Geological Survey, Reston, VA
2 Outline Overview on laser mapping NASA s Airborne Topographic Mapping (ATM) system ATM survey of Dry Valley Examples of geomorphologic mapping with laser altimetry Glacial geomorphology Volcanic cones Tectonics Note: no agreement about the name of the technique, both laser altimetry and scanning is used 2
 A, B and C are combined with calibration values and correction factors to compute the position of the laser point in a global")
3 Principles of laser altimetry A. Distance between sensor and ground is determined from measurement of laser travel time B. Position of sensor is measured by differential GPS C. Attitude of sensor is measured by Inertial Navigation System (INS) A, B and C are combined with calibration values and correction factors to compute the position of the laser point in a global reference system Result is a set 3D points For mapping applications grids are computed C B A 3
4 Why using LIDAR for cryosphere research? Airborne and satellite laser is ideal for polar and alpine research, because fresh snow is nearly ideal, bright Lambertian reflector laser scanning provides simultaneously synoptic coverage, high spatial resolution and spatial accuracy laser systems can map featureless terrain problem for photogrammetry laser systems have small footprint problem for radar systems 4
5 History and state-of-art The beginning: NASA has started a systematic mapping program in Greenland in the early 1990s Current status: Laser is applied routinely for mass balance and ice dynamics studies over ice sheets and mountain glaciers New sensors: NASA has launched the Ice, Cloud and land Elevation Satellite (ICESat) on January 12, The sole sensor of the satellite is the Geoscience Laser Altimetry System (GLAS), NASA s first terrestrial laser altimetry satellite mission. The program is in calibration/validation phase New applications: first surveys for glacial geomorphology 5
6 Dry Valley airborne laser altimetry survey Goals: obtain precise elevations the ICESat cal/val assess the use of airborne laser for Antarctic mapping purposes Joint project of NASA/NSF/USGS Data acquisition: Sensor: NASA s Airborne Topopgraphic Mapper (ATM) conical laser scanning system Survey: December 2001 Results: coverage of selected site with an average laser point density is point/m 2 6

7 Why did we select Dry Valleys as ICESat calibration site? Small annual and interanual variability no vegetation, minimal snow/ice cover Minimal cloud cover Smooth surface at the scale of the ICESat footprint Diverse topography (slope) High ICESat track density Maximum orbital altitude Close to major science targets Taylor Valley Mt. Erebus 7
 High track density (left) Maximum range part of ICESat orbit")
8 Why did we select Dry Valleys as ICESat calibration site? (cont.) High track density (left) Maximum range part of ICESat orbit (right) 8
9 Target areas for testing geological and glaciological applications 50 km McMurdo Station 9
 or")


10 Data acquisition system: Airborne Toporaphic Mapper, NASA/WFF Conical scan pattern Installed in P-3 (Orion) or Twin Otter aircrafts Specifications: Spectra Physics TFR laser Green wavelength Scan with nutating mirror degree off nadir angle Hz scan rate 5,000-20,000 pulse rate Installed in P3-B Orion Intensity + passive channel 1 meter footprint size 10

11 Data Processing Steps 11
12 Accuracy of DEMs Data Distribution Accuracy RMS error of m is estimated by comparison with 80+ ground GPS points. Note: For most stations the exact height of the antanna phase center above the topographic surface is not known. Therefore the RMS error of the DEM might be overestimated accuracy studies are ongoing Data distribution: USGS, contact person is Cheryl Hallam, USGS, challam@usgs.gov 12


13 Mapping glacial, tectonic and volcanic geomorphology at the Dry Valleys, Antarctica 13
14 Research interest Glaciology, glacial and periglacial geomorphology Areas: Taylor, Wright, Victoria, McKelvey, Balham, Beacon and Arena valleys, Bull Pass Glacier surface models Drainage patterns Patterned ground Rock Glaciers Mapping volcanic cones Areas: White Island, Mt. Morning, Mt. Erebus, Mt. Discovery Radian Glacier to The Portal Relationship between bedrock structure and ice flow 14
15 Research Interest (cont.) Denton Hills Fault Structure Landscape Analysis Wilson piedmont glaciers lineaments and bedrock structure Cape Royds Pinguin rockery landscape 15
16 Target areas for testing geological and glaciological applications 50 km McMurdo Station 16


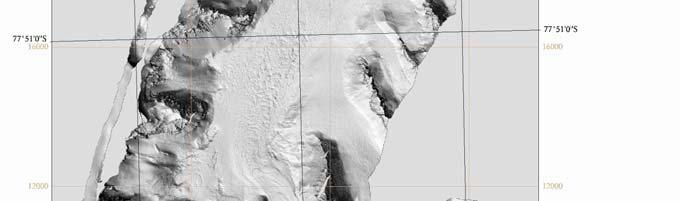
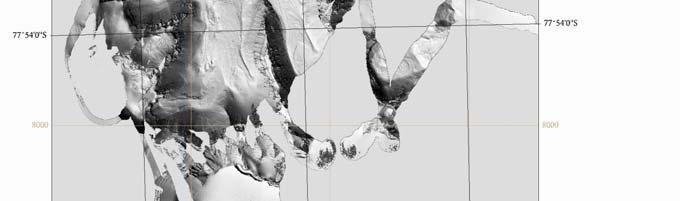
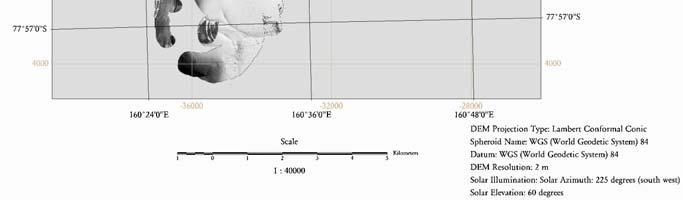
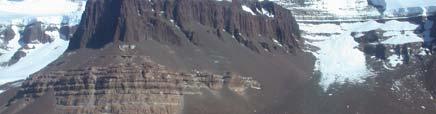
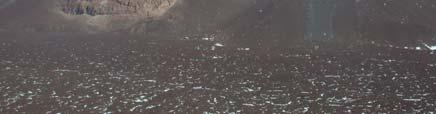
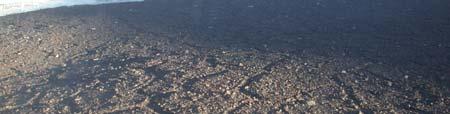
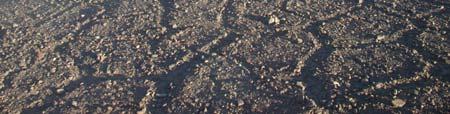
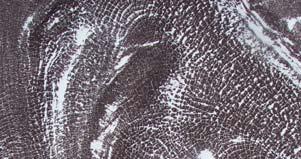
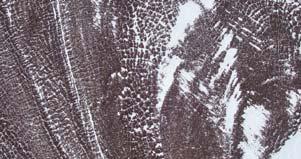
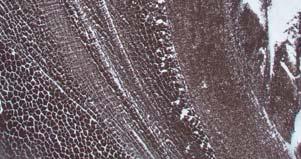
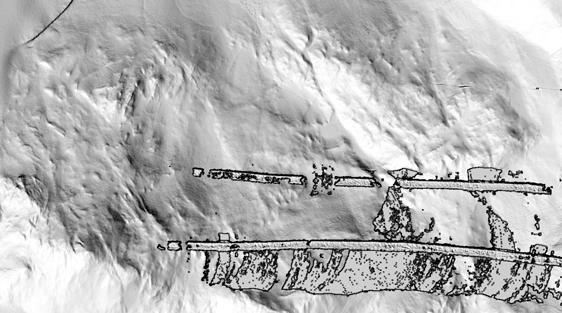
17 Beacon Valley Patterned ground, non-sorted polygons, Rock glacier surface Jurassic sandstone and dolerite sills 5km


18 Closer look at the DEM 18
19 Target areas for testing geological and glaciological applications 50 km McMurdo Station 19
 10")
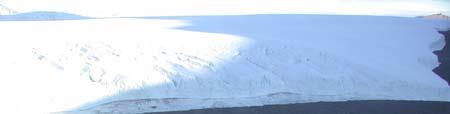
20 Canada glacier (Taylor Valley) 10 km 20
21 Target areas for testing geological and glaciological applications 50 km McMurdo Station 21


22 Denton Hills Shaded refief DEM from laser Landsat TM mosaic (USGS) 22
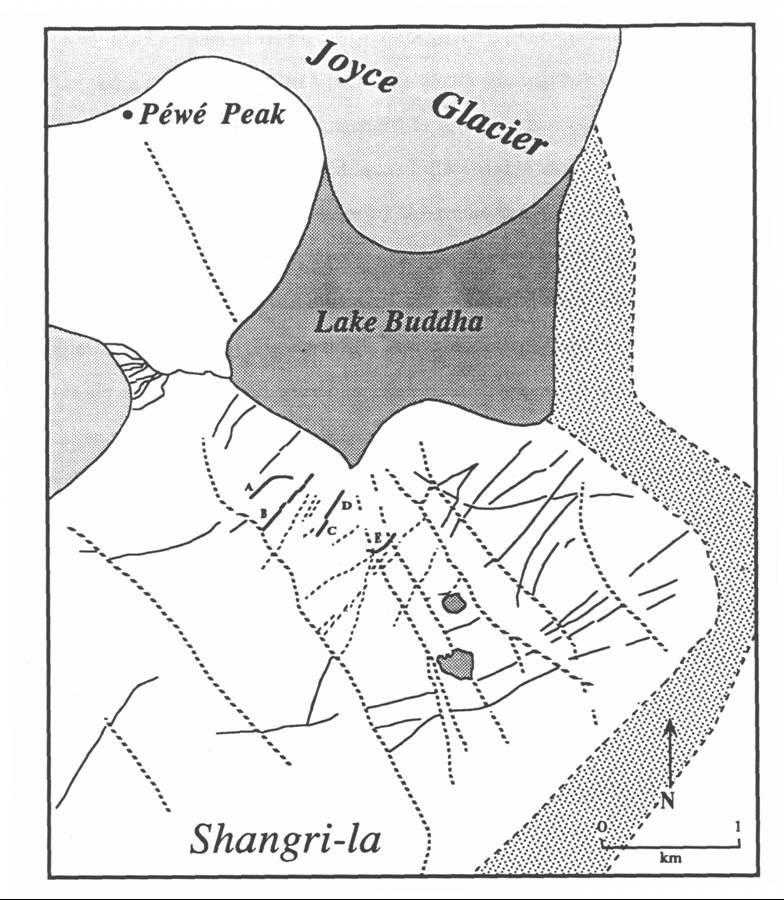
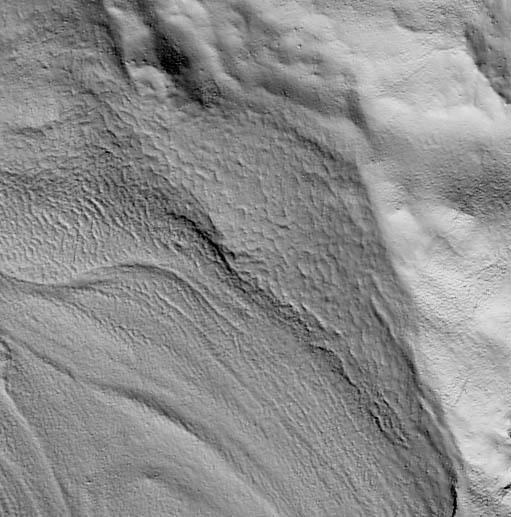
23 Cross-cutting fault array S of Joyce glacier 23


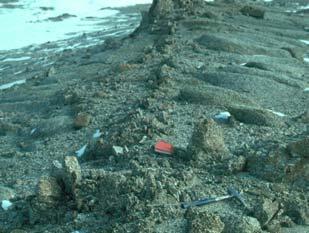
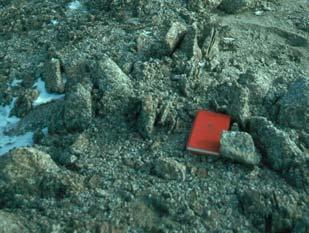
24 Quaternary fault, Garwood valley from Jones,

25 Target areas for testing geological and glaciological applications 50 km McMurdo Station 25


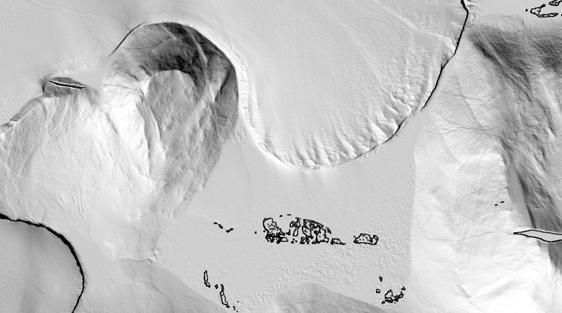
26 Erebus Volcanic Province NE cone elongation and alignments 26


27 Surface signatures of volcanic fissures Horizontal stress direction S Hmax S hmin Cone morphology indicator of fault control (Tibaldi, 1995) 27


28 N slope of Mt. Morning Shaded relief DEM from laser alt. Landsat color composite 28


29 Details of cones on shaded relief DEM Fault parallel elongation Linear alignment and fault parallel breaching 3 km 29
30 Mount Erebus Conclusions Laser mapping provides precise and detailed surface elevations and DEMs It is an exciting new tool for mapping glacial, tectonic and volcanic geomorphology Further research is needed for further validation of the results and for developing tools for feature mapping and measurements 30
Geomorphologic Mapping by Airborne Laser Scanning in the Antarctic Dry Valleys. Bea Csatho and Tony Schenk The Ohio State University, Columbus, OH
 Geomorphologic Mapping by Airborne Laser Scanning in the Antarctic Dry Valleys Bea Csatho and Tony Schenk The Ohio State University, Columbus, OH Outline Overview of airborne laser mapping and polar applications
Subglacial Control on Glacier Flow in Northern Greenland
 Subglacial Control on Glacier Flow in Northern Greenland Beáta Csathó (University at Buffalo, SUNY, Buffalo, NY), C.J. van der Veen (U. of Kansas, Lawrence, KS) Ralph van Frese and Tim Leftwich (The Ohio
APPLICATION OF AIRCRAFT LASER ALTIMETRY TO GLACIER AND ICE CAP MASS BALANCE STUDIES
 APPLICATION OF AIRCRAFT LASER ALTIMETRY TO GLACIER AND ICE CAP MASS BALANCE STUDIES W. Abdalati and W.B. Krabill Laboratory for Hydrospheric Processes NASA Goddard Space Flight Center U.S.A. waleed.abdalati@gsfc.nasa.gov
UTILIZING LIDAR DATA FOR DETECTION OF CHANNEL MIGRATION TAYLOR VALLEY, ANTARCTICA ID: C34A-05
 Martin, M., Commonwealth Glacier, Dry Valleys, Digital Image, Oceanwide Expeditions UTILIZING LIDAR DATA FOR DETECTION OF CHANNEL MIGRATION TAYLOR VALLEY, ANTARCTICA ID: C34A-05 M. Camille Barlow, Jennifer
Aircraft Altimetry and its Application to Glaciology by Anthony Arendt for the UAF Summer School in Glaciology, June 2010
 Aircraft Altimetry and its Application to Glaciology by Anthony Arendt for the UAF Summer School in Glaciology, June 2010 1 Overview Aircraft laser altimetry is a relatively new tool in glaciology that
Geoscience Australia Report on Cal/Val Activities
 Medhavy Thankappan Geoscience Australia Agency Report I Berlin May 6-8, 2015 Outline 1. Calibration / validation at Geoscience Australia Corner reflector infrastructure for SAR calibration (for information)
TEACHER PAGE Trial Version
 TEACHER PAGE Trial Version * After completion of the lesson, please take a moment to fill out the feedback form on our web site (https://www.cresis.ku.edu/education/k-12/online-data-portal)* Lesson Title:
The ICESat 2 Mission Laser altimetry of ice, clouds and land elevation
 OSTM SWT San Diego October 2011 The ICESat 2 Mission Laser altimetry of ice, clouds and land elevation and also ocean, coastal, and continental waters Charon Birkett, ESSIC/UMD on behalf of T. Markus,
Glacier Elevation, Volume and Mass Change
 8/8/12 Glacier Elevation, Volume and Mass Change 1 Outline: Elevation, Volume and Mass Change ① Elevation change fundamentals ② Elevation measurement platforms ③ Calculating elevation change ④ Calculating
Remote Sensing I: Basics
 Remote Sensing I: Basics Kelly M. Brunt Earth System Science Interdisciplinary Center, University of Maryland Cryospheric Science Laboratory, Goddard Space Flight Center kelly.m.brunt@nasa.gov (Based on
A Novel Approach to Measuring Glacier Motion Remotely using Aerial LiDAR
 A Novel Approach to Measuring Glacier Motion Remotely using Aerial LiDAR JENNIFER TELLING, ANDREW FOUNTAIN, CRAIG GLENNIE, MACIEK OBRYK AGU FALL MEETING, DECEMBER 14, 2016 C34C-07 Study Area Taylor Valley,
IEEE GEOSCIENCE AND REMOTE SENSING LETTERS, VOL. 2, NO. 4, OCTOBER
 IEEE GEOSCIENCE AND REMOTE SENSING LETTERS, VOL. 2, NO. 4, OCTOBER 2005 413 Digital Elevation Model of King Edward VII Peninsula, West Antarctica, From SAR Interferometry and ICESat Laser Altimetry Sangho
SPQ Module 20 Ice Flows
 SPQ Module 20 Ice Flows When Ray, Richard & Kevin received their sleds in Southern Chili they opened them with excitement, and Kevin remarked they look like little canoes. It is perhaps appropriate that
Determining the Impact of Sea Ice Thickness on the
 US NAVAL RESEARCH LABORATORY FIVE YEAR RESEARCH OPTION Determining the Impact of Sea Ice Thickness on the Arctic s Naturally Changing Environment (DISTANCE) Co-PI s for NRL John Brozena, Joan Gardner (Marine
PROANA A USEFUL SOFTWARE FOR TERRAIN ANALYSIS AND GEOENVIRONMENTAL APPLICATIONS STUDY CASE ON THE GEODYNAMIC EVOLUTION OF ARGOLIS PENINSULA, GREECE.
 PROANA A USEFUL SOFTWARE FOR TERRAIN ANALYSIS AND GEOENVIRONMENTAL APPLICATIONS STUDY CASE ON THE GEODYNAMIC EVOLUTION OF ARGOLIS PENINSULA, GREECE. Spyridoula Vassilopoulou * Institute of Cartography
Welcome to PolarConnect. With Kelly McCarthy and NASA s Operation IceBridge
 Welcome to PolarConnect With Kelly McCarthy and NASA s Operation IceBridge 5 May 2016 If you are joining by phone, please mute your phone. Press *6 to mute and *6 to unmute. Participant Introductions In
Ice Thickness and Subglacial Topography Studies by Ground Penetrating Radar during the XX Indian Antarctic Expedition
 Ice Thickness and Subglacial Topography Studies by Ground Penetrating Radar during the XX Indian Antarctic Expedition J.T. GERGAN and RENOJ J. THAYYEN Wadia Institute of Himalayan Geology, Dehradun, Uttaranchal
Down-stream process transition (f (q s ) = 1)
 = 1)") Down-stream process transition (f (q s ) = 1) Detachment Limited S d >> S t Transport Limited Channel Gradient (m/m) 10-1 Stochastic Variation { Detachment Limited Equilibrium Slope S d = k sd A -θ d S
Down-stream process transition (f (q s ) = 1) Detachment Limited S d >> S t Transport Limited Channel Gradient (m/m) 10-1 Stochastic Variation { Detachment Limited Equilibrium Slope S d = k sd A -θ d S
Product Validation Report Polar Ocean
 Product Validation Report Polar Ocean Lars Stenseng PVR, Version 1.0 July 24, 2014 Product Validation Report - Polar Ocean Lars Stenseng National Space Institute PVR, Version 1.0, Kgs. Lyngby, July 24,
Swath Mode Altimetry. Noel Gourmelen
 Swath Mode Altimetry Noel Gourmelen 1 Outline Background Impact case studies: Topography Rates of surface elevation change 2 Products and applications of radar altimetry over Ice Sheet, Ice Caps, Glaciers:
Breakout Session III Evolving landscapes and global environmental change
 Breakout Session III Evolving landscapes and global environmental change 1. Hydrology and critical zone imaging 2. Glaciology: Instrumenting glaciers and ice sheets 3. Polar networks and glacial isostatic
Notes for Remote Sensing: Glacier Elevation, Volume and Mass Change
 Notes for Remote Sensing: Glacier Elevation, Volume and Mass Change Elevation and Volume Change: Alex S Gardner Atmospheric Oceanic and Space Sciences, University of Michigan Aircraft- and satellite- mounted
Tatsuo Sekiguchi* and Hiroshi Sato*
 by Tatsuo Sekiguchi* and Hiroshi Sato* ABSTRACT Landslides induced by heavy rainfall and earthquakes may result in disaster by destroying homes and buildings. High-fluidity landslides caused by liquefied
Terrain Analysis of Taylor Valley, McMurdo Dry Valleys, Antarctica Logan Schmidt, University of Texas Institute for Geophysics.
 Terrain Analysis of Taylor Valley, McMurdo Dry Valleys, Antarctica Logan Schmidt, University of Texas Institute for Geophysics Abstract The surface geology of Taylor Valley records information about the
Observations of Arctic snow and sea ice thickness from satellite and airborne surveys. Nathan Kurtz NASA Goddard Space Flight Center
 Observations of Arctic snow and sea ice thickness from satellite and airborne surveys Nathan Kurtz NASA Goddard Space Flight Center Decline in Arctic sea ice thickness and volume Kwok et al. (2009) Submarine
3/5/05 Dr. Stewart 1
 I. Physiography of Appalachian Mountains A. Introduction 1. These mountains extend from NE Canada to Georgia 2. They are the remains of a deeply eroded, ancient mountain chain once larger than the Himalayans
LVIS OIB 2012 Antarctica Grid Mapping and Flights
 LVIS OIB 2012 Antarctica Grid Mapping and Flights The following document presents LVIS flight lines and sample plans to be considered for the Fall 2012 Antarctica G- V OIB deployment. LVIS Planning Team:
Using High-Resolution Commercial Imagery in the Geosciences
 Using High-Resolution Commercial Imagery in the Geosciences George Roth Geospatial Support Specialist 2015 AGU Student & Early Career Scientist Conference San Francisco, CA December 13th, 2015 The Geoscience
Optimizing Observations of Sea Ice Thickness and Snow Depth in the Arctic
 DISTRIBUTION STATEMENT A. Approved for public release; distribution is unlimited. Optimizing Observations of Sea Ice Thickness and Snow Depth in the Arctic Jacqueline A. Richter-Menge CRREL, 72 Lyme Road,
Fri. Apr. 06, Map Projections Environmental Applications. Reading: Finish Chapter 9 ( Environmental Remote Sensing )
") Fri. Apr. 06, 2018 Map Projections Environmental Applications Reading: Finish Chapter 9 ( Environmental Remote Sensing ) Once again -- Satellites old but principles still apply Skim Sabins Chapter 10.
Fri. Apr. 06, 2018 Map Projections Environmental Applications Reading: Finish Chapter 9 ( Environmental Remote Sensing ) Once again -- Satellites old but principles still apply Skim Sabins Chapter 10.
RADAR Remote Sensing Application Examples
 RADAR Remote Sensing Application Examples! All-weather capability: Microwave penetrates clouds! Construction of short-interval time series through cloud cover - crop-growth cycle! Roughness - Land cover,
Supplementary Fig. 1. Locations of thinning transects and photos of example samples. Mt Suess/Gondola Ridge transects extended metres above
 Supplementary Fig. 1. Locations of thinning transects and photos of example samples. Mt Suess/Gondola Ridge transects extended 260 24 metres above the modern surface of Mackay Glacier, and included 16
USING A LIDAR DEM, RADIOMETRICS AND MAGNETICS TO MAP BASALTIC REGOLITH IN THE LAKE CORANGAMITE CATCHMENT, VICTORIA
 112 USING A LIDAR DEM, RADIOMETRICS AND MAGNETICS TO MAP BASALTIC REGOLITH IN THE LAKE CORANGAMITE CATCHMENT, VICTORIA David Gibson, Andrew Fitzpatrick & Heike Apps CRC LEME, Geoscience Australia, PO Box
Name. 4. The diagram below shows a soil profile formed in an area of granite bedrock. Four different soil horizons, A, B, C, and D, are shown.
 Name 1. In the cross section of the hill shown below, which rock units are probably most resistant to weathering? 4. The diagram below shows a soil profile formed in an area of granite bedrock. Four different
Mass balance of sea ice in both hemispheres Airborne validation and the AWI CryoSat-2 sea ice data product
 Mass balance of sea ice in both hemispheres Airborne validation and the AWI CryoSat-2 sea ice data product Stefan Hendricks Robert Ricker Veit Helm Sandra Schwegmann Christian Haas Andreas Herber Airborne
Wetlands and shallow, freshwater lakes are common on the
 SPECIAL Hydrogeophysics SECTION: H y d r ogeophysics Airborne lidar on the Alaskan North Slope: Wetlands mapping, lake volumes, and permafrost features JEFFREY G. PAINE, JOHN R. ANDREWS, KUTALMIS SAYLAM,
Loan 867. Calibration and validation of the CryoSat radar altimeter: field studies on the Greenland Ice Sheet.
 Loan 867. Calibration and validation of the CryoSat radar altimeter: field studies on the Greenland Ice Sheet. Elizabeth M. MORRIS Scott Polar Research Institute, Lensfield Road, Cambridge CB2 1ER, UK.
Remote sensing of sea ice
 Remote sensing of sea ice Ice concentration/extent Age/type Drift Melting Thickness Christian Haas Remote Sensing Methods Passive: senses shortwave (visible), thermal (infrared) or microwave radiation
Tracy Fuller U. S. Geological Survey. February 24, 2016
 U. S. Geological Survey Arctic Elevation Data Involvement Statewide Alaska IfSAR Radar Collection Program Pan-Arctic Digital Elevation Map International Coordination Tracy Fuller U. S. Geological Survey
EROSIONAL FEATURES. reflect
 reflect Have you ever looked at the land around you and wondered what processes shaped what you see? Perhaps you see mountains, valleys, rivers, or canyons. Do you know how long these geologic features
Generation and analysis of Digital Elevation Model (DEM) using Worldview-2 stereo-pair images of Gurgaon district: A geospatial approach
 using Worldview-2 stereo-pair images of Gurgaon district: A geospatial approach") 186 Generation and analysis of Digital Elevation Model (DEM) using Worldview-2 stereo-pair images of Gurgaon district: A geospatial approach Arsad Khan 1, Sultan Singh 2 and Kaptan Singh 2 1 Department
186 Generation and analysis of Digital Elevation Model (DEM) using Worldview-2 stereo-pair images of Gurgaon district: A geospatial approach Arsad Khan 1, Sultan Singh 2 and Kaptan Singh 2 1 Department
Erosional Features. What processes shaped this landscape?
 Have you ever looked at the land around you and wondered what processes shaped what you see? Perhaps you see mountains, valleys, rivers, or canyons. Do you know how long these geologic features have been
Crossover Analysis of Lambert-Amery Ice Shelf Drainage Basin for. Elevation Changes Using ICESat GLAS Data
 Crossover Analysis of Lambert-Amery Ice Shelf Drainage Basin for Elevation Changes Using ICESat GLAS Dr. SHEN Qiang, Prof. E. Dongchen and Mr. JIN Yinlong (China P. R. Key Words: remote sensing; Lambert-Amery
MONITORING AND MODELING NATURAL AND ANTHROPOGENIC TERRAIN CHANGE
 MONITORING AND MODELING NATURAL AND ANTHROPOGENIC TERRAIN CHANGE Spatial analysis and simulations of impact on landscape processess Helena MITASOVA, Russell S. HARMON, David BERNSTEIN, Jaroslav HOFIERKA,
ESM 186 Environmental Remote Sensing and ESM 186 Lab Syllabus Winter 2012
 ESM 186 Environmental Remote Sensing and ESM 186 Lab Syllabus Winter 2012 Instructor: Susan Ustin (slustin@ucdavis.edu) Phone: 752-0621 Office: 233 Veihmeyer Hall and 115A, the Barn Office Hours: Tuesday
ENGRG Introduction to GIS
 ENGRG 59910 Introduction to GIS Michael Piasecki March 17, 2014 Lecture 08: Terrain Analysis Outline: Terrain Analysis Earth Surface Representation Contour TIN Mass Points Digital Elevation Models Slope
Optimizing Observations of Sea Ice Thickness and Snow Depth in the Arctic
 DISTRIBUTION STATEMENT A. Approved for public release; distribution is unlimited. Optimizing Observations of Sea Ice Thickness and Snow Depth in the Arctic Sinead L. Farrell University of Maryland, ESSIC
China France. Oceanography S A T. The CFOSAT project. e l l i t e. C. Tison (1), D. Hauser (2), A. Mouche (3) CNES, France (2)
, D. Hauser (2), A. Mouche (3) CNES, France (2)") China France The CFOSAT project C. Tison (1), D. Hauser (2), A. Mouche (3) (1) CNES, France (2) OVSQ, CNRS, LATMOS-IPSL, France (3) IFREMER, LOS, France celine.tison@cnes.fr Oceanography S A T e l l i
China France The CFOSAT project C. Tison (1), D. Hauser (2), A. Mouche (3) (1) CNES, France (2) OVSQ, CNRS, LATMOS-IPSL, France (3) IFREMER, LOS, France celine.tison@cnes.fr Oceanography S A T e l l i
Airborne Remote Sensing for Ocean and Coastal Applications
 Airborne Remote Sensing for Ocean and Coastal Applications Ben Reineman, Luc Lenain, Nick Statom, David Castel, Ken Melville Scripps Institution of Oceanography 17 October, 2011 Address for correspondence:
Ice in a changing climate
 Ice in a changing climate ESA$Ice$sheets$CCI$$ Phase$1$Results$&$Contribu8on$to$Climate$ Research$ $ $ R"Forsberg,"L"Sørensen,"R"Meister,"J"Levinsen,"" J"Dall,"A"Kusk"(DTU>Space,"Denmark)" T"Nagler"(ENVEO,"Austria)"
A detailed description of the history, setup and performance of SGL s navigation and drape flying system is contained in reference [1].
![A detailed description of the history, setup and performance of SGL s navigation and drape flying system is contained in reference [1].](/thumbs/90/103916008.jpg "A detailed description of the history, setup and performance of SGL s navigation and drape flying system is contained in reference [1].") Pre-planned drape surfaces: a new survey planning tool Luise Sander* * Sander Geophysics Limited, 260 Hunt Club Road, Ottawa, Ontario, K1V 1C1 Originally presented at CSEG Forum: High Resolution Aeromagnetics
Pre-planned drape surfaces: a new survey planning tool Luise Sander* * Sander Geophysics Limited, 260 Hunt Club Road, Ottawa, Ontario, K1V 1C1 Originally presented at CSEG Forum: High Resolution Aeromagnetics
ENGRG Introduction to GIS
 ENGRG 59910 Introduction to GIS Michael Piasecki November 17, 2017 Lecture 11: Terrain Analysis Outline: Terrain Analysis Earth Surface Representation Contour TIN Mass Points Digital Elevation Models Slope
GIS and Remote Sensing
 Spring School Land use and the vulnerability of socio-ecosystems to climate change: remote sensing and modelling techniques GIS and Remote Sensing Katerina Tzavella Project Researcher PhD candidate Technology
Steven Greco* and George D. Emmitt Simpson Weather Associates, Charlottesville, VA. 2. Experiments
 3.3 INVESTIGATION OF FLOWS WITHIN COMPLEX TERRAIN AND ALONG COASTLINES USING AN AIRBORNE DOPPLER WIND LIDAR: OBSERVATIONS AND MODEL COMPARISONS Steven Greco* and George D. Emmitt Simpson Weather Associates,
A new 1 km digital elevation model of Antarctica derived from combined radar and laser data Part 2: Validation and error estimates
 Author(s) 2009. This work is distributed under the Creative Commons Attribution 3.0 License. The Cryosphere A new 1 km digital elevation model of Antarctica derived from combined radar and laser data Part
A comparison of Greenland ice-sheet volume changes derived from altimetry measurements
 Journal of Glaciology, Vol. 54, No. 185, 2008 203 A comparison of Greenland ice-sheet volume changes derived from altimetry measurements Robert THOMAS, 1 Curt DAVIS, 2 Earl FREDERICK, 1 William KRABILL,
Ice sheet mass balance from satellite altimetry. Kate Briggs (Mal McMillan)
") Ice sheet mass balance from satellite altimetry Kate Briggs (Mal McMillan) Outline Background Recap 25 year altimetry record Recap Measuring surface elevation with altimetry Measuring surface elevation
Ice sheet mass balance from satellite altimetry Kate Briggs (Mal McMillan) Outline Background Recap 25 year altimetry record Recap Measuring surface elevation with altimetry Measuring surface elevation
Interpretation of Polar-orbiting Satellite Observations. Atmospheric Instrumentation
 Interpretation of Polar-orbiting Satellite Observations Outline Polar-Orbiting Observations: Review of Polar-Orbiting Satellite Systems Overview of Currently Active Satellites / Sensors Overview of Sensor
Examining the Terrestrial Planets (Chapter 20)
") GEOLOGY 306 Laboratory Instructor: TERRY J. BOROUGHS NAME: Examining the Terrestrial Planets (Chapter 20) For this assignment you will require: a calculator, colored pencils, a metric ruler, and your geology
GEOLOGY 306 Laboratory Instructor: TERRY J. BOROUGHS NAME: Examining the Terrestrial Planets (Chapter 20) For this assignment you will require: a calculator, colored pencils, a metric ruler, and your geology
Radar Remote Sensing: Monitoring Ground Deformations and Geohazards from Space
 Radar Remote Sensing: Monitoring Ground Deformations and Geohazards from Space Xiaoli Ding Department of Land Surveying and Geo-Informatics The Hong Kong Polytechnic University A Question 100 km 100 km
SAMPLE PAGE. pulses. The Ice Age By: Sue Peterson
 Page 61 Objective sight words (pulses, intermittent, isotopes, chronicle, methane, tectonic plates, volcanism, configurations, land-locked, erratic); concepts (geological evidence and specific terminology
An image-enhanced DEM of the Greenland ice sheet
 Annals of Glaciology 34 2002 # International Glaciological Society An image-enhanced DEM of the Greenland ice sheet Ted A. Scambos, Terry Haran National Snow and Ice Data Center, CIRES, University of Colorado,
GSA DATA REPOSITORY Sternai et al. 1. Algorithm Flow Chart
 GSA DATA REPOSITORY 2012311 Sternai et al. 1. Algorithm Flow Chart Figure DR1: Flow chart of the algorithm to further clarify the calculation scheme. 2. Reconstruction of the Pre-Glacial Alpine Topography
General Overview and Facts about the Irobland
 Using Geoinformation Science to Reveal the Impact of the Eritrea-Ethiopia Boundary Commission s Decision on Irobland and People By Alema Tesfaye, Washington DC, USA Part I General Overview and Facts about
CryoSat-2: A new perspective on Antarctica
 CryoSat-2: A new perspective on Antarctica K. Briggs 1, R. Cullen 2, L. Foresta 3, R. Francis 2, A. Hogg 1, M. McMillan 1, A. Muir 4, N. Galin 4, L. Gilbert 4, N. Gourmelen 3, A. Ridout 4, A. Shepherd
HY-2A Satellite User s Guide
 National Satellite Ocean Application Service 2013-5-16 Document Change Record Revision Date Changed Pages/Paragraphs Edit Description i Contents 1 Introduction to HY-2 Satellite... 1 2 HY-2 satellite data
Remote Sensing of SWE in Canada
 Remote Sensing of SWE in Canada Anne Walker Climate Research Division, Environment Canada Polar Snowfall Hydrology Mission Workshop, June 26-28, 2007 Satellite Remote Sensing Snow Cover Optical -- Snow
GROUND SURFACE VISUALIZATION USING RED RELIEF IMAGE MAP FOR A VARIETY OF MAP SCALES
 GROUND SURFACE VISUALIZATION USING RED RELIEF IMAGE MAP FOR A VARIETY OF MAP SCALES T. Chiba a, B. Hasi a * a Asia Air Survey Co., Ltd., Kawasaki, Japan (has.baator, ta.chiba,)@ajiko.co.jp Commission II,
Landscape. Review Note Cards
 Landscape Review Note Cards Last Ice Age Pleistocene Epoch that occurred about 22,000 Years ago Glacier A large, long lasting mass of ice which forms on land and moves downhill because of gravity. Continental
Interferometric Synthetic Aperture Radar (InSAR) and GGOS. Andrea Donnellan NASA/JPL February 21, 2007
 and GGOS. Andrea Donnellan NASA/JPL February 21, 2007") Interferometric Synthetic Aperture Radar (InSAR) and GGOS Andrea Donnellan NASA/JPL February 21, 2007 Sources for Science Objectives Fourth component of EarthScope Involvement: NSF, NASA, USGS, Universities
Interferometric Synthetic Aperture Radar (InSAR) and GGOS Andrea Donnellan NASA/JPL February 21, 2007 Sources for Science Objectives Fourth component of EarthScope Involvement: NSF, NASA, USGS, Universities
Applications of GIS in assessing Coastal Change Rachel Hehre November 30, 2004 NRS 509 OVERVIEW
 Applications of GIS in assessing Coastal Change Rachel Hehre November 30, 2004 NRS 509 OVERVIEW ITRODUCTION Due to the dynamic nature of coastal systems, representing coastal change with precision and
thesis_kokshoorn:thesis :47 Pagina 65 5 the sierra del Cadí
 5 the sierra del Cadí thesis_kokshoorn:thesis 31-10-2008 9:48 Pagina 67 the sierra del cadí in the chapters 6, 7 and 8 new data on the land snail species Abida secale (draparnaud, 1801) are presented.
Harnessing the Power of Earth System Science for Developing Science Practices and Crosscutting Concepts
 Harnessing the Power of Earth System Science for Developing Science Practices and Crosscutting Concepts Roberta Johnson, Richard Jones, Joe Monaco, Wendy Van Norden, Michael Passow, National Earth Science
POLAR I.C.E. (Interactive Climate Education) REMOTE SENSING: USING RADAR TO LOOK THROUGH ICE
 REMOTE SENSING: USING RADAR TO LOOK THROUGH ICE") POLAR I.C.E. (Interactive Climate Education) REMOTE SENSING: USING RADAR TO LOOK THROUGH ICE BUILD A 3D MODEL OF THE LANDSCAPE THAT LIES UNDER THE ICE! INTRODUCTION: It is hard to believe that melting
POLAR I.C.E. (Interactive Climate Education) REMOTE SENSING: USING RADAR TO LOOK THROUGH ICE BUILD A 3D MODEL OF THE LANDSCAPE THAT LIES UNDER THE ICE! INTRODUCTION: It is hard to believe that melting
ECVs: What s operational and what still requires R&D?
 Glaciers_cci input on ECVs: What s operational and what still requires R&D? Frank Paul* Department of Geography, University of Zurich *on behalf of the Glaciers_cci consortium Google Earth Operational
The 3D Elevation Program: Overview. Jason Stoker USGS National Geospatial Program ESRI 2015 UC
 + The 3D Elevation Program: Overview Jason Stoker USGS National Geospatial Program ESRI 2015 UC + 2 A little history USGS has a long, proud tradition of mapmaking (2009) + 3 The changing times Mapping
Brita Horlings
 Knut Christianson Brita Horlings brita2@uw.edu https://courses.washington.edu/ess431/ Natural Occurrences of Ice: Distribution and environmental factors of seasonal snow, sea ice, glaciers and permafrost
GLAS Validation Plan
 GLAS Validation Plan Version 0.1 April 1998 Prepared by GLAS Science Team Contact: Bob E. Schutz Center for Space Research University of Texas at Austin Austin, TX 78712 schutz@csr.utexas.edu Ph: 512-471-4267
Digital Elevation Models (DEM) / DTM
 / DTM") Digital Elevation Models (DEM) / DTM Uses in remote sensing: queries and analysis, 3D visualisation, layers in classification Fogo Island, Cape Verde Republic ASTER DEM / image Banks Peninsula, Christchurch,
Digital Elevation Models (DEM) / DTM Uses in remote sensing: queries and analysis, 3D visualisation, layers in classification Fogo Island, Cape Verde Republic ASTER DEM / image Banks Peninsula, Christchurch,
Topographical Change Monitoring for Susceptible Landslide Area Determination by Using Multi-Date Digital Terrain Models and LiDAR
 Topographical Change Monitoring for Susceptible Landslide Area Determination by Using Multi-Date Digital Terrain Models and Chanist PRASERTBURANAKUL 1, Parkorn SUWANICH 2, Kanchana NAKHAPAKORN 3, and Sukit
Image 1: Earth from space
 Image 1: Earth from space Credit: NASA Spacecraft: Apollo 17 Sensor: camera using visible light Image date: December 7, 1972 This image is a photograph of Earth taken by Harrison "Jack" Schmitt, an astronaut
Digital Elevation Models (DEM) / DTM
 / DTM") Digital Elevation Models (DEM) / DTM Uses in remote sensing: queries and analysis, 3D visualisation, classification input Fogo Island, Cape Verde Republic ASTER DEM / image Banks Peninsula, Christchurch,
Digital Elevation Models (DEM) / DTM Uses in remote sensing: queries and analysis, 3D visualisation, classification input Fogo Island, Cape Verde Republic ASTER DEM / image Banks Peninsula, Christchurch,
Robotic Site Survey for ISRU
 NASA Ames Research Center Maria Bualat Intelligent Robotics Group Maria.Bualat@nasa.gov Outline Site Survey Overview GPR Survey Hydrogen Prospecting 2 Human-Robot Site Survey Project Systematic survey
NSIDC Distributed ICESat GLAS Laser Operations Periods: Latest Release
 Notes Laser 1A Laser 1B Laser 2A Laser 2A Laser 2A Laser 2B Laser 2C Laser 3A Laser 3B Laser 3C Laser 3D Laser 3E Laser 3F Laser 3G Laser 3H Laser 3I Laser 3J Laser 3K Laser 2D Laser 2E Laser 2F NSIDC
Mapping Earth. Technology and Mapmaking
 CHAPTER 1 LESSON 2 Mapping Earth Technology and Mapmaking Key Concepts What can a topographic map tell you about the shape of Earth s surface? What can you learn from geologic maps about the rocks near
Change detection at the recently erupted Te Maari crater, Tongariro, from stereo aerial photographs
 Change detection at the recently erupted Te Maari crater, Tongariro, from stereo aerial photographs Strong, D.T., Jones, K.E., Ashraf, S. and Lee, J. Outline Geographic context Setting and eruption Science
PHASE 1 STUDIES UPDATE EROSION WORKING GROUP
 PHASE 1 STUDIES UPDATE EROSION WORKING GROUP Presented By MICHAEL WOLFF, PG Erosion Study Area Manager West Valley Demonstration Project Quarterly Public Meeting February 24, 2016 OUTLINE Study 1 Terrain
Spectral Albedos. a: dry snow. b: wet new snow. c: melting old snow. a: cold MY ice. b: melting MY ice. d: frozen pond. c: melting FY white ice
 Spectral Albedos a: dry snow b: wet new snow a: cold MY ice c: melting old snow b: melting MY ice d: frozen pond c: melting FY white ice d: melting FY blue ice e: early MY pond e: ageing ponds Extinction
Remote Sensing. Ice and Snow
 Remote Sensing of Ice and Snow Remote Sensing of Ice and Snow DOROTHY K. HALL JAROSLAV MARTINEC London N ew York CHAPMAN AND HALL First published in 1985 by Chapman and Hall Ltd 11 New Fetter Lane, London
ENVIRONMENTAL GEOSCIENCE UNIFORM SYLLABUS
 ENVIRONMENTAL GEOSCIENCE UNIFORM SYLLABUS The Association of Professional Engineers and Geoscientists of the Province of British Columbia Note: 1. This Syllabus May Be Subject To Change 2. These Courses
S3-A Land and Sea Ice Cyclic Performance Report. Cycle No Start date: 30/09/2017. End date: 27/10/2017
 PREPARATION AND OPERATIONS OF THE MISSION PERFORMANCE CENTRE (MPC) FOR THE COPERNICUS SENTINEL-3 MISSION Start date: 30/09/2017 End date: 27/10/2017 Ref. S3MPC.UCL.PR.08-023 Contract: 4000111836/14/I-LG
Topographic Maps Lab 1
 Topographic Maps Lab 1 I. Objectives 1. Construct a material model of typical terrain found in a landscape. 2. Construct a topographic map corresponding to the terrain model. 3. Learn how to interpret
Glacial Modification of Terrain
 Glacial Modification Part I Stupendous glaciers and crystal snowflakes -- every form of animate or inanimate existence leaves its impress upon the soul of man. 1 -Orison Swett Marden Glacial Modification
Development and Testing of Polar WRF *
 Development and Testing of Polar WRF * David H. Bromwich, Keith M. Hines and Le-Sheng Bai Polar Meteorology Group Byrd Polar Research Center The Ohio State University Columbus, Ohio *Supported by NSF,
Earth s Continents and Seafloors. GEOL100 Physical Geology Ray Rector - Instructor
 Earth s Continents and Seafloors GEOL100 Physical Geology Ray Rector - Instructor OCEAN BASINS and CONTINENTAL PLATFORMS Key Concepts I. Earth s rocky surface covered by of two types of crust Dense, thin,
AN EVALUATION ON THE DATA QUALITY OF SRTM DEM AT THE ALPINE AND PLATEAU AREA, NORTH-WESTERN OF CHINA
 AN EVALUATION ON THE DATA QUALITY OF SRTM DEM AT THE ALPINE AND PLATEAU AREA, NORTH-WESTERN OF CHINA Y. Liu School of Earth and Environmental Sciences, Lanzhou University, Lanzhou, 730000 -liuy@lzu.edu.cn
The Importance of Accurate Altimetry in AEM Surveys for Land Management
 The Importance of Accurate Altimetry in AEM Surveys for Land Management Ross Brodie Geoscience Australia ross.c.brodie@ga.gov.au Richard Lane Geoscience Australia richard.lane@ga.gov.au SUMMARY Airborne
Pan-Arctic Digital Elevation Map (Pan-Arctic DEM)
") Memorandum to CAFF Board 07/28/2017 BACKGROUND: Pan-Arctic Digital Elevation Map (Pan-Arctic DEM) ArcticDEM is a National Geospatial-Intelligence Agency (NGA)-National Science Foundation (NSF) publicprivate
Memorandum to CAFF Board 07/28/2017 BACKGROUND: Pan-Arctic Digital Elevation Map (Pan-Arctic DEM) ArcticDEM is a National Geospatial-Intelligence Agency (NGA)-National Science Foundation (NSF) publicprivate
S3 Product Notice Altimetry
 S3 Product Notice Altimetry Mission Sensor Product S3-A SRAL / MWR LAND L2 NRT, STC and NTC Product Notice ID Issue/Rev Date Version 1.0 Preparation S3A.PN-STM-L2L.06 04-April-2018 This Product Notice
OZ SEEBASE TM. Datasets. Digital Elevation Model
 Digital Elevation Model 10 Digital Elevation Models (DEM s) often show the youngest structures, and any active geological structures. They are widely used for neotectonic analysis. The composition of eroding