Probabilistic modeling of tephra dispersion: hazard assessment of a multi-phase eruption at Tarawera Volcano, New Zealand
|
|
|
- Barry Fowler
- 6 years ago
- Views:
Transcription
1 Probabilistic modeling of tephra dispersion: hazard assessment of a multi-phase eruption at Tarawera Volcano, New Zealand C. Bonadonna 1, C.B. Connor 2, B.F. Houghton 1, L. Connor 2, M. Byrne 3, A. Laing 3, T.K. Hincks 4 1 Department of Geology and Geophysics, University of Hawaii, Honolulu, HI 96822, USA 2 Department of Geology, University of South Florida, Tampa, FL 33620, USA 3 Department of Geography, University of South Florida, Tampa, FL 33620, USA 4 Department of Earth Sciences, University of Bristol, Bristol, BS8 1RJ, UK
2 Abstract The Tarawera Volcanic Complex (New Zealand) comprises 11 rhyolite domes formed during five maor eruptions between BC and AD 1886, the first four of which were predominantly rhyolitic. The only historical event (AD 1886) erupted about 2 km 3 of purely basaltic tephra fall killing about 150 people. The AD 1305 Kaharoa eruption is the youngest rhyolitic event and erupted a total tephra-fall volume more than two times larger than the AD 1886 eruption. We used data from the AD 1305 Kaharoa eruption to assess the tephra-fall hazard from a future episode at Tarawera. This eruption consisted of a complex sequence of eruptive events with eleven discrete Plinian episodes, characterized by VEI 4. We developed an advection-diffusion model (TEPHRA) that includes grainsize-dependent diffusion law and particle density, a stratified atmosphere, the horizontal diffusion time of particles within the eruptive plume and settling velocities that account for Reynold s Number variations along the particle traectory. Selected eruption parameters are sampled stochastically, possible outcomes are analyzed probabilistically and simulations are run in parallel on multiple processors. Given the fast computational times, TEPHRA is also characterized by a robust algorithm and high resolution and reliability of resulting outputs (i.e. hazard maps). Therefore, TEPHRA is an example of a class of numerical models that take advantage of new computational tools to forecast hazards as conditional probabilities far in advance of future eruptions. Three different scenarios were investigated on a probabilistic basis for a comprehensive tephra-fall hazard assessment: Upper Limit Scenario, Eruption-Range Scenario and Multiple-Eruption Scenario. 2
3 1. Introduction Numerical models are increasingly important in geological hazards and risk assessments [Barberi et al., 1990; Bonadonna et al., 2002a; Connor et al., 2001; Glaze and Self, 1991; Hill et al., 1998; Iverson et al., 1998; Wadge et al., 1998]. These models are used to quantify assessments that are otherwise based on qualitative, sometimes disparate geological observations [Newhall and Hoblitt, 2002]. Numerical simulations (i) augment direct observations; (ii) characterize better the variation and uncertainty in geologic processes that often occur on long time scales, or infrequently, compared with the time scales of human experience; (iii) allow volcanologists to explore a much wider range of geological processes than is possible to observe directly. Therefore, evaluating the range of possible outcomes of geologic processes, such as earthquakes, volcanic eruptions, and landslides, is best achieved using probabilistic techniques that propagate uncertainty through the analysis using stochastic simulations. This is certainly true in volcanology, a field in which hazard assessments must strive to bound the range of possible consequences of volcanic activity, drawing from the geologic record, analogy, and understanding of the physics of volcanic processes. Historically, volcanology has advanced through description of volcanic processes and their impacts (e.g. Vesuvius, [Maulucci Vivolo, 1994]; Mt Pelee, [Lacroix, 1904]; Nevado del Ruiz, [Chung, 1991]). While extremely important, this approach is no longer sufficient for mitigation of volcanic risks and numerical simulations should be used to complement direct observations. However, such an approach is computationally expensive, because numerical models of geologic processes are generally complex, and because a large number of simulations is required to accurately simulate the range of behaviors of natural phenomena, like volcanic eruptions. Nevertheless, recent advances in parallel computing, such as the development of the Message Passing Interface (MPI) and the advent of inexpensive computer clusters [Sterling et al., 1999], render this approach to geological hazard assessment tractable. As a practical example, we describe the probabilistic assessment of hazards related to dispersion and accumulation of volcanic tephra fall, and, in particular, we 3
4 present the tephra-fall hazard assessment of Tarawera Volcano (New Zealand) based on its most recent rhyolitic Plinian eruption (AD 1305 Kaharoa eruption, [Sahetapy-Engel, 2002]). Tarawera Volcano is located in the North Island of New Zealand and has been one of New Zealand s most destructive volcanoes in recent times. Famous for its large eruption in 1886, Tarawera Volcano buried seven villages, killing about 150 people [Keam, 1988]. The AD 1305 Kaharoa eruption produced a total tephra-fall volume nearly three times larger than the AD 1886 eruption, covering a wider area northwest and southeast of the volcano, and therefore we consider it as the appropriate scenario for our hazard assessment of tephra fall from Tarawera Volcano. Based on the frequency of past eruptions from this volcano complex, the annual probability of an eruption from Tarawera with volume exceeding 0.5 km 3 is approximately 10-3 /yr [Stirling and Wilson, 2002], certainly a sufficiently high probability to require assessment of eruption consequences [Woo, 2000]. This tephra-fall hazard assessment is achieved through implementation of an advection-diffusion model (TEPHRA) derived from the integration of several modeling approaches and theories [Armienti et al., 1988; Bonadonna et al., 1998; Bonadonna et al., 2002a; Bonadonna and Phillips, 2003; Bursik et al., 1992a; Connor et al., 2001; Macedonio et al., 1988; Suzuki, 1983]. TEPHRA is written for parallel computation on a Beowulf cluster, a networked set of personal computers. As such, TEPHRA is an example of a class of numerical models that take advantage of new computational tools to forecast hazards as conditional probabilities far in advance of future eruptions. That is, given that a scenario of volcanic activity takes place, what is the expected range of tephra-fall thicknesses over a region of interest? What drives uncertainty in hazard assessment? What eruptive conditions result in hazardous tephra-fall accumulations? Our goal is to illustrate how numerical models, like TEPHRA, can help resolve such questions and provide a basis for improved hazard assessment. 2. Geological setting The Tarawera Volcanic Complex is a dome complex within the Okataina Volcanic Centre, one of the five maor calderas within the Taupo Volcanic Zone, North 4
5 Island, New Zealand (Fig. 1). Tarawera is made of 11 rhyolite domes and a combination of tephra-fall and flow deposits that formed during five maor eruptions [Cole, 1970]: (i) AD 1886; (ii) Kaharoa, AD 1305; (iii) Waiohau, BP; (iv) Rerewhakaaitu, BP; (v) eruption associated with the Okareka Ash, BP. The AD 1886 subplinian eruption was basaltic. The most recent rhyolitic eruption occurred about 700 years ago (Kaharoa eruption), and has been intensely studied in the last 5 years [Nairn, 1989; Nairn et al., 2001; Sahetapy-Engel, 2002]. 2.1 AD 1305 Kaharoa eruption The AD 1305 Kaharoa eruption represents the most recent rhyolitic event in the whole Taupo Volcano Zone. It consisted of a sequence of 11 Plinian eruptive episodes with Volcano Explosivity Index (VEI) 4, column heights between about 16 and 26 km, and volumes between about 0.2 and 1 km 3 (minimum total volume is 4.6 km 3, 2.2 Dense Rock Equivalent, DRE) [Sahetapy-Engel, 2002]. Sahetapy-Engel [2002] divides the Kaharoa tephra-fall stratigraphy in two main deposit lobes: one to the southeast and one to the north-northwest of the volcano (Fig. 2). Detailed study of these lobes also revealed pronounced layering of fall deposits, which were classified as Units A to L corresponding to the 11 Plinian eruptive episodes [Sahetapy-Engel, 2002]. The Kaharoa eruption was characterized by multiple vents, but the exact location of eruptive vents for each Unit is still uncertain. By extrapolations of the axes of dispersal and clast size distribution Sahetapy-Engel [2002] concludes that: Units A-G were dispersed to the southeast and were probably erupted from Crater Dome; Unit H was dispersed to both southeast and northwest and was probably erupted from the Ruawahia Dome; Units I-K were dispersed to the north-northwest and were also probably erupted from the Ruawahia Dome and/or Wahanga Dome (Fig. 1). Unit F is the one characterized by the largest volume (minimum volume of 1 km 3 ) and highest plume (26.4 km), whereas Units A and G have the smallest volume (minimum volume of 0.16 km 3 ) and lowest plumes (16.3 km). Unit K is the most voluminous phase of the late stage of the eruption (0.79 km 3 ) [Sahetapy-Engel, 2002]. 5
6 The average density of analyzed pumice and lithic fragments is 1000 and 2350 kg m -3 respectively, whereas the average bulk deposit density is 1000 kg m -3 [Sahetapy- Engel, 2002]. High pumice density values are due to the high crystal content and low vesicularity. An average maximum wind speed of m s -1 and a duration of 2-6 hours for individual eruptive episodes (with the only exception being 19 hours for episode K) were calculated by using the method of Carey and Sparks [1986] and Sparks [1986] [Sahetapy-Engel, 2002]. Studying the wind-field patterns throughout a whole year, Sahetapy-Engel [2002] shows how it is likely that the whole Kaharoa eruption had a maximum duration of the first explosive phase (episodes A-G) of 13 days. Estimates of the duration of the total Kaharoa eruption vary between weeks to a few months, depending on the values assigned to breaks in the eruption and the duration of dome growth and disruption [Sahetapy- Engel, 2002]. 3. TEPHRA TEPHRA consists of three main parts: (i) a physical model that describes diffusion, transport and sedimentation of volcanic particles [Armienti et al., 1988; Bonadonna et al., 1998; Bonadonna et al., 2002a; Bursik et al., 1992a; Connor et al., 2001; Suzuki, 1983]; (ii) a probabilistic approach used to identify a range of input parameters for the physical model (i.e. column height; eruption duration; mass distribution parameter; clast exit velocity; grainsize parameters) and to forecast a range of possible outcomes (i.e. hazard curves and probability maps); (iii) a computational approach that uses parallel processing methods to speed up computation and make fully probabilistic approaches practical. 3.1 Physical model TEPHRA is written in C with MPI commands. Particle diffusion, advection and sedimentation are computed solving a mass-conservation equation [Armienti et al., 1988; Suzuki, 1983]. Particles of size fraction are released from a point source i along a 6
7 volcanic plume. Each particle size fraction,, and point source i is processed independently due to the linearity of the equation. That is, the total mass eruption is: o M (kg) of the M o H max M (1) i0 min o i, o where M i, (kg) is the total mass fraction of particles with size that fall from a point source i at a height z i, H is the total height of the volcanic plume and min and max indicate the maximum and minimum particle diameter respectively (with = -log 2 d, o where d is the particle diameter in mm). The fraction of M i, (kg) that accumulates on the ground at a certain point with coordinates (x,y) is ( x, ) m i, y (kg m -2 ), where: m ( x, y) M f ( x, y) (2) 0 i, i, i, where f i, ( x, y) (m -2 ) is a function, described in detail in the following, that uses an advection-diffusion equation to estimate the fraction of mass of a given particle size and release height to fall around the point with coordinates (x,y). Therefore, the total mass M accumulated per unit area (kg m -2 ) at a certain point on the ground (x,y) is: H max M ( xy, ) m ( xy, ) (3) i0 min i, which is the quantity of greatest interest in forecasting volcanic hazards related to tephra fall. Thus, the problem reduces to understanding the function, ( x, ), which controls o the horizontal dispersion of particles, and M i,, the source term. f i, y 7
8 All the particles are released instantaneously [Bonadonna et al., 2002a; Connor et al., 2001; Suzuki, 1983] and are assumed to be spherical [Bonadonna et al., 2002a] with a settling velocity that varies according to the particle Reynolds number [Bonadonna et al., 1998]. The atmosphere is divided into horizontal layers characterized by a uniform horizontal wind velocity and direction specific for each layer [Bonadonna et al., 2002a]. Each point source i is located in a horizontal layer, and particles released from that point source are initially transported by the wind specific for that layer, until they fall into a lower layer, where they are affected by a different wind direction and velocity. This process continues until the particles reach the ground. For emission from an instantaneous point source, the analytical solution of the mass-conservation equation is a Gaussian distribution of concentration in both the x and y directions [Bonadonna et al., 2002a; Connor et al., 2001]. Particles spread horizontally due to the combined effects of turbulent eddy diffusion and gravity spreading of the plume, and are transported by the wind for the time t spent in each layer. t is a function of the settling velocity v of the particles and the layer thickness z z (with t ). After the time t v, the centre of the Gaussian distribution is shifted in the x y plane by a distance x wxt and y wyt on the axes x and y respectively, where w x and w y are the horizontal components of the wind speed in that layer. Particles falling from a point source i located at x, y, z reach the ground at the i i i time t i,, where: t i, z i t (4) layers v Therefore, the analytical solution of the mass-conservation equation can be written as: 8
9 1 fi, ( x, y) exp 2 i, 2 x xi, y y 2 i, i, 2 (5) where x i, and i y, are the coordinates of the center of the bivariate Gaussian distribution ( x i, xi x, y i, yi y ) and 2 i, is the variance of the layers Gaussian distribution, which is controlled by atmospheric diffusion and horizontal spreading of the plume [Suzuki, 1983]. layers Atmospheric diffusion 2 The parameter controls diffusion of particles in the atmosphere. Effectively, i, the use of in eq. (1) lumps complex plume and atmospheric processes into a single 2 i, parameter. This greatly simplifies the model, making it much easier to implement but also ignores processes that can affect tephra-fall dispersion. For example, the diffusion coefficient is likely scale dependent and varies with barometric pressure in the atmosphere [Hanna et al., 1982]. Such factors are not considered in the model. Atmospheric turbulence is a second order effect for coarse particles, and several models for tephra-fall dispersal are based on the assumption that the atmospheric turbulence is negligible [Bonadonna and Phillips, 2003; Bursik et al., 1992b; Sparks et al., 1992]. However, if the fall time of particles is large, for example for ash-sized particles, atmospheric turbulence may not be negligible [Bursik et al., 1992a; Suzuki, 1983]. In the case of small particle-fall time, t i,, the diffusion is linear (Fick's law), and 2 the variance is [Suzuki, 1983]: i, 2 ' i, 4K ti, ti (6) 9
10 where K (m 2 s -1 ) is a constant diffusion coefficient, t i, (s) is the total particle fall time (eq. (4)), and t ' i (s) is the horizontal diffusion time in the volcanic plume. The horizontal diffusion coefficient, K, is considered isotropic (K=K x =K y ) [Armienti et al., 1988; Bonadonna et al., 2002a; Connor et al., 2001; Suzuki, 1983]. The vertical diffusion coefficient is small above 500 m of altitude [Pasquill, 1974], and therefore is assumed to be negligible. The horizontal diffusion time, t ' i, accounts for the change in width of the plume as a function of height. Change in width of the ascending turbulent plume is complex [Ernst et al., 1996; Woods, 1995] and also includes the gravitational spreading should the plume reach neutral buoyancy [Sparks, 1986]. Such a change in plume width simply adds to the dispersion of tephra fall, and so can be expressed as t ' i [Suzuki, 1983]. Here, we approximate the radius, r i, of the spreading plume at a given height, z i, with the relation developed by [Bonadonna and Phillips, 2003] and based on the combination of numerical studies [Morton et al., 1956] and observations of plume expansion [Sparks and Wilson, 1982]: ri 0.34zi. Thus, taking ri 3 p, where p is the standard deviation of the Gaussian distribution of the mass in the ascending plume [Sparks et al., 1997; Suzuki, 1983], we have: t 2 0.2zi (7) ' 2 5 i We also assume that t ' i does not depend on grainsize. However, Fig. 3a and Fig. 3b show how t ' i significantly affects the total fall time of coarse particle, i.e. ' ( ti, ti), because for coarse particles. ' t i t i, When the particle fall is of a time scale of hours, the scale of turbulent structures that carry particles (and then K ) increases with time. As an example, particles with diameter <1 mm falling from a 30 km-high plume will have an average time of fall >1 hour (based on their particle settling velocity). In this case the variance 2 i, can be empirically determined as [Suzuki, 1983]: 10
11 2 8C ' 2.5 i, t i, t i (8) 5 where C is a constant empirically determined ( C =0.04 m 2 s -1 ; [Suzuki, 1983]). Therefore, once particles leave the bottom of the turbulent current, they must experience different types of turbulent diffusion depending on their size. The linear diffusion described by eq. (6) strongly depends on the choice of the diffusion coefficient, whereas in the power-law diffusion described by eq. (8) the diffusion coefficient is calculated on the basis of the apparent eddy diffusivity and the time of particle fall [Suzuki, 1983]. Some advection-diffusion models consider only one diffusivity law [Bonadonna et al., 2002a; Connor et al., 2001]. TEPHRA accounts for two types of diffusivity law according to particle size: linear diffusion for ash-sized particles (Fick's law; eq. (6)) and power-law diffusion for coarse particles (eq. (8)). If the volcanic plume is sufficiently high, specific particles will experience a shift in diffusion law during fall due to the decrease in fall time (e.g. particles with diameter = 0.25 mm; Fig. 3c). The transition from one diffusion law to another (eq. (6) to eq. (8)) is not well defined based on theory but can be determined empirically. Fig. 3c shows the power-law dependence of with time, which makes the total diffusion more significant for fine particles. 2 i, Settling velocity The settling velocity v of falling particles of size is obtained by the balance between gravity and air drag: v 4gd p (9) 3C D a where g is the gravitational acceleration (m s -2 ), d is the particle diameter (m), the particle density (kg m -3 ), C D is the drag coefficient and p is a is the air density (kg m -3 ). 11
12 The drag coefficient is a function of the particle shape and the Reynolds number, dav Re, where is the air viscosity [kg m -1 s -1 ]. For non-spherical particles the determination of C D is very complicated [Kunii and Levenspiel, 1969], therefore models for tephra-fall dispersal are typically based on the assumptions of spherical particles for which C D can be determined using simple empirical expressions [Bonadonna et al., 1998; Bursik et al., 1992a; Bursik et al., 1992b; Koyaguchi and Ohno, 2001a; Sparks et al., 1992]. Studies have shown that particle-settling velocities strongly depend on particle shape [e.g. [Armienti et al., 1988; Macedonio et al., 1988; Wilson and Huang, 1979], but given the current uncertainties in the determination of particle shape from field data [Chhabra et al., 1999], we have decided to adopt the assumption of spherical particles until new techniques are made available, and therefore to use the analytic expressions for v from Kunii and Levenspiel [1969] and modified by Bonadonna and Phillips [2003] Mass distribution o The source term, M i,, represents the distribution of mass as a function of particle size and height in the eruption column. Several methods have been used to describe particle distribution in the ascending volcanic plume [Bonadonna et al., 2002a; Sparks and Walker, 1977; Suzuki, 1983; Woods, 1988]. Here we modify the method proposed by Suzuki [1983] in which mass is assumed to have an exponential distribution in the plume as a function of particle settling velocity and initial bulk velocity at the vent. The probability density function for particle distribution as a function of height in the plume, for a given grainsize, is: wy o ( zi) e p ( z ) vh1 (1 Y) e Y( zi ) Z i Yo p o (10) where is a dimensionless parameter that controls the shape of the distribution function (larger values of place more mass, proportionally, at the top of the volcanic plume; Fig. 4), w o (m s -1 ) is the initial velocity of pyroclasts at the vent, v p (m s -1 ) is the particle 12
13 settling velocity as empirically calculated by Suzuki [1983] to fit data from Wilson and Huang [1979], and: wz ( i ) Y( zi ) v p Y o w v o (11) p zi wz ( i) wo 1 H Large values of, say =1.0, skews p z ) such that most particles are released from Z ( i high in the volcanic plume (Fig. 4a). This corresponds to a strong plume of the type that occurs in Plinian eruptions. Small values of (e.g. = 0.01) result in a much less skewed distribution of p z ). For coarse particles with comparatively high settling Z ( i velocities, p z ) decreases nearly linearly with height in the volcanic plume (Fig. 4b). Z ( i This behavior occurs in weak plumes [Sparks et al., 1997]. Thus, should be adusted based on the type of volcanic eruptions being simulated. o The source term, M,, is then calculated by assuming an eruption grainsize distribution, f ( ) [Suzuki, 1983]: i o o M, p ( z ) f ( ) M (12) i z i Total erupted mass Given a plume height H (m), the total erupted mass empirical power-law equation [Carey and Sigurdsson, 1989]: o M (kg) is derived from an o M dep 4 H 1670 (13) 13
14 where dep (kg m -3 ) is the density of the tephra-fall deposit and (s) is the duration of the sustained phase of the eruption. 3.2 Probabilistic determination of inputs and outputs Inputs Plume height: either an individual plume height H or a range of plume heights can be input in TEPHRA according to the type of eruptive scenario investigated and the type of output result desired: (i) one input value of H, together with one wind profile, is used to compute isomass maps; one input value of H is also used to compute hazard curves and probability maps for the worst-case eruptive episode (i.e. typically the highest plume observed and/or considered possible, i.e. Upper Limit Scenario) that are based on the variability of wind profiles; (ii) a range of input values of H is randomly sampled for the computation of hazard curves and probability maps that account for the variability of eruptive episodes and wind profiles (i.e. Eruption Range Scenario); (iii) a whole set of input values of H is used for the computation of cumulative probability maps (i.e. probability maps computed for a scenario of long-lasting activity (i.e. multiple eruptions) that account for the variability of wind profiles, i.e. Multiple Eruption Scenario). In case (ii) any probability function of H can be sampled. We have decided to randomly sample where H min a uniform set of values that range between Log H min Log H max and H max are, respectively, the minimum and the maximum plume height observed and/or considered possible. We have chosen a logarithmic function of H to reflect a higher frequency of low plumes. As an example the distribution of plume height randomly sampled for a Kaharoa-type eruption is shown (i.e. H =14-26 km; Fig. 5a). The minimum height represents the boundary between subplinian and Plinian eruptions [Sparks et al., 1992] in agreement with the Kaharoa-type events, whereas the maximum height is from field data [Sahetapy-Engel, 2002]. Duration of eruptive episodes: together with the plume height H, the duration of individual eruptive episodes is used for the determination of the total erupted mass (eq. 14
15 (13)). TEPHRA randomly samples the duration amongst a given range of values observed and/or considered possible. As an example the distribution of the eruptiveepisode duration randomly sampled for a Kaharoa-type eruption is shown (i.e. 2-6 hrs; Fig. 5b). Total erupted mass: the distribution of plume-height values described above associated with the randomly sampled distribution of eruptive-episode duration results in a lognormal distribution of the total erupted mass derived using eq. (13) (Fig. 5c). Plume mass distribution ( ): the mass distribution along the eruptive plume is controlled by a factor [Connor et al., 2001; Suzuki, 1983]. We have decided to link to the column height, as larger plumes will be characterized by a larger accumulation of mass at the top. Therefore, for powerful plumes can be calculated as: H H min min (1 min) H max H min (14) where min is the minimum value of considered (Fig. 6a). The maximum value of possible is therefore 1 (i.e. maximum of mass accumulation at the top of the plume). Total grainsize distribution: a grainsize distribution can be defined by expressing the corresponding minimum and the maximum particle diameter, the Median Diameter (Md), the Graphic Standard Deviation ( ) and the Graphic Skewness (SkG) [Inman, 1952]. However, the total grainsize distribution of pyroclastic deposits is typically extremely difficult to determine mainly due to the methodological problems related to the integration of grainsize analysis of single samples and to the scarcity of data points (because of poor outcrop exposure, deposit erosion and/or tephra-fall dispersal in the sea). As a result, only a few total grainsize distributions are available [Carey and Sigurdsson, 1982; Hildreth and Drake, 1992; Sparks et al., 1981; Walker, 1980; Walker, 1981]. Given these uncertainties, we have applied a probabilistic approach also for the 15
16 determination of the total grainsize distribution stochastically sampling Md between values observed and/or considered possible. As an example the distribution of Md randomly sampled for a Kaharoa-type eruption is shown (i.e. Md = -0.8 and 4 ; Fig. 6b). This is based on data from comparable Plinian eruptions: Taupo, Waimihia and Hatepe Plinian [Walker, 1980; Walker, 1981] (Fig. 6c). Particle exit velocity ( w ): the particle velocity at vent is necessary to determine the o probability density function for a given grainsize in the eruptive plume (eq. (10)). However, not many information for this parameter are known, therefore is randomly sampled between m s -1 for powerful eruptions based on theoretical values [Sparks et al., 1997]. Eruptive vent: the Kaharoa eruption was characterized by at least two active eruptive vents possibly three (Crater Dome, Ruawahia Dome and Wahanga Dome; Fig. 1). The presence of multiple active vents is known for several eruptions (e.g. Tolbachik volcano, [Fedotov et al., 1991]; Tarawera AD 1886 [Keam, 1988; Walker et al., 1984]; Rabaul [Blong, 1994]) and can significantly affect the patterns of tephra-fall dispersal. Some single-vent eruptions can also occur in volcanic areas characterized by several possible future vents (e.g. Campi Flegrei [Di Vito et al., 1999]; Mt. Etna [Coltelli et al., 1998]; Michoacàn-Guanauto, [Williams, 1950]). A complete hazard assessment needs to account for all possible eruptive vents. TEPHRA can randomly sample an eruptive vent from a set of vent coordinates considered possible Outputs TEPHRA produces three main outputs: (i) isomass maps, (ii) hazard curves, and (iii) probability maps. Isomass maps describe the accumulation of mass per unit area around the volcano and are computed given one wind profile and one eruptive episode. They are mainly used to calibrate the model and to assess the agreement with field data. However, tephra-fall hazard assessments are based on the compilation of probabilistic outputs, i.e. hazard curves and probability maps. Crucial to a tephra-fall hazard 16
17 assessment, and, in particular, to the interpretation of the probabilistic outputs, are the hazardous deposit thresholds, i.e. values of tephra-fall mass per unit area that cause specific types of damage (e.g. collapse of building roofs, different degrees of damage to vegetation and crops) [Blong, 1984]. Every geographic area is characterized by specific deposit thresholds due to different climate conditions and building structures [Blong, 1984; Bonadonna et al., 2002a]. Hazard curves Hazard curves considered here indicate the probability of exceeding certain values of accumulation of mass per unit area at a particular location [Hill et al., 1998; Stirling and Wilson, 2002]. Hazard curves can be computed considering a set of eruptive episodes and a set of wind profiles. Probability maps Probability maps show the probability of reaching a given mass accumulation per unit area (i.e. hazardous deposit threshold) in a particular location given different sets of conditions. Different types of probability maps can be compiled depending on the specific assessment required (e.g. assessment for a specific locality; assessment for a specific area; assessment for different eruptive scenarios). For our assessment we have compiled: (i) Probability maps given one eruptive episode and a set of wind profiles (Upper Limit Scenario, ULS): given one possible eruptive episode, these maps show the probability distribution of reaching a particular mass loading around the volcano based on the statistical distribution of wind profiles and therefore contour: P M ( x, y) threshold eruption, where all eruption parameters are specified deterministically. This is useful to determine an upper limit value on tephra-fall accumulation if the parameters are specified for the largest reasonable eruption for that particular volcano. (ii) Probability maps given a set of eruptive episodes and a set of wind profiles (Eruption Range Scenario, ERS): given a set of possible eruptive episodes, these maps show the probability distribution of a particular mass loading around the volcano based on the 17
18 statistical distribution of possible eruptive episodes and wind profiles both sampled randomly. These maps contour: PM ( x, y) threshold eruption, where all eruption parameters and wind profiles are both sampled stochastically. The resulting map provides a fully probabilistic hazard assessment for a given volcano. (iii) Cumulative probability maps for a given scenario of activity and a set of wind profiles (Multiple Eruption Scenario, MES): given a scenario of long-lasting activity (i.e. set of eruptive episodes all happening), these maps show the probability distribution of reaching a particular mass loading around the volcano based on the statistical distribution of wind profiles contouring: PM ( x, y) threshold scenario. These maps are important to assess tephra-fall accumulation from multiple-phase eruptions, such as the AD 1305 Kaharoa eruption, and long-lasting eruptions, such as the eruption of Montserrat [Kokelaar, 2002; Sparks and Young, 2002]. These computed probability maps assume continuous tephra-fall accumulation with no erosion between eruptive episodes and are calculated using Monte Carlo simulations based on a random sampling of wind profiles [Bonadonna et al., 2002a]. 3.3 Cluster and parallelization Numerical models used for hazard assessments of natural phenomena are typically conceptually straightforward [Barberi et al., 1990; Bonadonna et al., 2002a; Connor et al., 2001; Hill et al., 1998], but the application of the algorithm is made onerous by the need to execute the same calculations for several grid points (hazard-map resolution) and to run numerous simulations in order to capture uncertainties in the hazard estimates (hazard-map reliability). As an example, probability maps computed on a 450 Pentium III for a 3-year scenario of activity at the Soufrière Hills Volcano (Montserrat, WI) would require roughly 4 days [Bonadonna et al., 2002a]. These long computing times are not ideal when dealing with hazard assessments required during volcanic crisis. As a result, depending on the machine available, map resolution and reliability are often decreased to obtain shorter computational times. Finally, also the algorithm and the initial assumptions are often simplified to speed up the calculations (e.g. assumption of constant atmospheric density and, therefore, constant particle settling velocity [Barberi et al., 1990; Bonadonna et al., 2002a]; assumption of uniform wind 18
19 field [Connor et al., 2001; Hill et al., 1998]; assumption of a single particle diffusion law [Barberi et al., 1990; Bonadonna et al., 2002a; Connor et al., 2001; Hill et al., 1998]) Beowulf cluster TEPHRA was actually born to fulfill the need of: (i) implementation of existing codes [Bonadonna et al., 2002a; Connor et al., 2001], (ii) probabilistic determination of input and output parameters, (iii) improvement of the computational time. Therefore, it was designed for parallel computation on a Beowulf cluster. A Beowulf cluster usually consists of off-the-shelf personal computers connected by Ethernet, running Linux operating system, and the Message Passing Interface (MPI) for parallel work. The idea of using affordable and scalable hardware components for parallel computing is extremely well-suited for handling the repetition required for stochastic simulations of geologic hazards. Our cluster consists of eight desktop computers each containing a 1.5 GHz Pentium IV processor. All machines are equipped with an Ethernet card and linked by Fast Ethernet and 16 port hub. In addition to these eight computers, a server node contains two Ethernet cards that allow communication with both the private Beowulf network and the outside network. The server node functions as both a member of the cluster and as a cluster interface. To avoid repetitious transferring of files and programs to each of the nodes, the cluster s server uses the Network File System (NFS) to share files between the server and nodes. Ease of use of this architecture is facilitated using the Linux operation system (SuSE version 8.0) on the entire cluster Parallel code The Message Passing Interface (MPI) libraries are freely available tools for creating and running C, C++ or Fortran codes in parallel on a cluster of machines, such as the Beowulf cluster described above. These libraries facilitate the message passing between computer nodes and provide the ability to start and stop processes on every node. 19
20 TEPHRA uses this master-slave relationship model. The sole ob of the master process is to orchestrate the computing that will be done by slave processes. When started on the server node, the master process reads in the eruption parameters and the grid dimensions from input files. The master process then starts the slave processes on all of the nodes and decomposes the problem, distributing even portions to the slave processes for computation. Each slave process solves for tephra-fall accumulation for some fraction of the map grid and eruption parameters. When the slave processes are finished, they send their results to the waiting master process and quit. The master process then finishes by outputting the returned results on the cluster s server node. In our parallel implementation, the decomposition of the computational domain is achieved by dividing the grid domain where tephra-fall deposition is to be calculated and the master process distributes a portion of the grid to each slave. Each slave computes the accumulation on its assigned portion and returns the results to the master process. On a homogeneous cluster, one in which each slave process is executing on identical hardware, the computational domain is divided and distributed equally among the identical nodes. Each slave process, one executing on each node, begins and finishes their computations at approximately the same time. This technique, called static decomposition [Geist et al., 1997], works well for solving tephra-fall hazard problems. We have found that the computational efficiency of solving the probabilistic hazard assessment is well worth the effort of parallelizing the code. Speed-up (change in total computational time on the cluster of processors divided by computational time on a single processor) is linear for this type of stochastic simulation. This means that a large number of stochastic simulations can be performed efficiently using widely available computer components. Our experience is that this results in a far more thorough hazard assessment than is otherwise practical. 4. Results 4.1 Calibration 20
21 A series of sensitivity tests were carried out to determine the best values of diffusion coefficient,, fall-time threshold and mass-distribution parameter,. The diffusion coefficient is crucial for the atmospheric diffusion of coarse particles, the falltime threshold determines the cut-off between linear and power-law atmospheric diffusion (eq. (6) and (8)) and determines the mass distribution within the eruptive plume (eq. (10) to eq. (12)). The best fit is determined by calculating the minimum value of the misfit function (mf) keeping two parameters fixed at a time and varying the other one. The misfit function for each ground point with coordinates (x,y) is expressed as: mf M 2 obs Mcomp N N 1, (15) where N is the number of data and M obs (kg m -2 ) and M comp (kg m -2 ) are the observed and computed mass accumulation per unit area respectively [Bonadonna et al., 2002a]. The misfit function is an estimate of the global agreement between observed and computed data, and so comparison between observations and model results was also studied at individual locations. Unfortunately, given the age of the AD 1305 Kaharoa eruption, a complete dataset is not available to thoroughly calibrate the model before hazard curves and maps are computed (i.e. good mass/area data, wind data, total erupted mass, total grainsize distribution). Therefore, sensitivity tests were carried out on a wellstudied eruption from a different volcano in New Zealand: the 17 June 1996 andesitic subplinian eruption of Ruapehu. Such eruption produced at least 5x10 9 kg of tephra fall and the corresponding tephra-fall deposit was sampled and studied in detail [Bonadonna, 2001; BF Houghton, manuscript in preparation, 2003]. The plume was bent over by a strong SE wind and reached a maximum height of 8.5 km above sea level [Prata and Grant, 2001]. Ruapehu (Runs 1 and 2 in Table 1) 21
22 Sensitivity tests carried out on the whole Ruapehu dataset (114 samples) show a best fit for a diffusion coefficient of 200 m 2 s -1, a fall-time threshold of 72 s (i.e hours) and a value of 0.2 (Fig. 7; Runs 1 in Table 1). However, the 17 June 1996 eruption of Ruapehu produced a weak plume, which is characterized by a very different sedimentation dynamics in proximal area compared to strong plumes. Besides, several Ruapehu samples were collected close to the eruptive vent, and advection-diffusion models do not reproduce the proximal deposit very accurately [e.g. Barberi et al., 1990; Bonadonna et al., 2002a]. Therefore, sensitivity tests were also carried out to determine a best fit of values for distal sedimentation (i.e. dataset of 88 samples collected at a distance from vent > 5 km; Runs 2 in Table 1). Fig. 7 shows that the best fit for the distal dataset is obtained for a diffusion coefficient of 600 m 2 s -1, a fall-time threshold of 1080 s (i.e. 0.3 hours) and a value of 0.3. Values of of 0.2 and 0.3 are in agreement with our predictions that weak and strong plumes are characterized by small and large values of respectively. Figs 8a and 8b show the comparison between observed and computed accumulation mass (kg m -2 ) for the best-fit values of diffusion coefficient and fall-time threshold for the total dataset (computed with a diffusion coefficient of 200 m 2 s -1, a falltime threshold of 72 s and a value of 0.2) and for the distal dataset (computed with a diffusion coefficient of 600 m 2 s -1, a fall-time threshold of 1080 s and a value of 0.3). Residual proximal data computed with the best-fit values obtained for the distal dataset (i.e. diffusion coefficient of 600 m 2 s -1, fall-time threshold of 1080 s and a value of 0.3) were also plotted. Data points showing the largest misfit are those points characterized by mass/area> 50 kg m -2 (i.e. mostly proximal points). Kaharoa F (Runs 3 in Table 1) Best-fit values determined for the distal sedimentation of the 17 June 1996 eruption of Ruapehu were also used to compute isomass maps for Tarawera Volcano. Fig. 8c shows the comparison between observed data for the Unit F of the Kaharoa eruption and computed data using the best-fit values obtained for the distal dataset of the Ruapehu eruption (i.e. diffusion coefficient of 600 m 2 s -1 and fall-time threshold of 1080 s; Runs 3 22
23 in Table 1). The best-fit values of determined for the two Ruapehu data sets investigated (i.e. 0.2 and 0.3; Table 1 and Fig. 7) reflect the sedimentation from weak plumes. Given that the Kaharoa F event produced a very powerful plume (H = 26.4 km), we have used = 1 in this simulation. Wind profile was chosen with a direction in agreement with the main axis of dispersal of the Unit F (135 N); maximum wind speed (27 m s -1 ) and column height (26.4 km) were calculated using the method by Carey and Sparks [1986] [Sahetapy-Engel, 2002]; total erupted mass (1.1x10 12 kg) was calculated using the method by Pyle [1989] [Sahetapy-Engel, 2002]; particle density was varied between kg m -3 [Sahetapy-Engel, 2002]; total grainsize distribution was averaged between the Taupo, Waimihia and Hatepe Plinian [Walker, 1980; Walker, 1981] (Fig. 6c). 4.2 Hazard assessment As mentioned above we have based our tephra-fall hazard assessment of Tarawera Volcano on the AD 1305 Kaharoa eruption, and have analyzed three different eruptive scenarios to compile hazard curves and probability maps: Upper Limit Scenario, Eruption Range Scenario and Multiple Eruption Scenario. ERS hazard curves and probability maps were computed stochastically sampling 1000 different eruptions (i.e. Md, column height, eruptive vent,, eruption duration, clast exit velocity), whereas MES probability maps were computed using 100 sets of 10 different eruptions stochastically sampled. ULS hazard curves and probability maps were computed running 1000 eruptions with the highest plume, the longest duration and = 1 (i.e. largest erupted mass released from the top of the plume) and with only Md, clast exit velocity and eruptive vent stochastically sampled. The following Kaharoa-type eruptive parameters were used: Plume height: for the computation of ERS hazard curves and ERS and MES probability maps we have sampled plume heights between Log H min Log H max where H min =14 km and H max =26 km (Fig. 5a). We have also computed ULS hazard curves 23
24 and probability maps for the highest plume determined for the Kaharoa eruption (i.e. 26 km). Duration of eruptive episodes: the duration of eruptive episodes is randomly sampled between 2-6 hours [Sahetapy-Engel, 2002] (Fig. 5b). We have neglected Unit K which has a duration of 19 hours. Plume mass distribution ( ): given that Kaharoa-type plumes are Plinian, we have determined using eq. (14) with (Fig. 6a). min =0.5, so that is made vary between Diffusion coefficient (Ficks law) and diffusion law cut-off: best fit values for the distal deposit produced by the 17 June 1996 eruption of Ruapehu are used for all simulations (i.e. diffusion coefficient = 600 m 2 s -1, diffusion-law cut-off = 1080 s). Grainsize: as mentioned earlier, we have applied a probabilistic approach also for the determination of the total grainsize of a future Kahaora-type eruption. Therefore, we have stochastically sampled Md between -0.8 and 4, keeping the minimum and maximum diameter fixed at -7 and 10, and fixed at 2.5 (Fig. 6b and 6c). Pumice density: density of pumice fragments ( ) is varied between 1000 and 2350 kg m -3 according to the density parameterization used by [Bonadonna and Phillips, 2003] and based on the average measured pumice and lithic density (1000 and 2350 kg m -3 respectively) [Sahetapy-Engel, 2002] (Fig. 10). p Bulk density of the tephra-fall deposit: average measured deposit density ( ) is 1000 kg m -3 [Sahetapy-Engel, 2002]. dep Time break amongst eruptive episodes: given the uncertainties on the total duration of the Kaharoa eruption and the time break between individual eruptive episodes, we have 24
25 decided to sample wind profiles stochastically to compute MES probability maps so that the final convergence value of probability at each grid point is independent from the time break. Eruptive vent: the active eruptive vent is randomly sampled amongst the three Kaharoa eruptive vents (Crater Dome, Ruawahia Dome and Wahanga Dome; Fig. 1). Wind data: the wind field used by TEPHRA is stratified every 1 km. For the Tarawera assessment we have used the gridded zonal and meridional wind fields from the National Centers for Environmental Prediction (NCEP) Reanalysis proect [Kalnay et al., 1996]. Data at 17 pressure levels (1000, 925, 850, 700, 600, 500, 400, 300, 250, 200, 150, 100, 70, 50, 30, 20, and 10 hpa) were interpolated linearly to 30 geopotential height levels at 1 km intervals. Values at each height level represent the average wind velocity of the four grid points surrounding the volcano. We have considered 3 years of wind profiles sampled 4 times a day (00:00; 06:00; 12:00; 18:00 UTC) from 1 January 1996 through 31 December The North Island of New Zealand is in the mid-latitudes (approx.: S, New Zealand Geodetic Datum 2000), therefore, winds usually blow from the west (Fig. 11) and the tropopause heights are approximately 10 km during the winter and 15 km during the summer. Our data (1996 through 1998) also show a significant change in mean wind direction at relatively high altitudes (>25 km above sea level), where winds start blowing mainly from the south (Fig. 11a). The direction that the wind blows towards to varies between about -110 and 180 from North (Fig. 11a), whereas the wind velocity varies between about 2 and 40 m s -1 (Fig. 11b). A detailed analysis of the wind data shows that 86% of wind profiles have at least 15 levels of wind blowing between 0 and 180 from the North, whereas only 3% have at least 15 levels of wind blowing between 180 and 360 from North (Fig. 12a). Wind is more likely to blow between 180 and 360 during the austral spring-summer (i.e. September through March; Fig. 12b). Hazardous deposit thresholds: in our tephra-fall hazard assessment for Tarawera Volcano we have considered hazardous deposit thresholds derived from observations made on 25
26 hazardous effects in New Zealand (D. Johnston, pers. comm.) and for a 1000 kg m -3 deposit density [Sahetapy-Engel, 2002]: 30 kg m -2 (damage to agriculture), 300 kg m -2 (minimum loading for roof collapse), 600 kg m -2 (roof collapse for all buildings). [Blong, 1984] also suggests loadings of 1800 kg m -2 and 2400 kg m -2 as the zone of near total vegetation kill and the zone of total vegetation kill respectively Hazard curves (Runs 4 and 5 in Table 1) Hazard curves were computed for six key cities and towns around Tarawera Volcano: Maketu, Kawerau, Tauranga, Taupo, Rotorua, and Wellington (Fig. 1). The ULS hazard curves show >5% probability of reaching a tephra-fall accumulation of 10 kg m -2 (i.e. ~ 1 cm) in all cities and towns considered except Wellington, which is characterized by very low tephra-fall accumulation for all eruptive conditions considered in this assessment (Fig. 13). The ERS hazard curves do not diverge significantly from the ULS hazard curves and show >5% probability of reaching a tephra-fall accumulation of 10 kg m -2 (i.e. ~1 cm) in all localities considered except Tauranga, Taupo and Wellington. All cities and town considered show <<0.1% probability of reaching the minimum threshold for roof collapse (i.e. 300 kg m -2 ) (Fig. 13) Probability Maps (Runs 6 to 8 in Table 1) In the case where Tarawera Volcano produces a 26 km high plume (ULS maps; Runs 6 in Table 1), Rotorua and the main populated towns northeast of Tarawera Volcano would be likely to receive enough tephra fall to cause significant damage to agriculture (5-65%; Fig. 14a). However, only Kawerau (small town) has a small chance (5-10%) to experience some roof collapse in the case that Tarawera Volcano generates a 26 km high plume (Fig. 14b). In the case where Tarawera Volcano produces a plume ranging between 14 and 26 km (ERS maps; Runs 7 in Table 1), only some populated towns northeast of Tarawera 26
27 would be likely to receive enough tephra fall to cause significant damage to agriculture (5-25%; Fig. 15). Plumes in this height range are not likely to cause roof collapse anywhere on the North Island. If Tarawera Volcano generates a multi-phase eruption characterized by 10 eruptive episodes with plumes ranging between 14 and 26 km (MES maps; Runs 8 in Table 1), the main populated towns northeast of the volcano are likely to receive enough tephra fall to cause damage to agriculture (75-100%; Fig. 16a). Rotorua and Maketu (northwest of the volcano) are also likely to experience damage to agriculture (15-40%; Fig. 16a). Some towns on the northeast (i.e. Kawerau and Te Teko) of the volcano are likely to experience collapse of the weakest buildings (15-50%; Fig. 16b). Kawerau is also likely to experience collapse of even the strongest buildings (5%; the map for 600 kg m -2 is not shown as this specific mass loading would only marginally affect Kawerau) Seasonal variations and climate fluctuations (Runs 9 to 14 in Table 1) The wind data show that winds up to 25 km above sea level in the North Island of New Zealand mainly blow to the northeast-east-southeast (Fig. 11a and 12a). During the austral spring-summer wind can also blow to the northwest-westsouthwest. However, the ULS probability maps computed for a threshold of 30 kg m -2, both for the austral winter (June-August; i.e. wind only to the northeast-east-southeast; Runs 9 in Table 1) and the austral spring-summer (September-March; i.e. some winds also to the northwest-west-southwest; Runs 10 in Table 1) do not diverge significantly (Fig. 17). If Tarawera Volcano produces a 26-km-high plume, Rotorua is more likely to experience damage to agriculture between September-March (about 40%; Fig. 17b), whereas the probability of reaching the threshold of damage to agriculture does not vary significantly for the populated towns northeast of the volcano (20-60%; Fig. 17). As also mentioned above, the North Island of New Zealand is located in the midlatitudes, and therefore is not significantly affected by "El Niño Southern Oscillation 27
28 (ENSO) phenomenon", the maor systematic global climate fluctuation that occurs at the time of an ocean warming event. However, in order to have a comprehensive wind analysis, we have chosen 3 years characterized by the main climate conditions: January 1996 to March 1997 (neutral conditions); April 1997 to May 1998 (strong El Niño); after May 1998 (La Niña). ULS probability maps computed using only wind data from 1996 (i.e. neutral conditions; Runs 11 in Table 1) and wind data only from (i.e. ENSO conditions; Runs 12 in Table 1) do not show significant differences (Figs 18a and 18b). Also ULS probability maps computed using only wind data characterized by strong El Niño (i.e. April 1997 to May 1998; Runs 13 in Table 1) and by La Niña (i.e. after May 1998; Runs 14 in Table 1) do not show significant differences (Figs 18c and 18d). As a conclusion, the winter times are the times when the area west and north-west of Tarawera would be affected the least by a Kaharoa-type eruption, regardless ENSO phenomenon. 5. Discussion TEPHRA results from the combination of different theories and modeling approaches, representing a first step towards the integration of two main classes of tephra-fall dispersal models developed during the last two decades: (i) advectiondiffusion models [Armienti et al., 1988; Bonadonna et al., 2002a; Connor et al., 2001; Glaze and Self, 1991; Macedonio et al., 1988; Suzuki, 1983] and (ii) models describing large-eddy sedimentation from plume margins combined with gravity-driven intrusion of the volcanic current at the neutral buoyancy level [Bonadonna and Phillips, 2003; Bursik et al., 1992a; Bursik et al., 1992b; Ernst et al., 1996; Koyaguchi and Ohno, 2001a; Sparks et al., 1992]. Hazard assessments are typically done using advection-diffusion models, which are mostly empirical but that are designed to compile mass/area and probability maps [Barberi et al., 1990; Bonadonna et al., 2002a; Hill et al., 1998]. The models from the second class are based on classic plume theory and have mainly focused on thoroughly describing the tephra-fall dynamics but have not been used to compile 2D maps due to the more complex theory involved. Eventually these two classes should merge, and TEPHRA can be identified as a first step towards this direction. As an example, 28
29 TEPHRA describes an instantaneous release of particles from the eruptive source, typical of advection-diffusion models [e.g. Armienti et al., 1988], implemented by the horizontal diffusion time, t ' i, that accounts for the change in width of the plume as a function of height (eq. (7)), derived from classic plume theory [Morton et al., 1956]. This results in smaller atmospheric diffusion coefficients (e.g. diffusion coefficient = m 2 s -1 ), given that diffusion coefficients in advection-diffusion models typically account also for the horizontal diffusion of the plume (e.g. diffusion coefficient = 3000 m 2 s -1, Vesuvius [Macedonio et al., 1988]; 6000 m 2 s -1, Ruapehu [Hurst and Turner, 1999]; 2700 m 2 s -1, Montserrat [Bonadonna et al., 2002a]). TEPHRA also better describes tephra fall accounting for the variation of particle Reynold s Number along the particle traectory. TEPHRA is also one of the first dispersal models to account for the variation of diffusion law with particle size: (i) linear-diffusion for coarse particles and (ii) power-law diffusion for fine particles. Atmospheric turbulent diffusion is neglected by most models based on the gravitional spreading of plumes [Bonadonna and Phillips, 2003; Bursik et al., 1992b; Sparks et al., 1992], whereas advection-diffusion models typically account for diffusion of coarse particles only [Armienti et al., 1988; Bonadonna et al., 2002a; Connor et al., 2001], even though the diffusion is thought to be particularly significant for settling of ash-sized particles [Suzuki, 1983; Bursik et al., 1992a]. However, the cut off for diffusion-law decoupling is not yet well characterised and can be only determined empirically (e.g s for the distal tephra-fall from the 17 June 1996 eruption of Ruapehu; Fig. 7). TEPHRA can also account for sedimentation from strong and weak plumes varying the mass-distribution factor. Large values of place more mass, proportionally, at the top of the volcanic plume, simulating more powerful eruptions (Fig. 4). Sensitivity tests done on selected Ruapehu samples show that a weak plume can be simulated using small values of (Runs 1-2; Figs 7 and 8). Distal deposit from this eruption shows a larger best-fit value of than the total deposit, as expected. Unfortunately though, a good data set from a strong-plume deposit is not available to investigate the actual best-fit value for strong plumes. Sensitivity tests done on selected Ruapehu samples show that 29
30 variations of values result in significant variations of mf. As an example an increase of about 100% of thevalue characterized by the minimum mf, results in a variation of about 3% of mf for both the total and the distal data sets of the Ruapehu deposit (Fig. 7c). Sensitivity tests also show that varying the fall-time cut off does not result in a significant variation of mf, whereas varying the diffusion coefficient of about 100% of the initial value has produced a maximum variation of about 45% of the initial mf value (i.e. total data set) (Fig. 7a and 7b). As a conclusion, values for diffusion coefficient and need to be selected more carefully than the fall-time cut off. Model implementations were made possible by the parallelization of the code. In fact, most advection-diffusion models run on single processors and used to compile probability maps require several assumptions in order to reduce the number of calculation and speed up the execution times (e.g. uniform wind field; constant particle-settling velocity; single diffusivity law; constant particle density). TEPHRA does not require many assumptions because the execution times are speed up by the use of multiple processors. Geoscientific problems can be made parallel at a number of levels. The use of TEPHRA for hazard assessment can be defined as embarrassingly parallel because the same calculations are performed independently for a large number of input parameters and for a large number of grid points. Computation is greatly accelerated by dividing the grid points among several different computers and simultaneously performing the calculations on each. Since the solution at one grid point does not depend on the solution at any other grid point, this grid decomposition is straightforward. This type of parallel code is called a "single program - multiple data" model (SPMD), because multiple instances of the same computer code run on multiple processors. In a wellimplemented SPMD problem, computational speed scales with the number of nodes used. Parallelization of the code not only allows the implementation of the model but also allows a fully probabilistic approach to tephra-fall hazard. A stochastic parameter sampling is used to identify a range of input parameters for the physical model (i.e. column height; eruption duration; mass distribution parameter; grainsize distribution; eruptive vent; clast exit velocity). This is important because sometimes different eruptive 30
31 scenarios need to be investigated but also because often these parameters are not well known but can be sampled from probability density functions. The more simulations are done the better the full range of possible outcomes is understood, making the problem inherently parallel because the exact same computations are performed many times on different input data. The tephra-fall hazard assessment of Tarawera Volcano represents a typical situation: Tarawera did not produce several historical eruptions and therefore the data available for model calibration and for the identification of input parameters and eruptive scenarios are not very accurate. Furthermore, Tarawera is characterized by multiple eruptive vents and most eruptions from this volcano are characterized by multiple eruptive phases (e.g. AD 1305 Kaharoa eruption; AD 1886 eruption). Therefore our hazard assessment was based on a fully stochastic sampling of input parameters because most of these parameters are not very well known (i.e. grainsize; clast exit velocity; mass distribution parameter; Fig. 6) but also because different eruptive scenarios need to be investigated (i.e. eruptive vent; plume height; eruption duration; Fig. 5). A probabilistic approach is also used to forecast a range of possible outcomes (i.e. hazard curves and probability maps), so that the probability of exceeding certain hazardous tephra-fall accumulations can be investigated for different eruptive scenarios and a wide area around the eruptive vent (Fig ). The calculation of tephra-fall accumulation on a grid is also inherently parallel because the exact same computations are performed many times for different grid points. TEPHRA describes the particle transport at discrete atmospheric level (e.g. 1 km) accounting for settling-velocity variations (based on particle Reynold s Number variation) and wind variations (i.e. direction and velocity). The accuracy of the resulting hazard assessment is strictly related to the accuracy and number of wind profiles used and weather fluctuations analyzed. The detailed gridded zonal and meridional wind fields downloaded from the NCEP Reanalysis proect allowed a full hazard assessment 31
32 including specific seasonal assessments (Fig. 17) and assessments for particular climate conditions (e.g. ENSO phenomenon; Fig. 18). A good statistical study of wind profiles also help constrain the occurrence time of a given eruption. As an example, Fig. 11 shows that winds below 25 km above sea level around the Tarawera Volcanic Complex blow between N and S with main direction to the E, and winds above 25 km blow between W and E with main direction to the N. Fig. 12 also shows that winds are more likely to blow to the W and N during September through March. Given that the 5 Kaharoa units dispersed to the N and NW were produced consecutively and by plumes smaller than 25 km (i.e. Units H, I, J, K and L; plume height between km [Sahetapy-Engel, 2002]), it is likely that Units H to L were produced during the same austral spring-summer. However, Units A to G were dispersed to the SE and therefore it is more difficult to estimate the corresponding occurrence time, given that winds can blow to the SE during the whole year (Fig. 12). Our probabilistic analysis for the ENSO phenomenon also indicates that the unusual wind conditions that produced the Kaharoa tephra-fall dispersal cannot be explained as en effect of El Niño or La Niña climate fluctuations (Fig. 18). Therefore, based on purely tephra-fall dispersal considerations, we can conclude the whole Kaharoa eruption could have occurred during an austral spring-summer or at least 5 consecutive units are very likely to have occurred during the same austral spring-summer. However, magma-chamber dynamics and volcanic edifice geometry should also be considered in order to assess magma-chamber recharging times and the times required to establish certain eruptive conditions [Melnik, 2000; Pinel and Jaupart, 2003]. 6.1 Model caveats TEPHRA represents a great implementation of the existing advection-diffusion models of tephra-fall dispersal. However, there are still some parameters and processes that need to be investigated and studied in more details. First of all, the mass distribution within the eruptive plume is controlled by the factor and by the determination of the particle-settling velocity within the plume and the plume vertical velocity. The factor allows to switch between sedimentation from strong plumes and sedimentation from 32
33 weak plumes, but is an empirical parameter not supported by a robust theory. Moreover, the determination of particle-settling velocity within the plume and plume vertical velocity is very complex and TEPHRA still uses empirical parameters based on the theory from Suzuki [1983]. A more thorough model is needed to describe the plume dynamics. A further implementation of TEPHRA could be describing the effects of aggregation processes and particle shape on tephra-fall dispersal. Aggregation processes were not accounted for in our assessment because no particle-aggregation data are available for the Kaharoa eruption. A reliable parameterization that can describe aggregation processes during tephra fall even when direct observations are not possible would help describe tephra-fall features also from those volcanoes that do not erupt very frequently and therefore do not provide detailed information of their eruptive processes. A simple parameterization of the effect of particle shape on particle-settling velocity would also significantly improve the description of tephra-fall dispersal. Unfortunately, modeling settling velocities without the assumption of spherical particles is still very complex [Chhabra et al., 1999]. Nonetheless, the stochastic sampling of grainsize parameters used in our assessment can at least provide a complete analysis regardless the lack of reliable observations due to the difficulties of studying an old tephra-fall deposit. Advection-diffusion models are typically characterized by particle release at time=0, and therefore do not account for wind-profile variations with time that can significantly affect long-lasting eruptions. Another important implementation of advection-diffusion models in the frame of forecasting tephra-fall dispersal for hazard assessment would be including the time factor for the simulation of tephra fall. Finally, reliable datasets from powerful eruptions are needed to calibrate advection-diffusion models more accurately. Our calibration was based on one very good dataset from a weak subplinian plume. In order to have more reliable models for tephrafall dispersal that can provide reliable hazard assessments, we need more datasets complete with direct observations of tephra-fall processes and accurate data processing. 33
34 7. Conclusions A new advection-diffusion model, TEPHRA, was developed from the combination of several theories and modeling approaches to provide an efficient and reliable tool for hazard assessment of tephra fall from weak and strong plumes. After a careful analysis of the model, we can conclude that: 1. the main implementations of TEPHRA are represented by: (i) parallelization of the advection-diffusion code, (ii) fully probabilistic assessment of input and output parameters and (iii) more robust algorithm. 2. parallel modeling is the ideal computational approach for hazard assessment as, given the short computing times, it increases the hazard map resolution and reliability because calculations can be done on more points and because the physical models can be based on a more robust algorithm; 3. the short computing times that characterize parallel modeling also allow a fully probabilistic assessment based on (i) a stochastic sampling of input parameters and (ii) a probabilistic analysis of possible outcomes; 4. the main implementations of the advection-diffusion algorithm are: (i) grainsize dependent diffusion law, (ii) particle-settling velocities that account for Reynold s Number variations along the particle traectory and (iii) use of the massdistribution factor to simulate sedimentation from strong as well as weak plumes (i.e. using large and small values of respectively); 5. output results are sensitive to the choice of diffusion coefficient and values and less sensitive to the choice of fall-time cut off. A combination of observations from the AD 1305 Kaharoa eruption and model simulations enabled us to evaluate probabilistically the accumulations and effects in different areas of the North Island (NZ) of tephra fall produced by Tarawera Volcano and based on the assumption of three different eruptive scenarios: (i) Upper Limit Scenario (1 eruptive episode happening with a 26-km-high plume), (ii) Eruption Range Scenario (1 eruptive episode happening with a plume in the range km) and (iii) Multiple 34
35 Eruption Scenario (10 eruptive episodes with plumes in the range km). On the basis of our tephra-fall hazard assessment we can also conclude that: 6. due to the prevailing winds below 25 km above sea level blowing between N and S with main direction to the E, the areas W and S of the Tarawera Volcanic Complex are likely to receive little tephra fall from a Kaharoa-type eruption. Therefore key cities such as Tauranga, Hamilton and Auckland are relatively safe from hazardous accumulation of tephra fall; 7. the most affected localities are key towns NE of Tarawera that are likely to experience damage to vegetation in the case of ULS, ERS and MES and partial collapse of building in the case of ULS and MES; 8. detailed wind analysis shows that the dispersal of tephra fall from Tarawera Volcano is not significantly affected by El Niño or La Niña fluctuations, whereas is slightly affected by seasonal variations, with the area immediately west of the volcano being more likely to receive tephra fall during the austral spring-summer; 9. based on purely tephra-fall dispersal considerations, the whole Kaharoa eruption might have occurred during an austral spring-summer or at least 5 consecutive units are very likely to have occurred during the same austral springsummer (i.e. Units H to L). Acknowledgments Many thanks to Steve Sahetapy-Engel for his continuous support and sharing of his experience and knowledge of the AD 1305 Kaharoa eruption. NCEP Reanalysis data were provided by the NOAA-CIRES Climate Diagnostics Center, Boulder, Colorado, USA, from their Web site at This research was funded by a subcontract from the Foundation for Research, Science and Technology via Professor J.W. Cole and the University of Canterbury (New Zealand). 35
36 References Armienti, P., G. Macedonio, and M.T. Pareschi, A numerical-model for simulation of tephra transport and deposition - applications to May 18, 1980, Mount-St-Helens eruption, Journal of Geophysical Research, 93 (B6), , Barberi, F., G. Macedonio, M.T. Pareschi, and R. Santacroce, Mapping the tephra fallout risk: an example from Vesuvius, Italy, Nature, 344, , Blong, R., The Rabaul Eruption, 1994, Australian Geographer, 25 (2), , Blong, R.J., Volcanic Hazards. A sourcebook on the effects of eruptions, 424 pp., Academic Press, Sidney, Bonadonna, C., Models of tephra dispersal, Ph.D. thesis, University of Bristol, Bristol, Bonadonna, C., G.G.J. Ernst, and R.S.J. Sparks, Thickness variations and volume estimates of tephra fall deposits: the importance of particle Reynolds number, Journal of Volcanology and Geothermal Research, 81 (3-4), , Bonadonna, C., G. Macedonio, and R.S.J. Sparks, Numerical modelling of tephra fallout associated with dome collapses and Vulcanian explosions: application to hazard assessment on Montserrat, in The eruption of Soufrière Hills Volcano, Montserrat, from 1995 to 1999, edited by T.H. Druitt, and B.P. Kokelaar, pp , Geological Society, London, Memoir, 2002a. Bonadonna, C., and J.C. Phillips, Sedimentation from strong volcanic plumes, Journal of Geophysical Research, 108 (B7), , Bursik, M.I., S.N. Carey, and R.S.J. Sparks, A gravity current model for the May 18, 1980 Mount-St-Helens plume, Geophysical Research Letters, 19 (16), , 1992a. Bursik, M.I., R.S.J. Sparks, J.S. Gilbert, and S.N. Carey, Sedimentation of tephra by volcanic plumes: I. Theory and its comparison with a study of the Fogo A plinian deposit, Sao Miguel (Azores), Bulletin of Volcanology, 54, , 1992b. Carey, S., and H. Sigurdsson, The intensity of Plinian eruptions, Bulletin of Volcanology, 51, 28-40, Carey, S.N., and H. Sigurdsson, Influence of particle aggregation on deposition of distal tephra from the May 18, 1980, eruption of Mount St-Helens volcano, Journal of Geophysical Research, 87 (B8), , Carey, S.N., and R.S.J. Sparks, Quantitative models of the fallout and dispersal of tephra from volcanic eruption columns, Bulletin of Volcanology, 48, , Chhabra, R.P., L. Agarwal, and N.K. Sinha, Drag on non-spherical particles: an evaluation of available methods, Powder Technology, 101 (3), , Chung, M.R., The eruption of Nevado del Ruiz Volcano, Colombia, South America (November 13,1985), in Natural Disaster Studies, edited by N.R. Council, pp. 109, National Academy Press, Washington, D.C., Cole, J.W., Structure and eruptive history of Tarawera Volcanic Complex, New Zealand Journal of Geology and Geophysics, 13, , Coltelli, M., M. Pompilio, P. Del Carlo, S. Calvari, S. Pannucci, and V. Scribano, Etna. Eruptive activity, in Data related to eruptive activity, unrest phenomena and other observations on the Italian active volcanoes Geophysical monitoring of 36
37 the Italian active volcanoes , edited by P. Gasparini, pp , Acta Vulcanologica, Connor, C.B., B.E. Hill, B. Winfrey, N.M. Franklin, and P.C. La Femina, Estimation of volcanic hazards from tephra fallout, Natural Hazards Review, 2 (1), 33-42, Di Vito, M.A., R. Isaia, G. Orsi, J. Southon, M. D'Antonio, S. de Vita, L. Pappalardo, and M. Piochi, Volcanism and deformation since 12,000 years at the Campi Flegrei caldera (Italy), Journal of Volcanology and Geothermal Research, 91 (2-4), , Ernst, G.G.J., R.S.J. Sparks, S.N. Carey, and M.I. Bursik, Sedimentation from turbulent ets and plumes, Journal of Geophysical Research-Solid Earth, 101 (B3), , Fedotov, S.A., S.T. Balesta, V.N. Dvigalo, A.A. Razina, G.B. Flerov, and A.M. Chirkov, New Tolbachik Volcanoes, in Active volcanoes of Kamchatka, edited by O.M. Vanyukova, pp. 302, Nauka Publisher, Moscow, Geist, A., A. Beguelin, J. Donagarra, W. Jaing, R. Mancheck, and V. Sunderam, PVM: Parallel Virtual Machine - a User's Guide and Tutorial for Networked Parallel Computing., 279 pp., The MIT Press, Cambridge, Ma, Glaze, L.S., and S. Self, Ashfall dispersal for the 16 September 1986, eruption of Lascar, Chile, calculated by a turbulent-diffusion model, Geophysical Research Letters, 18 (7), , Hanna, S.R., G.A. Briggs, and R.P. Hosker, Handbook on atmospheric diffusion, 102 pp., Technical Information Center (U.S. Department of Energy), Hildreth, W., and R.E. Drake, Volcano Quizapu, Chilean Andes, Bulletin of Volcanology, 54, , Hill, B.E., C.B. Connor, M.S. Jarzemba, P.C. La Femina, M. Navarro, and W. Strauch, 1995 eruptions of Cerro Negro volcano, Nicaragua, and risk assessment for future eruptions, Geological Society of America Bulletin, 110 (10), , Hurst, A.W., and R. Turner, Performance of the program ASHFALL for forecasting ashfall during the 1995 and 1996 eruptions of Ruapehu volcano, New Zealand Journal of Geology and Geophysics, 42 (4), , Inman, D.L., Measures for describing the size distribution of sediments, Journal of Sedimentary Petrology, 22, , Iverson, R.M., S.P. Schilling, and J.W. Vallance, Obective delineation of laharinundation hazard zones, Geological Society of America Bulletin, 110, , Kalnay, E., M. Kanamitsu, R. Kistler, W. Collins, D. Deaven, L. Gandin, M. Iredell, S. Saha, G. White, J. Woollen, Y. Zhu, M. Chelliah, W. Ebisuzaki, W. Higgins, J. Janowiak, K.C. Mo, C. Ropelewski, J. Wang, A. Leetmaa, R. Reynolds, R. Jenne, and D. Joseph, The NCEP/NCAR 40-year reanalysis proect, Bulletin of the American Meteorological Society, 77 (3), , Keam, R.F., Tarawera: the volcanic eruption of 1886, 472 pp., R.F. Keam, Auckland, Kokelaar, B.P., Setting, chronology and consequences of the eruption of Soufrière Hills Volcano, Montserrat ( ), in The eruption of Soufrière Hills Volcano, Montserrat, from 1995 to 1999, edited by T.H. Druitt, and B.P. Kokelaar, Geological Society, London, Memoir,
38 Koyaguchi, T., and M. Ohno, Reconstruction of eruption column dynamics on the basis of grain size of tephra fall deposits. 1. Methods, Journal of Geophysical Research, 106 (B4), , 2001a. Kunii, D., and O. Levenspiel, Fluidisation Engineering, Wiley and Sons, New York, Lacroix, A., La Montagne Pelée et ses eruptions, Masson, Paris, Macedonio, G., M.T. Pareschi, and R. Santacroce, A numerical simulation of the Plinian fall phase of 79 AD eruption of Vesuvius, Journal of Geophysical Research-Solid Earth and Planets, 93 (B12), , Maulucci Vivolo, F.P., Lettere di Plinio il Giovane a Tacito sull'eruzione del Vesuvio (da C. Plini Caecili Secundi Epistularum libri decem), pp. 39, Bastogi Editrice Italiana, Foggia, Melnik, O., Dynamics of two-phase conduit flow of high-viscosity gas-saturated magma: large variations of sustained explosive eruption intensity, Bulletin of Volcanology, 62 (3), , Morton, B., G.L. Taylor, and J.S. Turner, Turbulent gravitational convection from maintained and instantaneous source, Proceedings of the Royal Society, 234, 1-23, Nairn, I.A., Sheet V16AC-Tarawera. Geological map of New Zealand 1:50000, Department of Scientific and Industrial Research, Wellinghton, Nairn, I.A., S. Self, J.W. Cole, G.S. Leonard, and C. Scutter, Distribution, stratigraphy, and history of proximal deposits from the c. AD 1305 Kaharoa eruptive episode at Tarawera Volcano, New Zealand, New Zealand Journal of Geology and Geophysics, 44, , Newhall, C.G., and R.P. Hoblitt, Constructing event trees for volcanic crises, Bulletin of Volcanology, 64, 3-20, Pasquill, F., Atmospheric Diffusion, John Wiley & Sons, Chichester, Pinel, V., and C. Jaupart, Magma chamber behavior beneath a volcanic edifice, Journal of Geophysical Research-Solid Earth, 108 (B2), Prata, A.J., and I.F. Grant, Retrieval of microphysical and morphological properties of volcanic ash plumes from satellite data: Application to Mt Ruapehu, New Zealand, Quarterly Journal of the Royal Meteorological Society, 127 (576), , Pyle, D.M., The thickness, volume and grainsize of tephra fall deposits, Bulletin of Volcanology, 51 (1), 1-15, Sahetapy-Engel, S., Tephra fall deposit of the AD 1305 eruption of Tarawera, New Zealand: reconstruction of eruption dynamics, Master thesis, University of Hawaii, Honolulu, Sparks, R.S.J., The dimensions and dynamics of volcanic eruption colums, Bulletin of Volcanology, 48, 3-15, Sparks, R.S.J., M.I. Bursik, G.J. Ablay, R.M.E. Thomas, and S.N. Carey, Sedimentation of tephra by volcanic plumes.2. Controls on thickness and grain-size variations of tephra fall deposits, Bulletin of Volcanology, 54 (8), , Sparks, R.S.J., M.I. Bursik, S.N. Carey, J.S. Gilbert, L.S. Glaze, H. Sigurdsson, and A.W. Woods, Volcanic Plumes, 574 pp., John Wiley & Sons, Chichester,
39 Sparks, R.S.J., and G.P.L. Walker, The significance of vitric-enriched air-fall ashes associated with crystal-enriched ignimbrites, Journal of Volcanology and Geothermal Research, 2, , Sparks, R.S.J., and L. Wilson, Explosive volcanic eruptions: V. Observations of plume dynamics during the 1979 Soufrière eruption, St. Vincent, Geophysical Journal of the Royal Astronomical Society, 69, , Sparks, R.S.J., L. Wilson, and H. Sigurdsson, The pyroclastic deposits of the 1875 eruption of Aska, Iceland, Philosophical Transaction of the Royal Society of London, 229, , Sparks, R.S.J., and S.R. Young, The eruption of Soufrière Hills Volcano, Montserrat ( ): overview of scientific results, in The eruption of Soufrière Hills Volcano, Montserrat, from 1995 to 1999, edited by T.H. Druitt, and B.P. Kokelaar, Geological Society, London, Memoir, Sterling, T.L., J. Salmon, D.J. Becker, and D.F. Savarese, How to build a Beowulf - a Guide to implementation and application of PC clusters, 239 pp., The MIT Press, Cambridge, Ma, Stirling, M.W., and C.J.N. Wilson, Development of a volcanic hazard model for New Zealand: first approaches from the methods of probabilistic seismic hazard analysis, Bulletin of the New Zealand Society for Earthquake engineering, 35 (4), , Suzuki, T., A theoretical model for dispersion of tephra, in Arc Volcanism, Physics and Tectonics, edited by D. Shimozuru, and I. Yokoyama, pp , Terra Scientific Publishing Company (TERRAPUB), Tokyo, Wadge, G., P. Jackson, S.M. Bower, A.W. Woods, and E. Calder, Computer simulations of pyroclastic flows from dome collapse, Geophysical Research Letters, 25 (19), , Walker, G.P.L., The Taupo Pumice: product of the most powerful known (Ultraplinian) eruption?, Journal of Volcanology and Geothermal Research, 8, 69-94, Walker, G.P.L., The Waimihia and Hatepe plinian deposits from the rhyolitic Taupo Volcanic Centre, New Zealand Journal of Geology and Geophysics, 24, , Walker, G.P.L., S. Self, and L. Wilson, Tarawera, 1886, New Zealand - A basaltic Plinian fissure eruption, Journal of Volcanology and Geothermal Research, 21, 61-78, Williams, H., Volcanoes of the Paricutin Region, USGS Bulletin, 965 (B), , Wilson, L., and T.C. Huang, The influence of shape on the atmospheric settling velocity of volcanic ash particles, Earth and Planetary Sciences Letters, 44, , Woo, G., The mathematics of natural catastrophes, 292 pp., Imperial College Press, London, Woods, A.W., The fluid-dynamics and thermodynamics of eruption columns, Bulletin of Volcanology, 50 (3), , Woods, W., The dynamics of explosive volcanic eruptions, Review of Geophysics (AGU), 33 (4), ,
40 Test/Scenario Fig. Grainsize Distribution CALIBRATION Runs 1 Ruapehu (tot data) Runs 2 Ruapehu (dist. data) Md() min-max Density (kg m -3 ) pumices lithics Column Height (km) Vent Height (m) Erupted Mass (x kg) 7,8-0.8* 2.4* -8 10* * * BF: 0.2 7,8-0.8* 2.4* -8 10* * * BF: 0.3 K (m 2 s -1 ) BF: BF: 600 Diff. Law cut off (s) BF: BF: 1080 Dur. (hrs) Winds [max speed] (m s -1 ) 7* Ruapehu* [28]* 7* Ruapehu* [28]* Runs 3 Kaharoa F 8, * Kaharoa F [27] HAZARD CURVES Runs 4 ULS Runs 5 ERS PROBABILITY MAPS Runs 6 ULS ,300 Runs 7 ERS ,300 Runs 8 MES ,300 Runs 9 ULS 17a Winter 30 Runs 10 ULS 17b Summer 30 Runs 11 ULS 18a neutral 30 Runs 12 ULS 18b ENSO 30 Runs 13 ULS 18c El Niño 30 Runs 14 ULS 18d La Niña 30 Deposit Threshold (kg m -2 ) Values in italic bold are the parameters varied to test the sensitivity of the model. Values in regular bold are the parameters stochastically sampled during simulations. BF is the best-fit value. Grainsize Distribution is the total grainsize distribution of the tephra-fall deposit expressed with the Inman parameters (Mdand [Inman, 1952]) and the minimum and maximum particle diameter (); grainsize parameters for Ruapehu are from the 17 June 1996 deposit (Runs 1-2); grainsize parameters for Kaharoa F are averaged from the grainsize distributions in Fig. 6c (Runs 3); Md for Runs 4-14 is stochastically sampled between the two end-member distributions in Fig. 6c. Density is the measured density of the erupted centimetric clasts (kg m -3 ); density of all pumice particles is made varied between the density of centimetric pumices and the density of centimetric lithics according to the density model in Fig. 10. Column Height is the maximum height of the eruptive plume (km). Vent Height is the height of the eruptive vent (km). Erupted Mass is the total tephra-fall mass erupted (kg) determined by eq. (13). is the mass-distribution factor (eq. (10)). K is the diffusion coefficient (m 2 s -1 ) (eq. (6)). Diff. Law cut off is the fall time at which the diffusion law switches between linear and power law (eq. (6) and (8)). Winds are the wind profiles used in the simulations with the maximum value indicated in square brackets (Ruapehu is the wind profile observed during the 17 June 1996 eruption (NCEP Reanalysis data); Kaharoa F is the wind determined with the method of Carey and Sparks [1986] for the Kahaora F event with the direction along the dispersal axis of the deposit; are profiles sampled 4 times a day between 1996 and 1998; Winter and Summer are the profiles for the austral winter and summer between 1996 and 1998; 1996-neutral are the profiles for the year 1996 that was characterized by neutral conditions; ENSO are profiles from that were years characterized by El Niño Southern Oscillation phenomenon; 1997-El Niño and 1998-La Niña are the profiles during El Niño and La Niña fluctuations occurred in 1997 and 1998 respectively). Dur. is the duration of the eruptive episode in hours. Deposit Threshold is the hazardous threshold used to compile hazard curves and probability maps (kg m -2 ). *, observed data.
41 Appendix I Nomenclature Dimensions of each term are given in brackets: L = length, T = time, M = mass. C constant empirically determined (C =0.04 m 2 s -1 ; [Suzuki, 1983]) [L T -1 ] C D d f i, ( x, y) drag coefficient particle diameter [L] function of mass accumulation on the ground around a point with coordinates (x,y) (Gaussian distribution) [L -2 ] f () function of total grainsize distribution of the eruptive plume g acceleration due to gravity [L T -2 ] H total plume height [L] H max maximum total plume height observed and/or considered possible [L] H min minimum total plume height observed and/or considered possible [L] i indices of point sources along the eruptive plume indices of particle size K horizontal atmospheric diffusion coefficient (K=K x =K y ) [L 2 T -1 ] K x x component (horizontal) of the diffusion coefficient [L 2 T -1 ] K y y component (horizontal) of the diffusion coefficient [L 2 T -1 ] K z z component (vertical) of the diffusion coefficient [L 2 T -1 ] M ( x, y) total mass accumulated on the ground around a point of coordinates (x,y) o i, [M L -2 ] M total erupted mass of a given grainsize fraction released from a point source i along the erupting plume [M] o M total erupted mass [M] Md Median Diameter (grainsize parameter) [Inman, 1952]
42 M comp computed mass accumulation per unit area [M L -2 ] M obs observed mass accumulation per unit area [M L -2 ] m i, mass per unit area of a given grainsize fraction released from a point source i and accumulated on the ground around a point of coordinates (x,y) [M L -2 ] mf misfit function [M L -2 ] N number of data points P conditional probability p z (z i ) probability density function of mass distribution within the eruptive plume r i plume radius at a given height z i [L] Re particle Reynolds number SkG Graphic Skewness (grainsize parameter) [Inman, 1952] t, fall time of a particle of size released from a point source i along the eruptive i plume [T] ' t i horizontal diffusion time in the volcanic plume at a point source i [T] v particle terminal velocity of a particle of size in the atmosphere [M L -1 ] v p particle settling velocity within the eruptive plume as empirically calculated by Suzuki [1983] to fit data from [Wilson and Huang, 1979] [M L -1 ] w o upward velocity of particles at vent [L T -1 ] w x component of the wind speed along the x axis [L T -1 ] wy component of the wind speed along the y axis [L T -1 ] w(z i ) upward velocity of particle within the eruptive plume [L T -1 ] x, y i i i coordinates of a point on the ground x, y, z coordinates of a point source i along the eruptive plume from where particles are released x i, x coordinate of the center of the Gaussian distribution of mass on ground of particles of size and released from a point i along the eruptive plume ( x i, xi x ) [L] layers
43 y i, y coordinate of the center of the Gaussian distribution of mass on ground of particles of size and released from a point i along the eruptive plume ( y i, yi y ) [L] layers Y(z i ) dimensionless parameter proportional to the ratio of upward particle velocity (i.e. plume velocity) to particle settling velocity within the eruptive plume Y o dimensionless parameter proportional to the ratio of initial particle velocity at vent to particle settling velocity within the eruptive plume height of a point source i along the eruptive plume [L] z i dimensionless parameter that controls the shape of the mass-distribution function within the eruptive plume min minimum value of considered for a specific set of simulations t duration of the Plinian discharge [T] time spent by a particle of size within each atmospheric layer [T] x wind transport of a particle of size along the x axis within an atmospheric layer x wt ) [L] ( x y wind transport of a particle of size along the y axis within an atmospheric layer z y w t ) [L] ( y thickness of each atmospheric layer [L] µ dynamic viscosity [M L -1 T -1 ] a air density [M L -3 ] p particle density [M L -3 ] dep density of tephra-fall deposit [M L -3 ] Graphic Standard Deviation (grainsize parameter) [Inman, 1952] [L 2 ] variance of the Gaussian mass distribution on the ground of particles of size 2 i, p released from a point source i [L 2 ] standard deviation of the Gaussian distribution of the mass in the ascending plume [L]
44 granulometric unit: = -log 2 (10 3 d), where d is the particle diameter in m max maximum particle diameter min minimum particle diameter
45 Figure captions Fig. 1. Map of the North Island of New Zealand showing: (a) main cities (black diamonds), important populated towns (grey circles: Mk, Maketu; Mt, Matata; Ec, Edgecumbe; W, Whakatane; TT, Te Teko; K, Kawerau), Tarawera Volcanic Complex (small grey triangle) and the Taupo Volcanic Zone (large shaded triangle); (b) Tarawera Volcanic Complex (adapted from Nairn [1989] and Sahetapy-Engel [2002]) with the main domes, old lava deposits and the AD 1886 eruptive fissure. The names of the 4 lava domes produced during the AD 1305 Kaharoa eruption are also shown (only Crater Dome, Ruawahia Dome and Wahanga Dome produced tephra fall; [Sahetapy-Engel, 2002]). Fig. 2. Isopach map of total tephra-fall accumulation (cm) from the AD 1305 Kaharoa eruption [Sahetapy-Engel, 2002]. Dash line indicates 5 cm isopach. The triangle indicates the Tarawera Volcanic Complex. Note the two prominent lobes to the southwest and to the northwest. Fig. 3. Semi-log plots showing the variation, for different particle sizes, of: (a) fall time (t i, ); (b) fall time + diffusion time in the plume (t i, + t i ); (c) variance (σ 2 i, ) (eq. (6) and eq. (8)). Calculations are done between 1 and 35 km (1 km step), with K= 900 m 2 s -1 and fall-time threshold=3600 s. Note how the plume diffusion time (t i ) mainly 2 affects coarse particles ((a) and (b)). Note also the step in σ i, values at 5-6 km due to the shift of diffusion law for particles with diameter of 0.25 mm (2 φ) ((c); (eq. (6) and eq. (8)). Fig. 4. Mass fraction of particles of a specific grainsize, here specified by settling velocities of 0.25, 1, and 2.5 m s -1, released as a function of height from a volcanic plume of total height 10 km, calculated using eq. (6) and (8). Initial eruption velocity at the vent, w o, is assumed to be 100 m s -1. Substantially different curves are generated for (a) β = 1 and (b) β = Fig. 5. Frequency plots showing output results for: (a) plume heights stochastically sampled between Log(14 km) and Log(26 km) (bin = 200 m); (b) eruptive-episode duration stochastically sampled between 2 and 6 hours (bin = 0.1 hours); (c) total erupted mass determined from the combination of plume heights and eruption duration above (eq. (13)) (bin = 2.00E+10 kg). Fig. 6. Frequency plots showing: (a) values of β stochastically sampled between 0.5 and 1 (bin = 0.01) and (b) Mdφ stochastically sampled between -0.8 and 4 φ (bin = 0.1 φ). φ = -log 2 (10 3 d), where d is the particle diameter in m. (c) Cumulative plot showing the total grainsize distribution of the Waimihia Plinian (white), Hatepe Plinian (black) and Taupo Plinian (gray) from Walker [1980] and Walker [1981]. Given that all original grainsize distributions are truncated at 3 φ, the grainsize trend beyond 3 φ is extrapolated based on a log-normal distribution. Resulting Mdφ are: -0.8, 0.6 and 4 φ respectively. Resulting σ φ are: 2.3, 2.3 and 2.9 respectively. Fig. 7. Semi-log plots showing the misfit function (mf; eq. (15)) for all points (grey diamonds; primary axis; Runs 1 in Table 1) and for distal points (white triangles; secondary axis; Runs 2 in Table 1) (17 June 1996 eruption of Ruapehu, New Zealand) calculated for: (a) diffusion coefficient, K, (b) fall-time cut off and (c) mass-
46 distribution parameter, β. Observed data from BF Houghton (manuscript in preparation, 2003). Fig. 8. Log plots showing best fit for: (a) Ruapehu total data (114 data) (DC = 200 m 2 s - 1 ; fall-time threshold = 72 s, i.e hours); (b) Ruapehu distal data (88 points) (DC = 600 m 2 s -1 ; fall-time threshold = 1080 s, i.e. 0.3 hours); (c) Kaharoa F using Ruapehu distal-data best fit (DC = 600 m 2 s -1 ; fall-time threshold=1080 s). Ruapehu proximal data (< 5 km) plotted with distal-data best fit are also shown in (b). Runs 1-3 in Table 1. The equiline is also shown for comparison. Observed data for the Ruapehu and Kaharoa eruptions are from BF Houghton (manuscript in preparation, 2003) and Sahetapy-Engel [2002] respectively. Fig. 9. Comparison between isomass maps for the AD 1305 Kaharoa eruption (Unit F) compiled from field data (from Sahetapy-Engel [2002]) and the computed deposit. The computed deposit is run with DC = 600 m 2 s -1 and fall-time cut off = 1080 s (see alsotable 1). Tephra-fall accumulation is in kg m -2. Contours for the field-based map are spaced every 50 kg m -2 ; the 10 kg m -2 contour is also shown. Black dots on the field-based map indicate field data. Contours for the computed map are spaced every 10 kg m -2 up to 50 kg m -2, and every 100 kg m -2 after 100 kg m -2. Some key cities (diamonds) and Tarawera Volcano (triangle) are also shown. Fig. 10. Density parameterization for the AD 1305 Kaharoa eruption (from Bonadonna and Phillips [2003]). Density of pumices (gray circles; 1000 kg m -3 ) and lithics (black triangles; 2350 kg m -3 ) with diameter >2 mm is directly measured [Sahetapy-Engel, 2002]. Density of lithics is assumed to be constant, whereas density of pumices with diameter <2 mm is assumed to decrease linearly and to reach the lithic density value when the fragment diameter decreases below 8 µm. Fig. 11. Plots showing (a) mean wind direction (provenance ) and (b) mean wind velocity averaged for each level (i.e. every 1 km) over 3 years of wind profiles ( ) sampled 4 times a day (see text for details). The standard deviation determined for each level is also shown. NCEP Reanalysis data provided by the NOAA-CIRES Climate Diagnostics Center. Fig. 12. Plots showing: (a) the percentage of wind profiles characterized by 15 levels with wind blowing between 0 and 90, 90 and 180, 180 and 270 and 270 and 360 respectively (degrees are from the North); (b) the percentage of such wind profiles distributed amongst each month. Percentages are calculated out of the total wind sample analyzed (i.e ). Fig. 13. Hazard curves computed for the Upper Limit Scenario (thick line) and the Eruption Range Scenario (thin line) for key cities and towns (in Fig. 1): (a) Maketu, (b) Kawerau, (c) Tauranga, (d) Taupo, (e) Wellington and (f) Rotorua. Hazard Curves show the probability of exceeding a given accumulation of tephra fall (kg m -2 ). Runs 4 and 5 in Table 1. Fig. 14. Upper Limit Scenario maps computed for a deposit threshold of: (a) 30 kg m -2 (damage to agriculture) and (b) 300 kg m -2 (minimum loading for roof collapse). The map for a 600 kg m -2 threshold is not shown as it only indicates probability <5% for the populated areas around the volcano. Contours are spaced every 10% probability of reaching a given threshold. The 5% contour is also shown (thick solid line). Key cities and towns are also shown (circles; from Fig. 1). Tarawera Volcanic Complex is indicated with a triangle. Runs 6 in Table 1.
47 Fig. 15. Eruption Range Scenario maps computed for a deposit threshold of 30 kg m -2 (damage to agriculture). The map for a 300 kg m -2 threshold is not shown as it only indicates probability <5% for the populated areas around the volcano. Contours are spaced every 10% probability of reaching a given threshold. The 5% contour is also shown (thick solid line). Key cities and towns are also shown (circles; from Fig. 1). Tarawera Volcanic Complex is indicated with a triangle. Runs 7 in Table 1. Fig. 16. Multiple Eruption Scenario maps computed for a deposit threshold of: (a) 30 kg m -2 (damage to agriculture) and (b) 300 kg m -2 (minimum loading for roof collapse). The map for a 600 kg m -2 threshold is not shown as it only indicates probability <5% for most of the populated areas around the volcano (apart from Kawerau, i.e. 5%). Contours are spaced every 10% probability of reaching a given threshold. The 5% contour is also shown (thick solid line). Key cities and towns are also shown (circles; from Fig. 1). Tarawera Volcanic Complex is indicated with a triangle. Runs 8 in Table 1. Fig. 17. Upper Limit Scenario maps computed sampling wind data (a) from June through August (austral winter; winds mainly blowing between 0 and 180, see Fig. 7b) and (b) from September to March (austral spring-summer; when winds also blow between 180 and 360, see Fig. 7b). Deposit threshold is 30 kg m -2 (damage to agriculture). Contours are spaced every 10% probability of reaching a given threshold. The 5% contour is also shown (thick solid line). Key cities and towns are also shown (circles; from Fig. 1). Tarawera Volcanic Complex is indicated with a triangle. Runs 9 and 10 in Table 1. Fig. 18. Upper Limit Scenario maps computed sampling wind data (a) from 1996 (neutral conditions), (b) from 1997 through 1998 (characterized by El Niño Southern Oscillation phenomenon), (c) from April 1997 through May 1998 (characterized by a strong El Niño fluctuation) and (d) between May and December 1998 (characterized by La Niña fluctuation). Deposit threshold is 30 kg m -2 (damage to agriculture). Contours are spaced every 10% probability of reaching a given threshold. The 5% contour is also shown (thick solid line). Key cities and towns are also shown (circles; from Fig. 1). Tarawera Volcanic Complex is indicated with a triangle. Runs in Table 1.
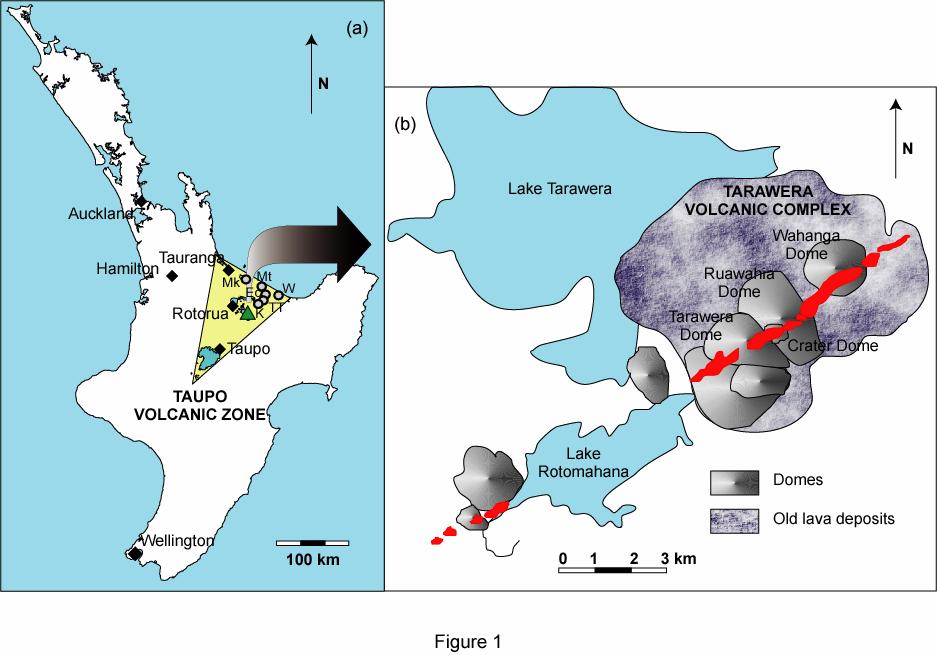
48

49
50 column height (km) mm 32 mm 2 mm 0.25 mm mm mm (a) column height (km) 0 1.E+00 1.E+02 1.E+04 1.E+06 1.E mm mm 2 mm mm mm mm 10 (b) 0 1.E+00 1.E+02 1.E+04 1.E+06 1.E+08 fall time (sec) column height (km) mm 32 mm 2 mm 0.25 mm mm mm 0 1.E+03 1.E+05 1.E+07 1.E+09 1.E+11 1.E+13 1.E+15 1.E+17 σ 2 (m 2 ) (c) Figure 3
51
52

53 Figure 6
54 50.0 (a) total data 1.3 mf (kg m -2 ) distal data diffusion coefficient (m 2 s -1 ) 33.0 (b) 1.10 mf (kg m -2 ) total data distal data fall time threshold (s) 40.0 (c) mf (kg m -2 ) total data 1.12 distal data β Figure 7
55 Figure 8
56
57 Figure 10
58
59
60 Figure 13
61

62

63

64

65
Probabilistic modelling of tephra dispersion
 Probabilistic modelling of tephra dispersion C. BONADONNA Department of Geology, University of South Florida, Tampa, FL 33620-5201, USA (e-mail: costanza@cas.usf.edu) Depending on their magnitude and location,
Sensitivity analysis and uncertainty estimation for tephra dispersal models
 JOURNAL OF GEOPHYSICAL RESEARCH, VOL. 113,, doi:10.1029/2006jb004864, 2008 Sensitivity analysis and uncertainty estimation for tephra dispersal models Simona Scollo, 1 Stefano Tarantola, 2 Costanza Bonadonna,
Numerical Simulations of Turbulent Flow in Volcanic Eruption Clouds
 Numerical Simulations of Turbulent Flow in Volcanic Eruption Clouds Project Representative Takehiro Koyaguchi Authors Yujiro Suzuki Takehiro Koyaguchi Earthquake Research Institute, University of Tokyo
Statistics in Volcanology: Uncertainty in Volcanology Data and Models
 : Data and Models School of Geosciences University of South Florida February 2017 Volcanic s... Eruption of Shinmoe-dake volcano, Kirishima volcano complex, Japan. Major research questions Tolbachik, Kamchatka,
Tephra2 Tutorial Scripts By Leah Courtland
 Tephra2 Tutorial Scripts By Leah Courtland Tephra2 Tutorial 1: An Introduction This video will introduce you to the concepts behind the tephra2 online simulation tool. Tephra2 uses the advection diffusion
Volcanic Plumes. JOHN WILEY & SONS Chichester New York Weinheim Brisbane Singapore Toronto
 Volcanic Plumes R. S. J. SPARKS University of Bristol, UK M. I. BURSIK State University of New York, USA S. N. CAREY University of Rhode Island, USA J. S. GILBERT Lancaster University, UK L. S. GLAZE NASA/Goddard
Multistage volcanic events: Tephra hazard simulations for the Okataina Volcanic Center, New Zealand
 JOURNAL OF GEOPHYSICAL RESEARCH, VOL. 113,, doi:10.1029/2007jf000787, 2008 Multistage volcanic events: Tephra hazard simulations for the Okataina Volcanic Center, New Zealand Susanna Jenkins, 1 Christina
Tephra2. This module explains how to use TEPHRA2. Tephra2 Manual
 Tephra2 Manual Tephra2 Tephra2 uses the advection-diffusion equation to calculate tephra accumulation at locations about a volcano based on a pre-defined set of eruptive conditions. This module explains
Statistics in Volcanology. TError: towards a better quantification of the uncertainty propagated during the characterization of tephra deposits
 Volume 1 November 18, 214 TError: towards a better quantification of the uncertainty propagated during the characterization of tephra deposits S. Biass 1, G. Bagheri 1, W. H. Aeberhard 2, C. Bonadonna
PLINIAN AND SUBPLINIAN ERUPTIONS
 PLINIAN AND SUBPLINIAN ERUPTIONS A FIELD PERSPECTIVE RAFFAELLO CIONI DIP.TO SCIENZE DELLA TERRA UNIVERSITA DI FIRENZE THANKS TO: MAURO ROSI, MARCO PISTOLESI, COSTANZA BONADONNA, KATHY CASHMAN, LUCIA GURIOLI,
Limitations of the advection-diffusion equation for modeling tephra fallout: 1992 eruption of Cerro Negro Volcano, Nicaragua.
 University of South Florida Scholar Commons Graduate Theses and Dissertations Graduate School 2004 Limitations of the advection-diffusion equation for modeling tephra fallout: 1992 eruption of Cerro Negro
Estimates of the Dynamics of Volcano Eruption Column Using Real-time AVHRR Data
 Estimates of the Dynamics of Volcano Eruption Column Using Real-time AVHRR Data Ignacio Galindo Centro Universitario de Investigaciones en Ciencias del Ambiente (CUICA) UNIVERSIDAD DE COLIMA, Colima, México
SCIENTIFIC RESEARCH AND EDUCATION IN THE AIR FORCE AFASES2017
 SCIENTIFIC RESEARCH AND EDUCATION IN THE AIR FORCE AFASES2017 PROBABILITY ASSESSMENT OF POSSIBLE VOLCANIC ASH CONTAMINATION FOR THE BULGARIAN AIRSPACE BY DEVELOPING OF EVENT TREE AND RISK MATRIX FOR HYPOTHETICAL
IAVCEI Commission on Tephra Hazard Modelling
 IAVCEI Commission on Tephra Hazard Modelling FIELD WORKSHOP Field measurements for the characterization of tephra deposits (SALCEDO) Ecuador January 16-18, 2006 Table of content 1.0 INTRODUCTION page 2
Tephra2 Users Manual
 Tephra2 Users Manual Spring 2011 Tephra2 uses the advection-diffusion equation to calculate tephra accumulation at locations about a volcano based on a pre-defined set of eruptive conditions. This manual
Problems and Shortcomings of Current Methods. Larry G. Mastin U.S. Geological Survey Cascades Volcano Observatory
 Problems and Shortcomings of Current Methods Larry G. Mastin U.S. Geological Survey Cascades Volcano Observatory The two methods most commonly used 1. Empirical height-rate relationships Quick & easy But
Mt St Helens was know to have entered into active periods that lasted from years once every years over the last 500 years, (Figure 5).
.") Lecture #8 notes; Geology 3950, Spring 2006; CR Stern May 1980 eruption of Mt St Helens volcano (text pages 183-192 in the 4 th edition and 206-222 in the 5 th edition) Mt St Helens in southwest Washington
Lecture #8 notes; Geology 3950, Spring 2006; CR Stern May 1980 eruption of Mt St Helens volcano (text pages 183-192 in the 4 th edition and 206-222 in the 5 th edition) Mt St Helens in southwest Washington
VAAC Operational Dispersion Model Configuration Snap Shot Version 2. March 2016
 VAAC Operational Dispersion Model Configuration Snap Shot Version 2 March 2016 Introduction The VAACs are responsible for producing volcanic ash cloud analysis and forecasts to assist the aviation community
MODEL TYPE (Adapted from COMET online NWP modules) 1. Introduction
 1. Introduction") MODEL TYPE (Adapted from COMET online NWP modules) 1. Introduction Grid point and spectral models are based on the same set of primitive equations. However, each type formulates and solves the equations
MODEL TYPE (Adapted from COMET online NWP modules) 1. Introduction Grid point and spectral models are based on the same set of primitive equations. However, each type formulates and solves the equations
Volcanoes. volcanic hazards. Image courtesy of USGS.
 Volcanoes volcanic hazards Volcanic hazards Pyroclastic flows and surges Pyroclastic flows and surges PYROCLAST: all solid fragments ejected from volcanoes PYROCLASTIC FLOW: A flow of hot gas and volcanic
Sylvain Charbonnier. PASI Workshop About 60% of Indonesians live around 16 active volcanoes on the island of Java
 Numerical modelling of pyroclastic flows: a case study from the recent activity of Merapi Volcano, Central Java, Indonesia Sylvain Charbonnier PASI Workshop 2011 Case study: Merapi Volcano! About 60% of
The Bishop Tuff : An Overview of the World s Roughest and Toughest Volcanic Landform
 The Bishop Tuff : An Overview of the World s Roughest and Toughest Volcanic Landform Charity J. Southworth Indiana University, 2012 Abstract The Bishop Tuff is a welded tuff that was created 760,000 years
MANAGING VOLCANIC IMPACTS IN CANTERBURY. Tom Wilson University of Canterbury & Natural Hazard Research Platform
 MANAGING VOLCANIC IMPACTS IN CANTERBURY Tom Wilson University of Canterbury & Natural Hazard Research Platform Talk Outline Risk of a Volcanic eruption affecting Canterbury Putting it in context (likelihood/consequence)
Estimates of the dynamics of volcano eruption column using real-time AVHRR data
 Estimates of the dynamics of volcano eruption column using real-time AVHRR data Ignacio Galindo Centro Universitario de Investigaciones en Ciencias del Ambiente (CUICA) UNIVERSIDAD DE COLIMA, Colima, México
Characterization of Eruption Source Parameters and Propagation of Errors in Transport and Dispersal Models
 Characterization of Eruption Source Parameters and Propagation of Errors in Transport and Dispersal Models M. Bursik, R. Madankan, S. Pouget, E.R. Stefanescu M. Jones, A. Patra, B. Pitman, P. Singla, T.
Figure 8-21 Distribution of Lava Flow for the Model
 Figure 8-21 Distribution of Lava Flow for the Model 2) Pyroclastic Flow The energy cone model was used for the simulation. a. The angle of inclination of Energy Line, φ, from the summit was 5.3 degrees
GEOLOGY 285: INTRO. PETROLOGY
 Dr. Helen Lang Dept. of Geology & Geography West Virginia University SPRING 2015 GEOLOGY 285: INTRO. PETROLOGY The Cascade Volcanoes are a good example of the Circum- Pacific ring of fire of subductionrelated
Effect of Wind on the Rise Height of Volcanic Plumes
 Geophysical Research Letters, 28(18), 3621-3624, 2001. Effect of Wind on the Rise Height of Volcanic Plumes M. Bursik Department of Geology, University at Buffalo, SUNY Abstract. A theoretical model of
A new method to identify the source vent location of tephra fall deposits: development and
 A new method to identify the source vent location of tephra fall deposits: development and testing, and application to key Quaternary eruptions of Western North America Qingyuan Yang *(1), Marcus Bursik
Comparing volcanic risk at Volcán de Fuego and Cerro Quemado, Guatemala. PhD research proposal by Rüdiger Escobar Wolf.
 Comparing volcanic risk at Volcán de Fuego and Cerro Quemado, Guatemala. PhD research proposal by Rüdiger Escobar Wolf. What do I want to investigate? The greatest losses generally occur at volcanoes that
Pyroclastic Deposits I: Pyroclastic Fall Deposits
 Pyroclastic Deposits I: Pyroclastic Fall Deposits EAS 458 Volcanology Introduction We have seen that physics is useful in understanding volcanic processes, but physical models must be constrained by and
GEOLOGY 285: INTRO. PETROLOGY
 Dr. Helen Lang Dept. of Geology & Geography West Virginia University FALL 2005 GEOLOGY 285: INTRO. PETROLOGY Mount St. Helens 1980 Eruption Small earthquakes Small steam and ash eruptions in March and
Final report: Understanding ashfall hazards from a future eruption at Taupo caldera (EQC project 16/724)
") Final report: Understanding ashfall hazards from a future eruption at Taupo caldera (EQC project 16/724) Principal Investigator: Dr Simon Barker (University of Auckland) Research team Prof. Shane Cronin,
Final report: Understanding ashfall hazards from a future eruption at Taupo caldera (EQC project 16/724) Principal Investigator: Dr Simon Barker (University of Auckland) Research team Prof. Shane Cronin,
3/7/17. #16 - Case Studies of Volcanoes II. Announcements Monday 2/27
 Announcements Monday 2/27 Exam #1: Monday Feb. 27 th, 7:15-8:15 (see web site) Last Names A - N Loomis 141 Last Names O - Z Loomis 151 Bring your student ID An old exam is posted in Compass If you are
CALORIMETRY AND HYDROTHERMAL ERUPTIONS, WAIMANGU HYDROTHERMAL FIELD,
 247 Proc. 14th New Zealand Geothermal Workshop 1992 i CALORIMETRY AND HYDROTHERMAL ERUPTIONS, WAIMANGU HYDROTHERMAL FIELD, 1971-1990 Bradley J. Scott Instituteof Geological & Nuclear Sciences, Rotorua,
Fig. F-1-1. Data finder on Gfdnavi. Left panel shows data tree. Right panel shows items in the selected folder. After Otsuka and Yoden (2010).
.") F. Decision support system F-1. Experimental development of a decision support system for prevention and mitigation of meteorological disasters based on ensemble NWP Data 1 F-1-1. Introduction Ensemble
F. Decision support system F-1. Experimental development of a decision support system for prevention and mitigation of meteorological disasters based on ensemble NWP Data 1 F-1-1. Introduction Ensemble
GEOLOGY MEDIA SUITE Chapter 12
 UNDERSTANDING EARTH, SIXTH EDITION GROTZINGER JORDAN GEOLOGY MEDIA SUITE Chapter 12 Volcanoes 2010 W.H. Freeman and Company Plate tectonics explains the global pattern of volcanism. Key Figure 12.20 (page
Earth has more than 600 active volcanoes. An active volcano is one that has erupted within recorded history.
 Volcanoes A volcano is an opening in Earth s surface that erupts gases, ash, and lava. These materials pile up in layers around the opening, forming volcanic mountains. Earth has more than 600 active volcanoes.
RISK ASSESSMENT COMMUNITY PROFILE NATURAL HAZARDS COMMUNITY RISK PROFILES. Page 13 of 524
 RISK ASSESSMENT COMMUNITY PROFILE NATURAL HAZARDS COMMUNITY RISK PROFILES Page 13 of 524 Introduction The Risk Assessment identifies and characterizes Tillamook County s natural hazards and describes how
94/23. ASHFALL A Computer Program for Estimating Volcanic Ash Fallout. Report and Users Guide
 Institute of Geological & Nuclear Sciences Science Report 94/23 ASHFALL A Computer Program for Estimating Volcanic Ash Fallout Report and Users Guide A.W. Hurst 1994 ASHFALL A Computer Program for Estimating
Modeling dense pyroclastic basal flows from collapsing columns
 Click Here for Full Article GEOPHYSICAL RESEARCH LETTERS, VOL. 35, L04305, doi:10.1029/2007gl032585, 2008 Modeling dense pyroclastic basal flows from collapsing columns E. E. Doyle, 1 A. J. Hogg, 2 H.
From Punchbowl to Panum: Long Valley Volcanism and the Mono-Inyo Crater Chain
 From Punchbowl to Panum: Leslie Schaffer E105 2002 Final Paper Long Valley Volcanism and the Mono-Inyo Crater Chain Figure 1. After a sequence of earthquakes during the late 1970 s to the early 1980 s
University of Bristol - Explore Bristol Research
 Prata, F., Woodhouse, M. J., Huppert, H. E., Prata, A., Thordarson, TH., & Carn, S. A. (2017). Atmospheric processes affecting the separation of volcanic ash and SO2 in volcanic eruptions: Inferences from
Topic 1: Modeling SFU: (JVGR 1992)
") Topic 1: Modeling SFU: (JVGR 1992) 1. Were different chamber top shapes used other than flat, i.e. convex, concave, convoluted / ridged? What is the sensitivity of your models to this? Also, was there
Topic 1: Modeling SFU: (JVGR 1992) 1. Were different chamber top shapes used other than flat, i.e. convex, concave, convoluted / ridged? What is the sensitivity of your models to this? Also, was there
Introduction to Earth s s Spheres The Benchmark
 Introduction to Earth s s Spheres The Benchmark Volcanism Volcanic eruptions Effusive: lavas (e.g., Kilauea) Volcanism Volcanic eruptions Explosive: pyroclastic rocks (e.g., Krakatau) Factors Governing
A Synopsis of the Krakatau 1883 Eruption: The Story Told by The Deposits
 A Synopsis of the Krakatau 1883 Eruption: The Story Told by The Deposits By Dr. Charles W. Mandeville American Museum of Natural History Dr. Steve Carey Dr. Haraldur Sigurdsson, both at Univ. Rhode Island,
Winter. Here s what a weak La Nina usually brings to the nation with tempseraures:
 2017-2018 Winter Time again for my annual Winter Weather Outlook. Here's just a small part of the items I considered this year and how I think they will play out with our winter of 2017-2018. El Nino /
Pacific Decadal Oscillation ( PDO ):
:") Time again for my annual Winter Weather Outlook. Here's just a small part of the items I considered this year and how I think they will play out with our winter of 2015-2016. El Nino / La Nina: When looking
Time again for my annual Winter Weather Outlook. Here's just a small part of the items I considered this year and how I think they will play out with our winter of 2015-2016. El Nino / La Nina: When looking
3/24/2016. Geology 12 Mr. M. Gauthier 24 March 2016
 Geology 12 Mr. M. Gauthier 24 March 2016 Introduction: Mt. St. Helens Before 1980 Mt. St Helens, in Southern Washington State, had not erupted since 1857 On March 27,1980 minor ashand eruptions were due
University of Bristol - Explore Bristol Research. Publisher's PDF, also known as Version of record
 Woodhouse, M. J., Hogg, A. J., Phillips, J. C., & Sparks, R. S. J. (2013). Interaction between volcanic plumes and wind during the 2010 Eyjafjallajokull eruption, Iceland. Journal of Geophysical Research:
Seasonal Climate Watch June to October 2018
 Seasonal Climate Watch June to October 2018 Date issued: May 28, 2018 1. Overview The El Niño-Southern Oscillation (ENSO) has now moved into the neutral phase and is expected to rise towards an El Niño
Natural Hazards Mitigation in Iceland
 Natural Hazards Mitigation in Iceland With special emphasis on earthquake risk Júlíus Sólnes Professor of civil and environmental engineering Dept. of engineering, University of Iceland Cambridge, 19th
FINAL EXAM December 20 th, here at 1:00 3:00 pm
 FINAL EXAM December 20 th, here at 1:00 3:00 pm REVIEW SESSION December 11 th at 6:00-7:30 pm Morrill I Auditorium (Room N375) Same as last time Don t forget your online course evaluations! Major Volcanic
Name: Earth Science Date:
 Name: Earth Science Date: Lab Report: Plate Tectonics Data: Submit the Mid- Atlantic Seafloor Profile Maps (from Divergent Plate Boundary Lab) on and the Convergent Plate Boundary Data Page. (6 points)
Volcanoes. Table of Contents Volcanoes and Plate Tectonics Volcanic Eruptions Volcanic Landforms
 Volcanoes Table of Contents Volcanoes and Plate Tectonics Volcanic Eruptions Volcanic Landforms What is a volcano? cone Conduit Or Pipe vent Side vent Central vent Crater A volcano is a vent or 'chimney'
GEOL1 Physical Geology Laboratory Manual College of the Redwoods Lesson Five: Volcanoes Background Reading: Volcanoes Volcanic Terms: Silca:
 Name: Date: GEOL1 Physical Geology Laboratory Manual College of the Redwoods Lesson Five: Volcanoes Background Reading: Volcanoes Volcanic Terms: Silca: SiO 2 silicon dioxide. This is quartz when it crystallizes.
An Introduction to Coupled Models of the Atmosphere Ocean System
 An Introduction to Coupled Models of the Atmosphere Ocean System Jonathon S. Wright jswright@tsinghua.edu.cn Atmosphere Ocean Coupling 1. Important to climate on a wide range of time scales Diurnal to
( ) USGS (United States Geological Survey) Watch Green. Normal. alert level 1 Normal
 USGS (United States Geological Survey) Watch Green. Normal. alert level 1 Normal") (200610.1) USGS (United States Geological Survey) 1014 alert level 1 Normal Watch Green Normal USGS WARNING WATCH ADVISORY NORMAL SUMMARY OF VOLCANIC-ALERT LEVELS Highly hazardous eruption underway or
(200610.1) USGS (United States Geological Survey) 1014 alert level 1 Normal Watch Green Normal USGS WARNING WATCH ADVISORY NORMAL SUMMARY OF VOLCANIC-ALERT LEVELS Highly hazardous eruption underway or
WHEN IS A SURGE NOT A SURGE? THAT IS THE PERPLEXING QUESTION. (for emergency managers)
") WHEN IS A SURGE NOT A SURGE? THAT IS THE PERPLEXING QUESTION (for emergency managers) Mount St Helens, May 18, 1980 37 years, 5 months, and 6 days ago.. Eyewitnesses there were many! Rosenbaum and Waitt,
WHEN IS A SURGE NOT A SURGE? THAT IS THE PERPLEXING QUESTION (for emergency managers) Mount St Helens, May 18, 1980 37 years, 5 months, and 6 days ago.. Eyewitnesses there were many! Rosenbaum and Waitt,
RSMC WASHINGTON USER'S INTERPRETATION GUIDELINES ATMOSPHERIC TRANSPORT MODEL OUTPUTS
 RSMC WASHINGTON USER'S INTERPRETATION GUIDELINES ATMOSPHERIC TRANSPORT MODEL OUTPUTS -Version 2.0- (January 2007) 1. Introduction In the context of current agreements between the National Oceanic and Atmospheric
A probabilistic approach for landslide hazard analysis
 A probabilistic approach for landslide hazard analysis S. Lari, P. Frattimi, G.B. Crosta Engineering Geology 182 (2014) 3-14 報告者 : 符智傑 指導教授 : 李錫堤老師 報告日期 :2016/05/05 Introduction A general framework for
New A-Level Physical Geography
 Half Term 1 3.1 Physical Geography: 3.1.5 Hazards: Plate Tectonics This optional section of our specification focuses on the lithosphere and the atmosphere, which intermittently but regularly present natural
Will a warmer world change Queensland s rainfall?
 Will a warmer world change Queensland s rainfall? Nicholas P. Klingaman National Centre for Atmospheric Science-Climate Walker Institute for Climate System Research University of Reading The Walker-QCCCE
GEOS 606 Physical Volcanology GEOS 606 CRN credits
 GEOS 606 Physical Volcanology GEOS 606 CRN 74060 3 credits September 1th December 17 th, 2011 Mondays, Wednesdays and Fridays MWF 10:30-11:30 Irving 208 and Elvey 101 Dr. Jonathan Dehn office: WRRB 108G,
Here s what a weak El Nino usually brings to the nation with temperatures:
 Time again for my annual Winter Weather Outlook. Here's just a small part of the items I considered this year and how I think they will play out with our winter of 2018-2019. El Nino / La Nina: When looking
Julie Fero NRS 509. Mapping Volcanic Risk with GIS
 Julie Fero NRS 509 Mapping Volcanic Risk with GIS Introduction Volcanoes are present throughout the world, generally occurring along plate margins, making the entire world prone to volcanic influence,
Climate forcing volcanic eruptions: future extreme event occurrence likelihoods
 Climate Change and Extreme Events: Managing Tail Risks Workshop 2 3 February 2010 Washington DC Climate forcing volcanic eruptions: future extreme event occurrence likelihoods Willy Aspinall with apologies
Vulcanicity. Objectives to identify the basic structure of volcanoes and understand how they form.
 Vulcanicity Objectives to identify the basic structure of volcanoes and understand how they form. Some key terms to start.. Viscosity how well a substance (lava) flows. Acid lavas have a high viscosity,
Engineering Geology ECIV 2204
 Engineering Geology ECIV 2204 2017-2016 Chapter (4) Volcanoes Chapter 4: Volcanoes and Other Igneous Activity cataclysmic relating to or denoting a violent natural even Eventually the entire
The benefits and developments in ensemble wind forecasting
 The benefits and developments in ensemble wind forecasting Erik Andersson Slide 1 ECMWF European Centre for Medium-Range Weather Forecasts Slide 1 ECMWF s global forecasting system High resolution forecast
PRMS WHITE PAPER 2014 NORTH ATLANTIC HURRICANE SEASON OUTLOOK. June RMS Event Response
 PRMS WHITE PAPER 2014 NORTH ATLANTIC HURRICANE SEASON OUTLOOK June 2014 - RMS Event Response 2014 SEASON OUTLOOK The 2013 North Atlantic hurricane season saw the fewest hurricanes in the Atlantic Basin
Chapter Introduction Lesson 1 Earthquakes Lesson 2 Volcanoes Chapter Wrap-Up
 Chapter Introduction Lesson 1 Earthquakes Lesson 2 Volcanoes Chapter Wrap-Up What causes earthquakes and volcanic eruptions? What do you think? Before you begin, decide if you agree or disagree with each
Volcano - A Volcano is an opening in the Earth s surface through which molten material or volcanic gases are erupted.
 What is a Volcano? Volcano - A Volcano is an opening in the Earth s surface through which molten material or volcanic gases are erupted. A volcano can either be a classic volcanic cone.. Mt. St. Helens,
Volcanism (Chapter 5)
") GEOLOGY 306 Laboratory Instructor: TERRY J. BOROUGHS NAME: Volcanism (Chapter 5) For this assignment, you will require: a calculator, colored pencils, string, protractor, stereoscopes (provided). Objectives
GEOLOGY 306 Laboratory Instructor: TERRY J. BOROUGHS NAME: Volcanism (Chapter 5) For this assignment, you will require: a calculator, colored pencils, string, protractor, stereoscopes (provided). Objectives
ENSO Cycle: Recent Evolution, Current Status and Predictions. Update prepared by Climate Prediction Center / NCEP 23 April 2012
 ENSO Cycle: Recent Evolution, Current Status and Predictions Update prepared by Climate Prediction Center / NCEP 23 April 2012 Outline Overview Recent Evolution and Current Conditions Oceanic Niño Index
INTRODUCTION TO TEPHROCHRONOLOGY
 ENEGeol 2017 - PART 1 INTRODUCTION TO TEPHROCHRONOLOGY Eruption of Chaiten, 2008 Tephra is an all-embracing term for the explosively erupted, loose fragmental (pyroclastic) products of a volcanic eruption,
Erupted and killed approximately 15,000 people 200 years ago
 1 2 3 4 5 6 7 8 Introduction to Environmental Geology, 5e Chapter 8 Volcanic Activity Volcanoes: summary in haiku form A volcano forms. Magma comes to the surface - explodes, if felsic. Case History: Mt.
Tectonic Processes and Hazards Enquiry Question 1: Why are some locations more at risk from tectonic hazards?
 Tectonic Processes and Hazards Enquiry Question 1: Why are some locations more at risk from tectonic hazards? Key words Basalt Andesite Rhyolite Benioff Zone Subduction zone Crustal fracturing Definition
ENSO Cycle: Recent Evolution, Current Status and Predictions. Update prepared by Climate Prediction Center / NCEP July 26, 2004
 ENSO Cycle: Recent Evolution, Current Status and Predictions Update prepared by Climate Prediction Center / NCEP July 26, 2004 Outline Overview Recent Evolution and Current Conditions Oceanic NiZo Index
Chapter 5 9/10/2011. Introduction. Volcanoes and Volcanism. Volcanism. Introduction. Introduction. Introduction
 Introduction Chapter 5 Volcanism is the eruption of magma, and associated gases at the surface. Some magma erupts explosively as pyroclastic (fire-broken) rock and other erupts as lava flows. Volcanoes
Prediction of Snow Water Equivalent in the Snake River Basin
 Hobbs et al. Seasonal Forecasting 1 Jon Hobbs Steve Guimond Nate Snook Meteorology 455 Seasonal Forecasting Prediction of Snow Water Equivalent in the Snake River Basin Abstract Mountainous regions of
ENSO: Recent Evolution, Current Status and Predictions. Update prepared by: Climate Prediction Center / NCEP 30 October 2017
 ENSO: Recent Evolution, Current Status and Predictions Update prepared by: Climate Prediction Center / NCEP 30 October 2017 Outline Summary Recent Evolution and Current Conditions Oceanic Niño Index (ONI)
M 7.2 Earthquake along Iraq Iran border Sunday, November 12, Close to boundary of the Arabian and Eurasian Plates
 M 7.2 Earthquake along Iraq Iran border Sunday, November 12, 2017 Close to boundary of the Arabian and Eurasian Plates Length of Lava Flows Since the path of a lava flow is controlled by topography it
Modelling trends in the ocean wave climate for dimensioning of ships
 Modelling trends in the ocean wave climate for dimensioning of ships STK1100 lecture, University of Oslo Erik Vanem Motivation and background 2 Ocean waves and maritime safety Ships and other marine structures
Clough Award 2017 Katmai and the Valley of Ten Thousand Smokes
 Clough Award 2017 Katmai and the Valley of Ten Thousand Smokes In June 2017, Clough Award funding allowed me to participate in the International Volcanology Summer School, organised by University of Alaska
LECTURE #11: Volcanic Disasters: Lava Properties & Eruption Types
 GEOL 0820 Ramsey Natural Disasters Spring, 2018 LECTURE #11: Volcanic Disasters: Lava Properties & Eruption Types Date: 13 February 2018 I. Exam I grades are posted on the class website (link at the bottom
Continuous Caldera Changes in Miyakejima Volcano after Hiroyuki HASEGAWA, Hiroshi P. SATO and Junko IWAHASHI
 Continuous Caldera Changes in Miyakejima Volcano after 2001 60 Hiroyuki HASEGAWA, Hiroshi P. SATO and Junko IWAHASHI Abstract This study investigated the evolvement of the caldera at Miyakejima volcano
ENSO: Recent Evolution, Current Status and Predictions. Update prepared by: Climate Prediction Center / NCEP 9 November 2015
 ENSO: Recent Evolution, Current Status and Predictions Update prepared by: Climate Prediction Center / NCEP 9 November 2015 Outline Summary Recent Evolution and Current Conditions Oceanic Niño Index (ONI)
Lab Report: Plate Tectonics Data: Submit the Convergent Plate Boundary Data Page. (6 points)
") Name: Earth Science Date: Lab Report: Plate Tectonics Data: Submit the Convergent Plate Boundary Data Page. (6 points) Conclusion: 1. The diagram below shows both a spreading zone and a subduction zone
Name: Earth Science Date: Lab Report: Plate Tectonics Data: Submit the Convergent Plate Boundary Data Page. (6 points) Conclusion: 1. The diagram below shows both a spreading zone and a subduction zone
Volcanism Activity. Choose one of the options below to complete for tomorrow. You may work with a partner on this activity. Be creative and realistic!
 Volcanism Activity Choose one of the options below to complete for tomorrow. You may work with a partner on this activity. Be creative and realistic! Option 1 Option 2 Option 3 Create a comic strip or
B-1. Attachment B-1. Evaluation of AdH Model Simplifications in Conowingo Reservoir Sediment Transport Modeling
 Attachment B-1 Evaluation of AdH Model Simplifications in Conowingo Reservoir Sediment Transport Modeling 1 October 2012 Lower Susquehanna River Watershed Assessment Evaluation of AdH Model Simplifications
Volcanoes. 11/25/2013. Geology 15 Lecture 27 VOLCANO!
 Hazard Update Surprise POP Review Tsunami Activity 10 B Today s Material Volcanoes Volcanic Hazards Geology 15 Lecture 27 VOLCANO! http://motherboard.vice.com/blog/watch an erupting volcano create a newisland
Climate Outlook through 2100 South Florida Ecological Services Office Vero Beach, FL September 9, 2014
 Climate Outlook through 2100 South Florida Ecological Services Office Vero Beach, FL September 9, 2014 Short Term Drought Map: Short-term (
Debris Avalanches. Debris avalanche deposits on a volcano in Chile. All of the area in the foreground is buried by a thick debris avalanche.
 Debris Avalanches Volcanoes are not very stable structures. From time to time, they collapse producing large rock and ash avalanches that travel at high speeds down valleys. Collapse maybe caused by an
A B C D PROBLEMS Dilution of power plant plumes. z z z z
 69 PROBLEMS 4. Dilution of power plant plumes Match each power plant plume (-4) to the corresponding atmospheric lapse rate (A-D, solid lines; the dashed line is the adiabatic lapse rate Γ). Briefly comment
1.0 Introduction 1.1 Geographic Location 1.2 Topography 1.3 Climate and Rainfall 1.4 Geology and Hydrogeology 1.5 Water Availability 1.
 1.0 1.1 Geographic Location 1.2 Topography 1.3 Climate and Rainfall 1.4 Geology and Hydrogeology 1.5 Water Availability 1.6 Demography 1.0 1.1 Geographic Location St. Lucia forms part of an archipelago
What is the threat? Sue Loughlin and Julia Crummy British Geological Survey. NERC All rights reserved NERC All rights reserved
 What is the threat? Sue Loughlin and Julia Crummy British Geological Survey BATA Conference, London 15 th October 2013 What is a volcano? Where and how many? There are more than 1500 known potentially
IMPACT OF AEROSOLS FROM THE ERUPTION OF EL CHICHÓN ON BEAM RADIATION IN THE PACIFIC NORTHWEST
 IX. IMPACT OF AEROSOLS FROM THE ERUPTION OF EL CHICHÓN ON BEAM RADIATION IN THE PACIFIC NORTHWEST The eruptions of the Mexican volcano El Chichón over the period of March 28 to April 4, 1982 ejected an
Visualizing Earth Science. Chapter Overview. Volcanoes and Eruption Types. By Z. Merali and B. F. Skinner. Chapter 9 Volcanism and Other
 Visualizing Earth Science By Z. Merali and B. F. Skinner Chapter 9 Volcanism and Other Igneous Processes Volcanoes types and effects of eruption Chapter Overview Melting and cooling of rocks Geological
Multiple Choice Identify the letter of the choice that best completes the statement or answers the question.
 volcano sample test Multiple Choice Identify the letter of the choice that best completes the statement or answers the question. 1. Volcanic belts form along a. islands in the Pacific Ocean. b. North American