Historical Sedimentation at the Mouths of Five Deltas on Peoria Lake
|
|
|
- Mercy Peters
- 6 years ago
- Views:
Transcription
1 Contract Report Historical Sedimentation at the Mouths of Five Deltas on Peoria Lake by Nani G. Bhowmik, Erin Bauer, William C. Bogner, and Mike Demissie Principal Investigator Nani G. Bhowmik Prepared for the Illinois Department of Natural Resources June 2001 Illinois State Water Survey Watershed Science Section Champaign, Illinois A Division of the Illinois Department of Natural Resources
2 Historical Sedimentation at the Mouths of Five Deltas on Peoria Lake Contract Report Prepared by: Illinois State Water Survey Watershed Science Section 2204 Griffith Drive Champaign, Illinois Principal Investigator Nani G. Bhowmik Contributors: Nani G. Bhowmik, Erin Bauer, William C. Bogner, and Misganaw Demissie Report Prepared for the: Illinois Department of Natural Resources June 2001 i
3 This report was printed on recycled and recyclable papers. ii
4 Historical Sedimentation at the Mouths of Five Deltas on Peoria Lake By Nani G. Bhowmik, Erin Bauer, William C. Bogner, and Misganaw Demissie Watershed Science Section Illinois State Water Survey Abstract This report summarizes the results of surveying conducted at the mouths of five deltas on Peoria Lake in The five deltas are at the mouths of Richland Creek, Partridge Creek, Blue Creek, Dickison Run, and Farm Creek. All surveying was done to include the planform of the deltas that existed in The 1999 planform of four of the five deltas except Dickison Run is different than the locations in In order to estimate the volumes of deposited sediment between and 1999, a grid was developed encompassing the aerial extent of the 1999 delta. Subsequently, computations determined the net volumetric accumulation of sediment within each grid for each delta: 2,683 acre-feet (Partridge Creek), 1,495 acre-feet (Blue Creek), 1,428 acre-feet (Richland Creek), 1,252 acre-feet (Farm Creek), and 338 acre-feet (Dickison Run). Relative values of the sediment accumulation could be quite misleading since most of these creeks have been altered over the last 100 years, the 1999 outlets are not at the same locations as those that existed in , and a significant amount of sand-and-gravel mining took place at several locations such as at Farm Creek. Still these values provide a significant contribution toward the understanding of the relative magnitudes of sediments being deposited at the mouths of these five deltas. Keywords: Peoria Lake, Illinois River, delta, sediment deposition, tributary, sediment iii
5 iv
6 Contents Page Introduction and Background... 1 Acknowledgments... 5 Objectives... 5 Site Selection... 6 Limitations... 6 Historical Analysis... 6 Richland Creek... 8 Partridge Creek... 9 Blue Creek Dickison Run Farm Creek Contour Development Methodology Surveying Methodology Water-Level Contouring Hydrographic Survey Data Analysis Elevation Data Grid Development and 1999 Contour Maps Richland Creek Delta Partridge Creek Delta Blue Creek Delta Dickison Run Delta Farm Creek Delta Sedimentation at Delta Mouths Stage-Area and Stage-Volume Relationships Unit Weight and Moisture Content Summary References Appendix. Historical Aerial Photographs of the Five Selected Deltas AA R1 to R8 Aerial Views of the Richland Creek Delta AA P1 to P8 Aerial Views of the Partridge Creek Delta AA B1 to B7 Aerial Views of the Blue Creek Delta AA D1 to D5 Aerial Views of the Dickison Creek Delta AA F1 to F7 Aerial Views of the Farm Creek Delta v
7 List of Figures Page Figure 1. Drainage basin of the Illinois River above Peoria Lock and Dam at RM and the profile of the Illinois River Waterway... 2 Figure 2. Aerial photographs of Peoria Lake taken in Figure 3. Major tributaries of Peoria Lake... 4 Figure 4. Drainage basin of the five tributaries with the 1999 surveyed delta areas... 7 Figure cross sections along the spine of each delta and the extent of the 1999 survey grid area for each delta Figure contour map of Richland Creek delta area Figure survey data, route, and grid extent for Richland Creek delta Figure contour map of Richland Creek delta within grid area Figure contour map of Partridge Creek delta area Figure survey data, route, and grid extent for Partridge Creek delta Figure contour map of Partridge Creek delta within grid area Figure contour map of Blue Creek delta area Figure survey data, route, and grid extent for Blue Creek delta Figure contour map of Blue Creek delta within grid area Figure contour map of Dickison Run delta area Figure survey data, route, and grid extent for Dickison Run delta Figure contour map of Dickison Run delta within grid area Figure 18a contour map of Farm Creek delta area, including the surveyed area of the 1999 Farm Creek delta Figure 18b contour map of the location of the 1999 Farm Creek delta area vi
8 List of Figures (concluded) Page Figure survey data, route, and grid extent for Farm Creek delta Figure contour map of Farm Creek delta within grid area Figure 21. Lateral cross section at 1999 spine of Blue Creek delta Figure 22. Elevation versus surface area and elevation versus volume relationships for a) Richland Creek delta, b) Partridge Creek delta, c) Blue Creek delta, d) Dickison Run delta, and e) Farm Creek delta List of Tables Page Table 1. Tributary Streams of Peoria Lake with Respective Drainage Areas... 5 Table 2. Water-Level Elevation (feet) of Peoria Lake during 1999 Delta Surveying, Elevations in NGVD Table 3. Summary of Grid Area Information Table 4. Net Sediment Accumulation at the 1999 Delta Mouths within the Grid Area Table 5. Sediment Accumulation Rates within the Grid Area, Table 6. Peoria Lake Sediment Analyses: Spindler Marina Dredging Project vii
9 viii
10 Introduction and Background Peoria Lake, located between River Mile (RM) 160 and RM 180 on the Illinois River, is the largest bottomland lake along the Illinois River. Figure 1 shows the drainage basin of the Illinois River at Peoria Lock and Dam. The total drainage area at the lock and dam is approximately 14,165 square miles. Figure 1 also shows the profile of the Illinois River, including the location of locks and dams. Over the years, Peoria Lake has experienced a significant amount of sediment deposition (Demissie and Bhowmik, 1986). Demissie and Bhowmik (1986) showed that Peoria Lake has the highest sedimentation rate of all lakes in Illinois, and that it had lost 68 percent of its 1904 capacity by One of the many causative factors in the high sedimentation rate of this lake is the sudden change in the gradient of the Illinois River at the upper end of the lake (Figure 2). The gradient changes from feet per mile above Peoria Lake to feet per mile near the lake, which accelerates sediment deposition within the lake. Moreover, the Illinois River below DePue (Figure 1) is the remnant channel of the old Mississippi River. The high flow of the old Mississippi River created the broad Illinois River channel and valley below DePue. The present flow of the river is much less than that of the old Mississippi River. Thus, the channel is aggrading naturally and attempting to establish a new dynamic equilibrium under the present flow and sediment regime. Hydrographic mapping in 1996 by the Rock Island District of the U.S. Army Corps of Engineers has shown that the capacity loss of Peoria Lake at that time could be as much as 80 percent or more. Bhowmik et al. (1993) showed that during a drought Water Year, such as in 1989, about 75 percent of the sediment input to Peoria Lake is contributed by the main stem of the Illinois River and another 25 percent is contributed by all the tributaries. In an average Water Year, such as 1990, the main stem of the Illinois River contributed only about 50 percent of the total sediment load; the remaining 50 percent came from the local tributaries. This becomes very important when one considers the fact that the drainage area of the local tributaries comprises only about 4 percent of the total drainage area, yet 50 percent of the total sediment is contributed by these tributaries in an average year. For the drought Water Year 1989, Bhowmik et al. (1993) estimated that about 65 percent of the total sediment loads contributed by local tributaries came from the bed load. Aerial photographs of Peoria Lake taken in 1988 show that almost all the deltas have grown over the last 60 years (see Appendix). Field inspection also has shown that the main bed materials of most deltas are sand and gravel. It is clear that the local tributaries have contributed a significant amount of coarse-grained materials to Peoria Lake, which has increased the sediment deposition rates in the nearshore areas of the lake. There are at least ten major tributaries to Peoria Lake. Figure 2 shows aerial photographs of Peoria Lake with deltas created by some of the lake s tributaries. Figure 3 shows the major tributaries of Peoria Lake. The drainage areas of these tributaries vary from about 2.8 square miles to about 130 square miles with about 57.8 square miles contributed by the unnamed minor tributaries. Table 1 gives drainage areas of the major tributaries (Bhowmik et al., 1993). 1
11 WISCONSIN Lake Michigan IOWA R INDIANA N ILLINOIS SCALE OF KILOMETERS Lockport Pool 550 Brandon Road Pool Dresden Island Pool MISSOURI Lock and Dam Marseilles Pool Starved Rock Pool Alton Pool LaGrange Pool THALWEG Peoria Pool MILES ABOVE MOUTH Figure 1. Drainage basin of the Illinois River above Peoria Lock and Dam at RM 157.8, and the profile of the Illinois River Waterway 2


12 Figure 2. Aerial photographs of Peoria Lake taken in
13 Figure 3. Major tributaries of Peoria Lake 4
14 Table 1. Tributary Streams of Peoria Lake with Respective Drainage Areas Stream Drainage Area (square mile) Crow Creek Dry and Richland Creek 47.0 Partridge Creek 28.0 Blue Creek 10.5 Funk s Run 5.4 Tenmile Creek 17.6 Senachwine Creek 85.0 Dickison Run 7.9 Farm Creek 60.0 Blalock Creek 2.8 Unnamed tributaries 57.8 Total drainage area Acknowledgments This material is based upon work supported by a the Department of Natural Resources under Award No. IL DNR Any opinions, findings, and conclusions or recommendations expressed in this publication are those of the authors and do not necessarily reflect the views of the Illinois Department of Natural Resources. John Marlin, Waste Management Research and Information Center, served as the Project Manager. The Rock Island District of the U.S. Army Corps of Engineers provided the Woermann Maps. Eva Kingston edited the report, Linda Hascall provided graphic support and final layout, and Linda Dexter typed the camera-ready copy. Objectives The results presented in this report are a component of a project on Peoria Lake being conducted for the Illinois Department of Natural Resources. The objectives of this component of the project are: a. Survey and map the aerial extent of five deltas as of b. Compute the amount of sediment deposited from 1904 through 1999 within the aerial extent of the 1999 planform shape. 5
15 Site Selection After a review of available aerial photographs, five deltas were selected for their large size and evident sediment contribution to Peoria Lake: Richland Creek, Partridge Creek, Blue Creek, and Farm Creek on the east-side of the lake, and Dickison Run on the west side of the lake. Each delta was surveyed to develop the necessary contour maps of the deltas. Figure 4 shows these tributaries and the aerial extent of the surveyed area. Limitations Before discussing the 1999 survey and its comparison with the Woermann maps, some limitations of these analyses must be stated. Most of the tributary mouths within Peoria Lake have been altered over the last 100 years. It would be nice if the areal extent of the 1999 deltas were at the same locations as those that existed in However, some of the tributary mouths were channelized, diverted, and/or altered, making it difficult to compare the differences in sediment accumulations between and 1999 at the delta mouths that exist today. Moreover, at many locations, significant quantities of sediment were mined, and there is no record of the volumes of these mined areas. Thus a decision was made to concentrate within the areal extent of the 1999 delta and conduct the survey within this area. Also in order to avoid including a very large area, a grid area was developed for each delta that encompassed the 1999 planform of the deltas. Subsequent analyses included in this report will show the volumes of the sediment deposited within each grid area from to 1999 even though some of the tributaries discharged sediment and water at different locations than those existing today. This was the best alternative that could be adopted because the tributaries have been altered significantly. These concepts will further be discussed in subsequent sections. Historical Analysis Over the last 96 years, the tributary and main channel interfaces within Peoria Lake have changed dramatically. A previous report on the sediment inputs to Peoria Lake from local tributaries summarized some of the historical changes observed at the selected deltas (Bhowmik et al., 1993). Some of this text will be repeated in this report. Aerial photographs referenced in this report were taken at different times of the year, and the exact date and/or river stage at the time each photograph was taken were not always available. Still these photographs provide information for qualitative assessments of the aerial extent and variability of the delta forms. This is what has been done for this report. The aerial photographs discussed are given in the Appendix. The maps and photographic sources are: The Woermann maps of the Illinois Waterway from Grafton to Lockport prepared from a survey conducted under direction of the U.S. Army Corps of Engineers or USACOE (Woermann, ). Aerial photography flown under the direction of the U.S. Department of Agriculture- American Soil Conservation Service for the years 1939, 1951, 1957, 1963, and These photographs are available at the University of Illinois Geography Library. 6
16 Figure 4. Drainage basin of the five tributaries with the 1999 surveyed delta areas 7
17 Aerial photography flown under the direction of the Soil Conservation Service, Aerial photography flown under the direction of the Illinois Department of Transportation (IDOT) for Color infrared aerial photography from 1994 flown under the direction of the United States Geological Survey (USGS) managed by the Upper Mississippi River Environmental Management Technical Center (UMRE-EMTC), Onalaska, Wisconsin. These maps are available on the Web page of the UMRE-EMTC ( illinois/peoria/peo_air_photos.html). During the late 1900s, the natural stream channels of these deltas changed courses periodically, which formed braided channels on the delta and distributed sediment in a broad, fan-shape at the outlet of the channel (see Appendix). Where these deltas form in back areas of Peoria Lake, they develop in textbook fashion, with the stream channel swinging from side to side to form a braided channel planform. Where the stream mouth flows into the main Illinois River channel, the river washes out the delta thus limiting the rate of apparent growth (Bhowmik et al., 1993, p. 35). The stream channel and outlet locations of four of the five deltas have changed dramatically since 1904, and they were not within the grid area defined by the horizontal extent of the 1999 delta. Construction projects were implemented in the 1930s and 1940s to permanently direct and channelize Richland Creek, Partridge Creek, Blue Creek, and Farm Creek (Bhowmik et al., 1993) directly toward the river. New, substantial-sized, elongated delta forms were later observed along the Peoria Lake shoreline. A brief review of the channelization, development, and recent growth of these tributaries will be discussed for each of the five deltas. Richland Creek The Richland Creek channel and outlet have changed dramatically since the early 1900s. Richland Creek and Dry Creek..were originally separate with end points approximately one mile apart. The Woermann survey indicated no distinct outlet for either creek. The 1937 quad shows Dry Creek diverted south to an outlet into the lake, but Richland Creek still shows no outlet (Bhowmik et al., 1993, p. 37). This is clearly indicated in the 1939 photograph of Richland Creek (R1 in Appendix). Channel change permits for Richland Creek were issued by IDOT in , and the 1951 photos show the two creeks channelized, with a combined channel flowing into their current outlet [R2 in Appendix]. Delta growth was apparent in 1951, 8
18 and a developed delta with vegetation and a braided outlet appears in the 1957 photograph [R2-R3 in Appendix]. In 1963, the delta had a defined channel and a large wooded area [R4 in Appendix]. Growth rates seemed to slow from 1963 to 1969, and the delta was fairly stable from 1969 to 1985 [R4-R7 in Appendix, the 1985 photograph was not available]. The delta developed in very shallow water depths, and its growth may have been halted by a combination of increased above-water-level deposition and a change in water depth in the active growth area of the delta (Bhowmik et al., 1993, p. 37). Growth analysis of Richland Creek delta based on the Woermann maps and the 1978 USACOE orthophoto maps found that the volume of the delta had grown by 858 acrefeet during this period (Bhowmik et al., 1993). Between 1974 and 1988, the delta area north of the stream channel may have undergone additional levee construction or improvements (R7 in Appendix). This area is a Waterfowl Management Area. By 1994, the stream channel had developed a horseshoe-like bend to the north near the end of the delta (R8 in Appendix). Stream flow and sediment are directed toward an old early 1900s era levee and channel. The 1994 aerial photograph shows the region within the bend of the stream channel and the levee filled with sediment or leveed and vegetated. Partridge Creek Growth analysis of Partridge Creek delta from the Woermann maps and the 1978 USACOE orthophoto maps found that the volume of the delta had grown by 1,280 acre-feet during this period (Bhowmik et al., 1993). The Woermann maps show Partridge Creek flowing along the north side of Illinois Route 26 to discharge into the lake with Blalock Creek [to be discussed later]. The 1937 quad shows the creek following its approximate present course but with no well-defined outlet. The 1939 photography shows a similar condition with no shoreline disturbance [P1 in Appendix]. Illinois Department of Transportation permit files indicate that a drainage permit was issued to the Partridge Creek Mutual Drainage District in By 1951, the creek had been channelized and a delta was developing [P2 in Appendix]. The 1957 photographs indicate a braided channel distributing sediment throughout the delta with very little areal growth [P3 in Appendix]. In 1963, the flow across the delta had been channelized and the delta showed new growth [P4 in Appendix]. This channel continued to grow through 1985 as the creek cut new channels and extended itself by branching into new areas (Bhowmik et al., 1993, p. 37). This growth is apparent by comparing the 1969 view of P5 (see Appendix) and the 1974 view of P6 (see Appendix); the 1985 view is no longer available. The delta appears to have 9
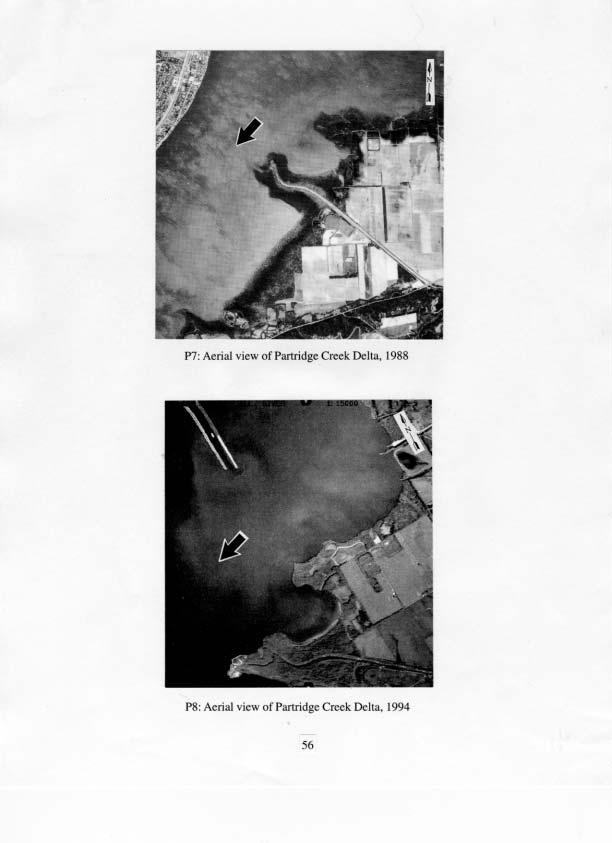
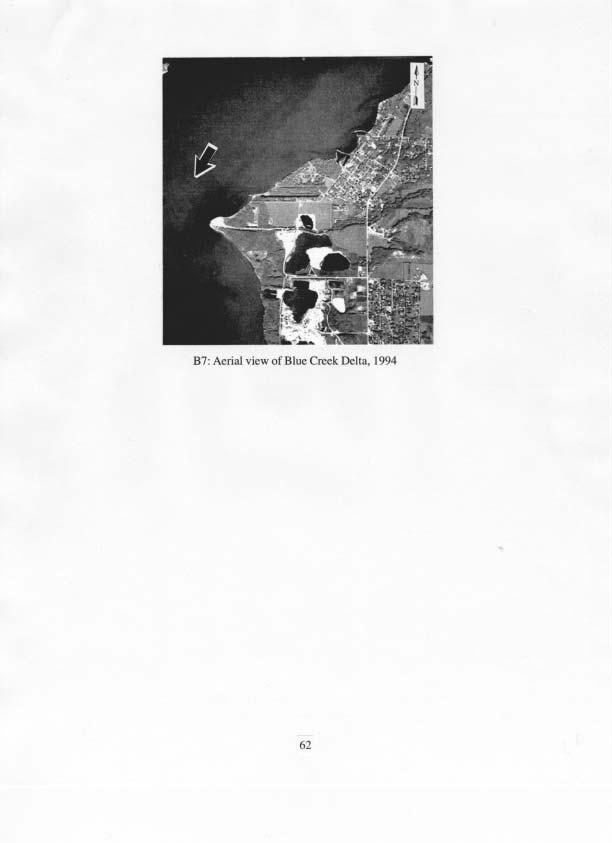
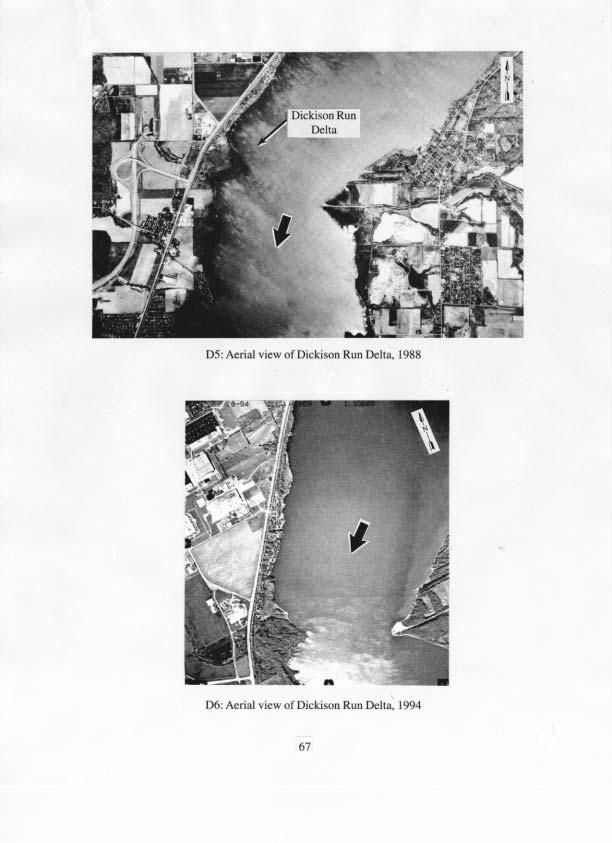
19 grown substantially between 1974 and 1994 (P6-P8 in Appendix). During this time, the stream channel developed some broad bends, a horseshoe-like bend in its midsection, and braided channel outlets on the unvegetated delta growth of the tip. Blue Creek Growth analysis of Blue Creek delta from the Woermann maps and the 1978 USACOE orthophoto maps found that the volume of the delta had grown by 972 acre-feet during this period (Bhowmik et al., 1993). In 1957, the creek was subjected to major channelization. The outlet was moved 700 to 800 feet to the north. The older delta deposits appear stable and a new delta is forming [B1-B3 in Appendix]. The delta grew rapidly (from that time) through 1963, and the channel appeared to be braided in 1963 and 1969 [B4 in Appendix]. No major growth is apparent from 1963 to By 1979, a channel had been dredged across the delta and renewed growth is apparent [B5 for 1974 photograph in Appendix]. In 1985, continued growth of this delta appeared to be limited by proximity to the main channel (Bhowmik et al., 1993, p. 37). Recent aerial photographs indicate that the delta has continued to extend into the river (B6 and B7 in Appendix). Dickison Run The Woermann maps do not indicate a distinct stream channel across the delta to the river (Woermann, ). The 1933 quadrangle and the 1939 aerial photograph reveal a distinct stream channel and outlet (D1 in Appendix). By 1951, significant delta growth is clear beyond the 1939 shoreline. The stream channel is braided across the new delta (D2 in Appendix). By 1957, vegetation appears established on most of the new deposits (D3 in Appendix). By 1974, the delta had broadened to the north and south, and vegetation appears wellestablished (D4 in Appendix). The only indication of the old 1957 stream channel in the 1974 photograph is a slight variation in the vegetation. The delta channel and braided outlet are no longer visible. From 1974 to 1988, no significant growth is apparent (D5 in Appendix). Traces of the stream channel and outlet are not visible in 1994 aerial photography (D6 in Appendix). During a field inspection in 1999 under high river stage conditions, a well-defined stream channel was not found. Stream flow was dispersed across a wide (~300 feet), well-vegetated portion of the southwestern side of the delta (D6 in Appendix). 10
20 Farm Creek The Woermann map (Woermann, ) and a 1905 U.S. Geological Survey quadrangle map indicate that the outlet of Farm Creek was 0.25 miles south of the Franklin Street Bridge. In the late 1920s, a relief channel was built by the East Peoria Sanitary District to reduce flooding by the constricted main channel. This diversion channel was further modified in the late 1930s by the Sanitary District and in the mid-1950s by the Corps of Engineers. Aerial photography indicates that by 1939 the diversion channel had created obvious delta deposits at the outlet [as shown in F1 in Appendix]. By 1964, the diversion outlet was shifted several hundred feet north during the construction of Interstate 74, and new delta growth was taking place [F2 and F3 in Appendix]. From 1963 to at least 1979, the delta developed in Lower Peoria Lake and was separated from the main channel by a naturally formed sandbar [F3-F5 in Appendix]. In 1985, this older channel was blocked off and a new channel was flowing directly into the main channel (Bhowmik et al., 1993, p. 36). By 1988, new delta growth at the outlet of the new channel was apparent (F6 in Appendix). By 1994, considerable delta growth had occurred on the downstream side of the stream outlet (F7 in Appendix). The old stream channel was still visible, and some delta growth was evident at its braided stream outlet. Contour Development Methodology In 1999, the Illinois State Water Survey collected topographic and hydrographic survey data of the Richland, Partridge, Blue, Dickison Run, and Farm Creek deltas (Figure 5). The surveying techniques followed are described in the following sections. Surveying Methodology Elevation contour information was collected between January and May of 1999 from these five deltas directly draining into Peoria Lake (Figures 4 and 5). These surveys covered the entire areal extent of the delta including those under water. Data collection was performed in two stages. The first stage involved recording the location of the land and water interface (shoreline) at different river stages to determine water-level contours on each delta. The second stage involved hydrographic surveying during high river stage conditions along several radial lines to define the shoreline, extent, and bathymetry of each delta. The methodology and instrumentation are described in the following sections. 11
21 Water-Level Contouring Water-level contours were collected for each delta area for a series of Illinois River stages. The approximate location of the contact point between the 1900-era lakeshore and the deposition area of the delta landform was estimated based on a review of aerial photographs and maps of each delta. For these surveys, a backpack-mounted, differentially corrected Geodetic Positioning System (DGPS) was used to map the stage-specific shoreline of each delta. The GPS positions were differentially corrected using the Radio Technical Commission for Marine Services (RTCM) correction signals broadcast by the U.S. Coast Guard from St. Louis, Missouri, or Rock Island, Illinois, received on an MBX 2/00 Marine Beacon Receiver. Horizontal accuracy of the RTCM-corrected GPS is 1 to 5 meters (CSII, n.d. and LNPD, n.d.). Location data were collected along the water/land interface to the 1990-era lakeshore/delta landform contact point on the opposite side of the delta. The data collection protocol for each targeted river stage and for each delta form proceeded as follows: the survey crew walked along the land/water interface to collect horizontal position information at the edge of the water on a continuous basis or at approximately 50-foot intervals. This method produced a contour outline of each delta at the same water-level elevation for Peoria Lake. Water-level reference marks were measured at the beginning and end of each data collection period to correct for a change in the water elevation during the survey. This procedure was repeated at different water levels, thus producing a series of contour lines at various water levels showing the interface of the land and water surface. Additional data were collected for any dike, berm, or levee features that might assist in the development of surface contours. Plots of the surveyed delta are described in subsequent sections. River stages during data collection for various trips varied from approximately 443 to 448 feet National Geodelic Vertical Datum (NGVD). Vertical control was referenced to temporary reference marks established at the time of each survey. These reference marks were later surveyed to establish vertical control markers. Vertical resolution of the location of the edge of the water was 0.1 to 0.5 feet. The lower vertical resolution resulted from difficulty in locating the land/water interface in areas of loose debris accumulation. In the absence of debris, the vertical resolution was 0.1 feet. Table 2 provides water-level elevations during delta surveying. Table 2. Water-Level Elevation (feet) of Peoria Lake during 1999 Delta Surveying, Elevations in NGVD Land survey Hydrographic surv Tributary February 2-3 February 9-10 February May Richland Creek Partridge Creek Blue Creek Dickison Run Farm Creek
22 Hydrographic Survey The water-level contouring survey at the land/water interface was supplemented by a hydrographic survey during high river stage conditions. The hydrographic survey was conducted using an Odom Hydrographic Systems (OHS, n.d.) MK II fathometer for water depth measurements with a 0.1 foot resolution and an RTCM differentially corrected Leica 9500 GPS (LNPD, n.d.) unit for horizontal control with 1 to 5 meter resolution. All navigation and data logging functions were coordinated using Hypack, a hydrographic survey software. The fathometer was calibrated daily prior to initiating measurements and at the end of the day. The survey plan for the hydrographic portion of the survey for each delta included two boat runs around the perimeter of the delta as well as 5 to 10 radial lines. Perimeter survey runs were made at the edge of the brush line around the delta and on a line approximately 50 to 100 feet out from the brush line. Radials, approximately perpendicular to the brush line, were run from 200 to 300 feet out into the river toward the delta perimeter to define the horizontal extent of the delta relative to the flat lake-bottom or river channel. As needed, a series of lines was run across the tip of the delta to define the location of the most recent deposits Data Analysis Each DGPS delta dataset from the water-level contouring survey performed in 1999 was assigned the water-level elevation corresponding to the river level on the date and at the time of data collection. Hydrographic survey data were processed using Hypack software. Depth data were converted to elevation data with respect to the water-level elevation at the time of the survey. Table 2 provides the lake elevations during hydrographic surveying. All differential GPS (DGPS) and hydrographic data were converted into Geographical Information Systems (GIS) format. Each tributary channel location was delineated and digitized using a combination of the 1999 survey data, the location of the channel on the recent digitally rectified graphic of the USGS quadrangle, and the location of the channel from USGS aerial photographs Elevation Data Baseline elevation data were digitized from the 1904 Woermann map (Woermann, ), contour lines, and water depths. Contour lines and the channel limits within and surrounding the grid areas of each 1999 delta were digitized using Arc/Info software. Grid selection is described in the next section. Lake-bottom contour lines were drawn relative to the Woermann depth data and digitized using Arc/Info software. The 1904 Woermann elevations were converted from Memphis Datum elevations to the National Geodetic Vertical Datum (NGVD) elevations by subtracting feet (McKibbin, 1954). All elevations in this report are relative to NGVD. Grid Development Using Arc/Info software, two elevation grids were developed for each delta, one representing the 1904 elevations and the other representing the 1999 elevations. The horizontal extent of the 1999 survey data was used as a guide to define the grid area for calculating the 13
23 volume of each delta. Comparisons between 1904 and 1999 elevations were based on this grid area even though in some cases the location of the 1904 tributary channel and outlet was dramatically different from its location in 1999 and was not within the grid area. The extent of each cross section from the delta was plotted based on the 1996 cross-sectional data of the Illinois River provided by the USACE. Figure 6 provides the plots along the spine of each delta. The cross section shown is not the standard river cross section. Here the axis of the spine of the delta was extended to the opposite end of the lake, and a river cross-sectional profile along this line was developed. These are the plots shown in Figure At Richland Creek Survey Extent 1996 Cross Section Data Richland Creek Partridge Creek At Partridge Creek 430 Depth (feet) Blue Creek to Dickison Run Blue Creek Dickison Run At Farm Creek Farm Creek Distance (feet) Figure cross sections along the spine of each delta and the extent of the 1999 survey grid area for each delta 14
24 The 1999 elevation grid was derived from the DGPS water-level contouring survey data, the hydrographic survey data, the grid extent for each delta, and the path of the tributary. The 1904 elevation grid was derived from the Woermann contour line data and lake-bottom contours. For some delta grids, additional contours from recent USGS quadrangle contours between DGPS survey data points or control points were added to supplement the input data as needed to produce realistic grid elevation values and slope. Because the 1904 and 1999 grids used the same grid area, they are exactly the same size and shape. The cells of the 1904 and 1999 grids also correspond exactly. Each grid was checked with input data to verify accurate elevation representation. Surface contours were derived from the elevation grids using ArcView software. Generated surface contours from the 1904 grids were compared with the original surveyed contours from the Woermann maps. Surface contours generated from the 1999 grids were compared with the surveyed data and shoreline surveys. The 1999 Blue Creek and Farm Creek grids were adjusted manually to correct for unusual shoreline shapes or regions with dramatically varying slopes that could not be derived from or defined well by the grid. The 1904 and 1999 average grid elevations were compared to determine the net sediment accumulation during the intervening period. Table 3 summarizes characteristics of each grid. The following subsections will describe each of the five surveyed deltas and 1999 Contour Maps Richland Creek Delta Figure 6 shows the 1904 contours of the Richland Creek delta area. This figure also shows the extent of the grid area selected for further analysis. These contours and a few elevation control points were used to determine a mean elevation of the grid area for the era at feet NGVD. The Woermann map clearly indicates the 1904 orientation of Richland Creek to the south of the orientation. Figure 7 shows the 1999 survey routes, including point elevation datapoint locations, water edge contours, and hydrographic survey routes. These data were used to develop a contour map within the grid area for Richland Creek (Figure 8). Based on this contour map, a mean elevation of the delta within this grid was calculated to be feet NGVD, 3.8 feet above the 1904 mean grid elevation given in Table 3. Partridge Creek Delta Figure 9 shows the 1904 Woermann contours of the Partridge Creek delta. Again, the 1999 Partridge Creek location is not the same as in The 1904 contours within the grid area and a few selected elevations were used to determine the mean elevation of the grid area, feet NGVD. 15
25 16 Figure contour map of Richland Creek delta area
26 Figure survey data, route, and grid extent for Richland Creek delta 17
27 Figure contour map of Richland Creek delta within grid area 18
28 Figure contour map of Partridge Creek delta area 19
29 Figure 10 shows the 1999 survey routes including point elevation data point locations, land/water surface interfaces, and the hydrographic survey routes for the Partridge Creek delta. These data were used to develop contour maps for the Partridge Creek delta within the grid area (Figure 11). Based on these contours a mean elevation for the grid area was determined to be feet NGVD, 6.6 feet above the mean 1904 grid elevation given in Table 3. Blue Creek Delta Figure 12 shows the 1904 Woermann contours of the Blue Creek delta area. Similar to the 1904 Richland and Partridge Creeks, the location of Blue Creek in 1904 is some distance from the location of the 1999 Blue Creek and delta. The 1904 mean elevation of the defined grid area for Blue Creek was feet NGVD. The Woermann map indicates the 1904 orientation of Blue Creek to the north is the 1999 orientation. The 1999 grid elevations were generated using the DGPS survey data, the hydrographic elevation data, the path of Blue Creek, the delineation of the water-level contouring survey routes, and the delineation of the 460-foot contour from the USGS quadrangle DRG. Figure 13 shows the data within the grid area. The mean grid elevation for 1999 is feet NGVD. Figure 14 shows the contours derived from the 1999 survey within the grid. Grid elevation contours were adjusted manually to more realistically represent the topography on the irregular shoreline at 440 feet NGVD on the northern flank of the delta and along the irregular topography on the southern flank at 441 feet NGVD. The mean elevation of the grid for 1999 is feet NGVD, 7.4 feet above the mean grid elevation of 1904 (Table 3). Dickison Run Delta Figure 15 shows the 1904 Woermann contours for Dickison Run. The creek essentially did not move from its 1904 orientation. Based on these contours, the mean elevation of the 1904 grid of the Dickison Run delta is feet NGVD. Table 3. Summary of Grid Area Information Average grid Average Sediment Cell Number Grid elevation (NGVD) elevation accumulation size of grid area difference (feet) cells (acres) (feet) (feet) (feet) (acre-feet) Richland Creek , ,428 Partridge Creek , ,683 Blue Creek , ,497 Dickison Run , Farm Creek , ,252 20
30 Grid Area Creek Flow Direction Water Level Contour Survey Route and Data Points Hydrographic Survey Route and Data Points Figure survey data, route, and grid extent for Partridge Creek delta 21
31 Figure contour map of Partridge Creek delta within grid area 22
32 Figure contour map of Blue Creek delta area 23
33 Grid Area Illinois River Blue Creek acreek Flow Direction Water Level Contour Survey Route and Data Points Hydrographic Survey Route Figure survey, route, and grid extent for Blue Creek delta 24
34 Figure contour map of Blue Creek delta within grid area 25
35 Figure contour map of Dickison Run delta area 26
36 The 1999 grid elevations were generated using the following: the 1999 DGPS survey data, the hydrographic elevation data, the path of Dickison Run, the delineation of the water-level contouring survey routes, the delineation of the 470-foot contour lines from the USGS quadrangle DRG, and additional contours between DGPS points from the hydrographic survey. Figure 16 shows locations where field data were collected in Figure 17 shows 1999 contours developed from the collected data. Contours shown in Figure 17 were used to determine the mean grid elevation, feet NGVD. This mean elevation is 2.0 feet higher than the 1904 mean elevation for the grid area (Table 3). The 1904 and 1999 paths of Dickison Run are included in the generation of the grids to specify the direction and location of streamflow toward the grid area even though neither could be defined within the grid area. As mentioned previously, a clear-cut channel for Dickison Run on the delta could not be located during the 1999 field survey. Farm Creek Delta Figure 18 shows the 1904 Woermann contours of the Farm Creek delta area. Again, the location of Farm Creek in 1999 is not the same as in The path of the 1904 Farm Creek was not included in the grid because the creek did not flow through or toward the 1999 grid area in The mean grid elevation in 1904 was feet NGVD. The area of the Farm Creek delta is the only one of the five deltas surveyed in this study that has been subjected to urban development pressures. The grid used to define the 1999 delta was developed around features such as a cinder disposal area, Interstate 74, and an industrial park. These facilities have developed on top of portions of the early 1900s era delta formation. Thus, in addition to sand mining for construction use, large areas of the delta deposition volume could not be defined due to subsequent development. The 1999 grid elevations were generated using the DGPS survey data, the hydrographic elevation data, the path of Farm Creek, the delineation of the water-level contouring survey routes, and a few elevation control points. Figure 19 shows the survey routes and the extent of the grid area. Figure 20 shows the contours developed for The mean grid elevation for 1999 was feet NGVD: 7.5 feet higher than the 1904 grid elevation (Table 3). Grid elevation contours were adjusted manually to more realistically represent the topography near the northeast corner of the cinder disposal site. Sedimentation at Delta Mouths Figures 6-20 present the 1904 and 1999 contour maps and the location of the grid area for each delta. As previously discussed, the 1999 outlets of four of the five creeks no longer occupy the 1904 creek channels nor do they flow into the lake at the 1904 locations. Therefore, the computed volume of the sediments to be described is the volume of the sediment deposited within the grid area between 1904 and Table 4 gives the net accumulation of sediment calculated for each grid area. These results do not include sediment volumes mined from the channels or mouths of these deltas. 27
37 Figure survey, route, and grid extent for Dickison Run delta 28
38 Figure contour map of Dickison Run delta within grid area 29
39 a) Figure 18a contour map of Farm Creek delta area, including the surveyed area of the 1999 Farm Creek delta 30
40 b) Figure 18b contour map of the location of the 1999 Farm Creek delta area 31
41 Grid Area Creek Flow Direction Elevation Control Points for grid generation Water Level Contour Survey Route and Data Points Hydrographic Survey Route and Data Points Figure survey, route, and grid extent for Farm Creek delta 32
42 Figure contour map of Farm Creek delta within grid area 33
43 Table 4. Net Sediment Accumulation at the 1999 Delta Mouths within the Grid Area Tributary name Date when 1999 outlet established* Net sediment accumulation (acre-feet) Average sedimentation rate (acre-ft/year since 1904) Grid area (acres) Drainage area (square miles) Richland Creek , Partridge Creek , Blue Creek , Dickison Run Farm Creek , Note: *Date estimated from construction permit applications or from maps. Over the years, sediment has been mined from the channels and from the mouths of a few of these tributaries. Small sediment mining or moving operations may have occurred on Partridge, Richland, and Blue Creeks. Records of the amount of sediment moved or removed from these deltas are not available or were never kept. During the 1980s, Freesen Incorporated mined the Farm Creek channel for sediment and removed approximately 30,000 cubic yards of sediment (Personal Communication, 1999, Frank Medony, Illinois Department of Transportation). Therefore, the net sediment accumulation shown in Table 4 does not represent the actual sediment accumulation at the delta of Farm Creek. In spite of the lack of available information about sediment that may have been removed from the other deltas, the sediment accumulation values reported in Table 4, and discussed subsequently, provide important baseline values of the volume of sediment deposited at the 1999 tributary mouths compared to bed elevations at the same locations. Table 4 shows that the Partridge Creek delta had the greatest total sediment accumulation of 2,683 acre-feet while draining an area of 28 square miles, followed by Blue Creek with an accumulation of 1,497 acre-feet while draining an area of only 10.5 square miles. Richland Creek accumulated 1,428 acre-feet of sediment while draining 47 square miles, followed by Farm Creek with an accumulation of 1,252 acre-feet while draining an area of 60 square miles. The delta with the least amount of sediment accumulation is at the mouth of Dickison Run where 338 acre-feet of sediment accumulated from a drainage area of 7.9 square miles. Using the calculated sediment accumulation from , the total weight of accumulated sediment within the grid area at each delta was estimated assuming a sediment weight of 70 pounds per cubic foot presented in Table 5. Partridge Creek delta has the highest sediment accumulation of about 4 million tons within the grid area, compared to 0.5 million tons for Dickison Run. In terms of sediment delivery per year per square mile of drainage area, over the 95-year period, Blue Creek had the highest rate at 2,288 tons per year per square mile of 34
44 drainage area while Farm Creek had the lowest rate of sediment delivery (34 tons per year per square mile). However, the rate of sediment delivery at Farm Creek may actually be significantly greater because an unknown amount of sediment has been removed from Farm Creek during occasional sediment mining operations. In 1904, the lake-bottom near the Blue Creek outlet sloped gradually downward from the edge of the water to the edge of the main Illinois River channel (Figure 21). The 1999 delta form has a much steeper slope to the edge of the main river channel, where the outlet empties directly into the main Illinois River navigation channel during high river stage conditions. The main river channel flows across the leading tip of the delta, limiting the rate of apparent delta growth. It is clear that the sediment transported by Blue Creek has filled a large portion of the 1904 Illinois River channel. During field visits to the Peoria Lake deltas in 1999, Illinois State Water Survey professionals and others observed that the mouth of Blue Creek and the tip of the delta are located at the edge of the main Illinois River navigation channel. This proximity of the Blue Creek delta to the navigation channel is illustrated in Figure 21, which shows a cross section along the spine of the Blue Creek delta as it existed in The spine defined here is similar to the spinal cord, i.e., a line following the centerline of the creek extending through the delta and into the main channel. In Figure 21, significant lateral movement of the navigation channel to the west, a consequence of sediment deposition from Blue Creek, is clearly visible. A comparison of the 1904 Woermann contours and 1999 survey data reveals that the centerline of the navigation channel has moved about 750 feet to the west since Thus, over the last 95 years, the delta at this location has been extending to the west at an average rate of 7 feet per year. Tributary Table 5. Sediment Accumulation Rates within the Grid Area, Drainage area (square miles) Net sediment accumulation (acre-feet) Net sediment accumulation* (tons 10 6 ) Rate (tons/year) Net sediment accumulation (tons/square mile/year) Richland Creek 47 1, , Partridge Creek 28 2, ,058 1,537 Blue Creek , ,024 2,288 Dickison Run , Farm Creek 60 1, ,093 34** Notes: *Assuming a unit weight of 70 pounds per cubic foot, one acre-foot equals 43,560 cubic feet. One ton equals 2,000 pounds. **See explanations on sediment mining. 35
45 460 Navigation Channels Elevation (feet NGVD) Elevations 1904 Elevations 440 ft. NGVD (Normal Pool) Distance (feet) Note: The location of the 1999 delta spine was not the same as the 1904 delta spine. Figure 21. Lateral cross section at 1999 spine of Blue Creek delta The above analysis presents the magnitude of sediment accumulation at the mouth of each of the five deltas within respective grid areas. The sediment accumulation values could be used to roughly estimate long-term coarse grain sediment contributions to the lake from each of the tributaries. These values do not account for suspended sediment load transported to the lake from the tributaries and the bed load that may have been transported by each creek and by the Illinois River. Stage-Area and Stage-Volume Relationships The and 1999 elevation contours of Richland Creek, Partridge Creek, Blue Creek, Dickison Run, and Farm Creek deltas were further used to estimate the surface areas and volumes of accumulated sediment at different elevations. The lowest existing elevation at the delta mouths in was used as the base elevation for each delta. From this base elevation, the surface area and the sediment volume were computed at various elevations within the grid area of each delta. These computed values were used to develop the elevation versus surface area and elevation versus accumulated sediment volume relationships for each delta. These plots are given in Figure 22. Unit Weight and Moisture Content On April 18, 2000, some data were collected on Peoria Lake bed sediments to determine the unit weights and moisture contents. These data were collected near River Mile 165 on the east side of the navigation channel during a dredge operation to open a boating channel from the main navigation channel to the Spindler Marina located in East Peoria. Spindler Marina is a 36
46 Area (acres) Elevation (feet NGVD) Area 1904 Area 1904 Volume 1999 Volume a) Richland Creek Delta above 435 ft. NGVD Volume (acre-feet) Area (acres) Elevation (feet NGVD) Area 1999 Area 1904 Volume 1999 Volume b) Partridge Creek Delta above 432 ft. NGVD Volume (acre-feet) Figure 22. Elevation versus surface area and elevation versus volume relationships for a) Richland Creek Delta, b) Partridge Creek Delta, c) Blue Creek Delta, d) Dickison Run Delta, and e) Farm Creek Delta 37
47 460 Area (acres) Elevation (feet NGVD) Area 1904 Area 1904 Volume 1999 Volume c) Blue Creek Delta above 415 ft. NGVD Volume (acre-feet) Elevation (feet NGVD) Area (acres) Area 1904 Area 1904 Volume 1999 Volume d) Dickison Run Delta above 432 ft. NGVD Volume (acre-feet) Figure 22. Continued 38
48 Area (acres) Area 1999 Volume Elevation (feet NGVD) Area 1904 Volume e) Farm Creek Delta above 420 ft. NGVD Volume (acre-feet) Figure 22. Concluded facility run by the East Peoria Park District. During this dredging operation, the bed sediments were collected by two different types of dredges: cable-arm dredging bucket operation and clamshell-type operation. The sediments were collected, lowered gently on a waiting barge, and subsequently transported to a disposal site. Samples were collected once the sediments were dropped on the waiting barge. Additional in-situ undisturbed sediment samples were also collected from the same general area for comparative purposes. Table 6 shows the results of the laboratory analyses of the ten samples collected. Samples UW-1 UW-5 were collected from the barge after the dredged materials were lowered on the barge. Samples UW-1 and UW-2 came from the dredged materials that were removed by the cable arm dredging technique. Samples UW-3, UW-4, and UW-5 came from the dredged materials that were removed by the clam-shell dredging technique. Sampling was done very carefully at locations where samples appeared to be less disturbed. However, all the sediment on the barge was disturbed by the dredging activity. Samples UW-6 UW-10 were collected from the bed of the Peoria Lake close to the dredged site. These undisturbed samples were collected by following the standard procedure. Samples UW-6 and UW-7 came from a single core. For example, sample UW-6 (in-situ / 2.0) was taken from a core 2 feet long that extended from 0.3 feet to 0.6 feet below the lake bottom. Similarly, sample UW-7 (in-situ /2.0) came from the same 2-foot-long core that extended from 1.5 feet to 1.8 feet below the lake bottom. The other three samples were collected from another core 4.2 feet long. The sample UW- 8 (in-situ /4.2) was collected from the 4.2-foot-long core and extended 0.5 feet to 0.8 feet 39
49 Table 6. Peoria Lake Sediment Analyse s: Spindler Marina Dredging Project (1) (2) (3) (4) (5) (6) Water Water Unit weight content content Date Lab # (PD/FT3) (percent) (percent) UW-1 Barge Cable Arm 18-Apr UW-2 Barge Cable Arm 18-Apr UW-3 Barge Clam Shell 18-Apr UW-4 Barge Clam Shell 18-Apr UW-5 Barge Clam Shell 18-Apr UW-6 In-situ / Apr UW-7 In-situ / Apr UW-8 In-situ / Apr UW-9 In-situ / Apr UW-10 In-situ / Apr ISWS Job No: 47 Notes: Column (5): Water content = (weight of water)/(dry net weight of sediment) 100 Column (6): Water content = (weight of water)/(total weight of wet sediment) 100 below the lake bottom. Similarly, sample UW-9 (in-situ /4.2) was collected from the same 4.2-foot-long core and extended 2.0 feet to 2.3 feet below the lake bottom. The last sample, UW-10 (in-situ /4.2), was collected from the same core and extended 3.8 feet to 4.1 feet below the lake bottom. Table 6 shows all these results. Unit weights of all the samples from the barge varied from 39.7 pounds per cubic foot to 48.7 pounds per cubic foot. Unit weights of all undisturbed samples varied from 42.1 pounds per cubic foot to 48.5 pounds per cubic foot. Two columns in Table 6 describe the moisture contents of these samples. Column 5 shows the ratio of the weight of water to the net dry weight of the sediment in percent. Column 6 shows the percent of water in weight in terms of the total weight of the wet sample. The moisture content in terms of the dry net weight of the sediments varies from 88.4 percent to percent for dredged materials and from 87.5 percent to percent for undisturbed samples. In terms of the total weight of the wet sediments, the moisture content varied from 46.7 percent to 50.9 percent. 40
50 This analysis showed that the dredging of Peoria Lake sediment, when done very carefully using techniques such as cable-arm or clam-shell-type dredges and keeping the structure of the dredged soil intact, has no significant effect on the moisture content of sediment compared to undisturbed sediment. However, caution must be exercised in interpreting these data. Sampling on the barge was done at places where sediment appeared to be fairly stable and intact. A random sampling would certainly show a higher moisture content than those reported here. Summary The Illinois State Water Survey surveyed five Peoria Lake deltas to estimate the amount of sediment accumulated at the mouths of these deltas between and The deltas surveyed were: Richland Creek, Partridge Creek, Blue Creek, Dickison Run, and Farm Creek. This report summarizes the results of the field survey conducted in In addition to reporting survey results, a historical analysis of the location, movement, and aerial extent of these deltas between 1939 and 1994 is included in this report. Delta volumes and surface areas were calculated within a grid area that encompassed the areal extent of the 1999 deltas. The grid areas could not be extended to cover each of the entire deltas because of significant alterations of the tributary outlets in the last 100 years or so. Computed sediment accumulation values given in the report do not include the suspended sediment load transported to the lake from the tributaries or the bed load contribution from the main Illinois River. The volume of net sediment accumulation was determined by comparing the survey results by Woermann with the detailed 1999 topographic and hydrographic survey results for each selected delta area. A selected area at the mouth of each delta was defined and an elevation grid developed for each survey year. Net sediment accumulation was determined from the difference in the mean grid elevation between 1904 and Analyses of historical aerial photographs indicate that all of these deltas have grown between 1939 and 1994, the 55-year period for which aerial photographs are available. Four of the five tributary channels (Richland Creek, Partridge Creek, Blue Creek, and Farm Creek) have been redirected so that the 1999 tributary channels and outlets are not at the 1904 locations. All of the deltas studied experienced net sediment accumulation. Partridge Creek had the highest amount of sediment accumulation (2,683 acre-feet) followed by Blue Creek (1,497 acrefeet). Dickison Run had the smallest net sediment accumulation (338 acre-feet). However, in terms of sediment accumulation rates per year per unit drainage area, Blue Creek had the highest rate (2,300 tons/year/square mile), followed by Dickison Run (687 tons/year/square mile), Richland Creek (488 tons/year/square mile), and Farm Creek (34 tons/year/square mile). These results must be viewed with a cautionary note. Several of the tributary channels and mouths have been mined for sediment over the years, in particular, Farm Creek. Consequently, very little information about the amount of sediment removed is known, making it impossible to estimate the quantity of sediment removed or moved. Thus, the compiled volume of sediment accumulation at the mouths of these deltas does not reflect the actual delivery of sediment and certainly underestimates the net delivery of the sediment from these tributaries to Peoria Lake. 41
51 Relationships also have been developed between elevation and sediment volumes, and elevation and surface area for each of the deltas within the respective grid areas. Results are also presented from a sampling program to determine unit weights and moisture contents of Peoria Lake bed sediments from the east side of the channel near Spindler Marina. Both disturbed (by dredge) and undisturbed sediment samples were collected for analysis. These results show that sediment unit weights vary from 39.7 pounds per cubic foot to 48.7 pounds per cubic foot. The moisture content in terms of net dry weight of sediments varies from 87.5 percent to percent. References Bhowmik, N. G., W.C. Bogner, J.A. Slowikowski, J.R. Adams Source Monitoring and Evaluation of Sediment Inputs for Peoria Lake. Illinois State Water Survey Contract Report 514. Communication Systems International Inc. (CSII). MBX-2/00 Marine Beacon Receiver User Manual, Document Number , Calgary, Alberta, Canada T2H 0G5. Demissie, M., and N.G. Bhowmik Peoria Lake Sediment Investigation. Illinois State Water Survey Contract Report 371. Leica Navigation and Positioning Division (LNPD). MX 8600 GPS/GIS Data Collection System Manual, Torrance, CA ( McKibbin, J. C Datum Planes in Illinois, Civil Engineering Department, University of Illinois, Urbana, Illinois, Graduate Thesis. Odom Hydrographic Systems, Inc. (OHS). ECHOTRAC MKII, Installation/Operation Manual, Version 6.10, Baton Rouge, LA. odomsys@ix.netcom.com. Woermann, J.W Map of the Illinois and Des Plaines Rivers from Lockport, Illinois, to the Mouth of the Illinois River. U.S. Army Corps of Engineers. 42
52 Appendix. Historical Aerial Photographs of the Five Selected Deltas 43
53 44
54 AA R1 to R8 Aerial Views of the Richland Creek Delta 45
55 46
56
57
58
59
60 AA P1 to P8 Aerial Views of the Partridge Creek Delta 51
61 52
62
63

64
65
66 AA B1 to B7 Aerial Views of the Blue Creek Delta 57
67 58
68
69
70
71
72 AA D1 to D5 Aerial Views of the Dickison Creek Delta 63
73 64
74
75
76
PEORIA LAKE SEDIMENT INVESTIGATION
 SURFACE WATER SECTION AT THE UNIVERSITY OF ILLINOIS Illinois Department of Energy and Natural Resources SWS Contract Report 371 PEORIA LAKE SEDIMENT INVESTIGATION by Misganaw Demissie and Nani G. Bhowmik
Highland Lake Bathymetric Survey
 Highland Lake Bathymetric Survey Final Report, Prepared For: The Town of Highland Lake 612 Lakeshore Drive Oneonta, AL 35121 Prepared By: Tetra Tech 2110 Powers Ferry Road SE Suite 202 Atlanta, GA 30339
Sedimentation Survey of Lake Paradise and Lake Mattoon, Mattoon, Illinois
 Contract Report 2003-04 Sedimentation Survey of Lake Paradise and Lake Mattoon, Mattoon, Illinois by William C. Bogner Prepared for the CMT Engineering Company City of Mattoon and Illinois Environmental
Lake Sedimentation Survey of Siloam Springs State Park Lake, Adams County, Illinois
 Contract Report 567 Lake Sedimentation Survey of Siloam Springs State Park Lake, Adams County, Illinois by Richard L. Allgire Office of Sediment & Wetland Studies Prepared for the Illinois Department of
How Do Human Impacts and Geomorphological Responses Vary with Spatial Scale in the Streams and Rivers of the Illinois Basin?
 How Do Human Impacts and Geomorphological Responses Vary with Spatial Scale in the Streams and Rivers of the Illinois Basin? Bruce Rhoads Department of Geography University of Illinois at Urbana-Champaign
Illinois State Water Survey Division
 Illinois State Water Survey Division SURFACE WATER SECTION SWS Contract Report 413 AT THE UNIVERSITY OF ILLINOIS SEDIMENTATION SURVEY OF DAWSON LAKE, MORAINE VIEW STATE PARK, MC LEAN COUNTY, ILLINOIS by
Vermont Stream Geomorphic Assessment. Appendix E. River Corridor Delineation Process. VT Agency of Natural Resources. April, E0 - April, 2004
 Vermont Stream Geomorphic Assessment Appendix E River Corridor Delineation Process Vermont Agency of Natural Resources - E0 - River Corridor Delineation Process Purpose A stream and river corridor delineation
Island Design. UMRS EMP Regional Workshop. Presentation for the
 Island Design Presentation for the UMRS EMP Regional Workshop by Jon Hendrickson Hydraulic Engineer Regional Technical Specialist, Water Quality and Habitat Restoration August 17 19, 2005 Project Delivery
State Water Survey Division SURFACE WATER SECTION
 State Water Survey Division SURFACE WATER SECTION AT THE UNIVERSITY OF ILLINOIS Illinois Department of Energy and Natural Resources SWS Miscellaneous Publication 88 SEDIMENTATION OF POOL 19 ON THE MISSISSIPPI
 Red River Flooding June 2015 Caddo and Bossier Parishes Presented by: Flood Technical Committee Where the Rain Falls Matters I-30 versus I-20 I-20 Backwater and Tributary Floods (Localized) 2016 Flood
Sedimentation Survey of Lake Decatur s Basin 6, Macon County, Illinois
 Contract Report 2001-07 Sedimentation Survey of Lake Decatur s Basin 6, Macon County, Illinois by William C. Bogner Prepared for the City of Decatur May 2001 Illinois State Water Survey Watershed Science
Bank Erosion and Morphology of the Kaskaskia River
 Bank Erosion and Morphology of the Kaskaskia River US Army Corps Of Engineers St. Louis District Fayette County Soil and Water Conservation District Team Partners : Carlyle Lake Ecosystem Partnership Vicinity
Dan Miller + Kelly Burnett, Kelly Christiansen, Sharon Clarke, Lee Benda. GOAL Predict Channel Characteristics in Space and Time
 Broad-Scale Models Dan Miller + Kelly Burnett, Kelly Christiansen, Sharon Clarke, Lee Benda GOAL Predict Channel Characteristics in Space and Time Assess Potential for Fish Use and Productivity Assess
BACKWATER RESTORATION OPPORTUNITIES: ILLINOIS RIVER. John C. Marlin
 BACKWATER RESTORATION OPPORTUNITIES: ILLINOIS RIVER John C. Marlin Waste Management and Research Center, Illinois Department of Natural Resources One E. Hazelwood Dr., Champaign, Illinois 61801 E-mail:
Lecture 9: Reference Maps & Aerial Photography
 Lecture 9: Reference Maps & Aerial Photography I. Overview of Reference and Topographic Maps There are two basic types of maps? Reference Maps - General purpose maps & Thematic Maps - maps made for a specific
Red River Levee Panel
 Red River Levee Panel Mississippi River Commission Monday, August 9, 2017 Red River Levees in LA & AR NONE along TX & OK Boarder Red River Levee Issues Caddo Levee Cherokee Park Authorization Bossier Levee
Technical Memorandum No Sediment Model
 Pajaro River Watershed Study in association with Technical Memorandum No. 1.2.9 Sediment Model Task: Development of Sediment Model To: PRWFPA Staff Working Group Prepared by: Gregory Morris and Elsie Parrilla
GEOL 1121 Earth Processes and Environments
 GEOL 1121 Earth Processes and Environments Wondwosen Seyoum Department of Geology University of Georgia e-mail: seyoum@uga.edu G/G Bldg., Rm. No. 122 Seyoum, 2015 Chapter 6 Streams and Flooding Seyoum,
CAUSES FOR CHANGE IN STREAM-CHANNEL MORPHOLOGY
 CAUSES FOR CHANGE IN STREAM-CHANNEL MORPHOLOGY Chad A. Whaley, Department of Earth Sciences, University of South Alabama, MobileAL, 36688. E-MAIL: caw408@jaguar1.usouthal.edu The ultimate goal of this
High-Gradient Streams
 Chapter 4 Surface Processes Section 4 High-Gradient Streams What Do You See? Learning Outcomes In this section, you will Use models and real-time streamflow data to understand the characteristics of highgradient
Stream Geomorphology. Leslie A. Morrissey UVM July 25, 2012
 Stream Geomorphology Leslie A. Morrissey UVM July 25, 2012 What Functions do Healthy Streams Provide? Flood mitigation Water supply Water quality Sediment storage and transport Habitat Recreation Transportation
Examination of Direct Discharge Measurement Data and Historic Daily Data for Selected Gages on the Middle Mississippi River,
 Examination of Direct Discharge Measurement Data and Historic Daily Data for Selected Gages on the Middle Mississippi River, 1861-2008 - Richard J. Huizinga, P.E. U.S. Geological Survey Missouri Water
Cattaraugus Creek: A Story of Flowing Water and the Geology of the Channel It Flows Through Presentation to West Valley Citizen Task Force 4/27/16
 Cattaraugus Creek: A Story of Flowing Water and the Geology of the Channel It Flows Through Presentation to West Valley Citizen Task Force 4/27/16 Raymond C. Vaughan, Ph.D. What happens if you drop a
Chapter 3 Erosion in the Las Vegas Wash
 Chapter 3 Erosion in the Las Vegas Wash Introduction As described in Chapter 1, the Las Vegas Wash (Wash) has experienced considerable change as a result of development of the Las Vegas Valley (Valley).
Sedimentation Survey of Lake Decatur s Big and Sand Creek Basins, Macon County, Illinois
 Contract Report 2002-09 Sedimentation Survey of Lake Decatur s Big and Sand Creek Basins, Macon County, Illinois by William C. Bogner Prepared for the City of Decatur November 2002 Illinois State Water
8 th 12 th Designing a Monitoring Plan Mapping & Analysis (Activities 1 2)
") 8 th 12 th Designing a Monitoring Plan Mapping & Analysis (Activities 1 2) Objectives for All Activities - To be able to define and describe the purpose and uses of topographic maps. - To define rules
8 th 12 th Designing a Monitoring Plan Mapping & Analysis (Activities 1 2) Objectives for All Activities - To be able to define and describe the purpose and uses of topographic maps. - To define rules
LOMR SUBMITTAL LOWER NEHALEM RIVER TILLAMOOK COUNTY, OREGON
 LOMR SUBMITTAL LOWER NEHALEM RIVER TILLAMOOK COUNTY, OREGON Prepared for: TILLAMOOK COUNTY DEPARTMENT OF COMMUNITY DEVELOPMENT 1510-B THIRD STREET TILLAMOOK, OR 97141 Prepared by: 10300 SW GREENBURG ROAD,
YELLOWSTONE RIVER FLOOD STUDY REPORT TEXT
 YELLOWSTONE RIVER FLOOD STUDY REPORT TEXT TECHNICAL REPORT Prepared for: City of Livingston 411 East Callender Livingston, MT 59047 Prepared by: Clear Creek Hydrology, Inc. 1627 West Main Street, #294
3.0 TECHNICAL FEASIBILITY
 3.0 TECHNICAL FEASIBILITY 3.1 INTRODUCTION To enable seasonal storage and release of water from Lake Wenatchee, an impoundment structure would need to be constructed on the lake outlet channel. The structure
Tenmile Lakes Delta Building Study
 Tenmile Lakes Delta Building Study Since the late 1940 s, Tenmile Lakes has seen a sharp increase in sediment accumulation at the mouths of the tributaries that feed the lake. To monitor this sediment
Technical Memorandum No
 Pajaro River Watershed Study in association with Technical Memorandum No. 1.2.10 Task: Evaluation of Four Watershed Conditions - Sediment To: PRWFPA Staff Working Group Prepared by: Gregory Morris and
EAGLES NEST AND PIASA ISLANDS
 EAGLES NEST AND PIASA ISLANDS HABITAT REHABILITATION AND ENHANCEMENT PROJECT MADISON AND JERSEY COUNTIES, ILLINOIS ENVIRONMENTAL MANAGEMENT PROGRAM ST. LOUIS DISTRICT FACT SHEET I. LOCATION The proposed
Sedimentation Survey of Lake Vermilion, Vermilion County, Illinois
 Contract Report 643 Sedimentation Survey of Lake Vermilion, Vermilion County, Illinois by William C. Bogner and K. Erin Hessler Prepared for the Consumers Illinois Water Company May 1999 Illinois State
Pierce Cedar Creek Institute GIS Development Final Report. Grand Valley State University
 Pierce Cedar Creek Institute GIS Development Final Report Grand Valley State University Major Goals of Project The two primary goals of the project were to provide Matt VanPortfliet, GVSU student, the
CHAPTER 28. PHYSIOGRAPHY Cook Inlet Drainages
 PEBBLE PROJECT ENVIRONMENTAL BASELINE DOCUMENT 2004 through 2008 CHAPTER 28. PHYSIOGRAPHY Cook Inlet Drainages PREPARED BY: Knight Piésold Ltd. PHYSIOGRAPHY COOK INLET DRAINAGES TABLE OF CONTENTS TABLE
LOCATED IN INDIAN RIVER COUNTY PREPARED FOR S.J.R.W.M.D. AND F.W.C.D. DECEMBER, 2003 Updated 2007 Updated May 2014 PREPARED BY
 FELLSMERE WATER CONTROL DISTRICT EAST MASTER DRAINAGE PLAN AND STORMWATER HYDROLOGIC ANALYSIS OF THE GRAVITY DRAINAGE SYSTEM LOCATED BETWEEN THE EAST BOUNDARY, LATERAL U, THE MAIN CANAL, AND DITCH 24 LOCATED
Estimated Sediment Volume: Bridge Street Dam Impoundment, Royal River, Yarmouth, Maine
 University of Southern Maine USM Digital Commons Publications Casco Bay Estuary Partnership (CBEP) 2015 Estimated Sediment Volume: Bridge Street Dam Impoundment, Royal River, Yarmouth, Maine Stantec Follow
Appendix I. Dredged Volume Estimates. Draft Contractor Document: Subject to Continuing Agency Review
 Appendix I Dredged Volume Estimates Draft Contractor Document: Subject to Continuing Agency Review Interoffice Correspondence Date: April 6, 2007 To: L. Bossi (WHI) Copy: S. Thompson (WHI), B. Fidler (NNJ)
Summary of Hydraulic and Sediment-transport. Analysis of Residual Sediment: Alternatives for the San Clemente Dam Removal/Retrofit Project,
 Appendix N SUMMARY OF HYDRAULIC AND SEDIMENT-TRANSPORT ANALYSIS OF RESIDUAL SEDIMENT: ALTERNATIVES FOR THE SAN CLEMENTE DAM REMOVAL/RETROFIT PROJECT, CALIFORNIA the San Clemente Dam Removal/Retrofit Project,
HISTORY OF CONSTRUCTION FOR EXISTING CCR SURFACE IMPOUNDMENT PLANT GASTON ASH POND 40 CFR (c)(1)(i) (xii)
(1)(i) (xii)") HISTORY OF CONSTRUCTION FOR EXISTING CCR SURFACE IMPOUNDMENT PLANT GASTON ASH POND 40 CFR 257.73(c)(1)(i) (xii) (i) Site Name and Ownership Information: Site Name: E.C. Gaston Steam Plant Site Location:
HISTORY OF CONSTRUCTION FOR EXISTING CCR SURFACE IMPOUNDMENT PLANT GASTON ASH POND 40 CFR 257.73(c)(1)(i) (xii) (i) Site Name and Ownership Information: Site Name: E.C. Gaston Steam Plant Site Location:
HYDRAULIC INVESTIGATION FOR THE CONSTRUCTION OF ARTIFICIAL ISLANDS IN PEORIA LAKE
 ILENR/RE-WR-88/15 HYDRAULIC INVESTIGATION FOR THE CONSTRUCTION OF ARTIFICIAL ISLANDS IN PEORIA LAKE James R. Thompson, Governor Don Etchison, Director Printed by the Authority of the State of Illinois
Surface Water and Stream Development
 Surface Water and Stream Development Surface Water The moment a raindrop falls to earth it begins its return to the sea. Once water reaches Earth s surface it may evaporate back into the atmosphere, soak
UPPER COSUMNES RIVER FLOOD MAPPING
 UPPER COSUMNES RIVER FLOOD MAPPING DRAFT BASIC DATA NARRATIVE FLOOD INSURANCE STUDY SACRAMENTO COUTY, CALIFORNIA Community No. 060262 November 2008 Prepared By: CIVIL ENGINEERING SOLUTIONS, INC. 1325 Howe
AN ARCHAEOLOGICAL SURVEY FOR THE DCP MIDSTREAM THREE RIVERS PLANT TO CGP 51 PROJECT IN LIVE OAK COUNTY, TEXAS
 AN ARCHAEOLOGICAL SURVEY FOR THE DCP MIDSTREAM THREE RIVERS PLANT TO CGP 51 PROJECT IN LIVE OAK COUNTY, TEXAS By William E. Moore Brazos Valley Research Associates Contract Report Number 251 2011 AN ARCHAEOLOGICAL
Final Exam. Running Water Erosion and Deposition. Willamette Discharge. Running Water
 Final Exam Running Water Erosion and Deposition Earth Science Chapter 5 Pages 120-135 Scheduled for 8 AM, March 21, 2006 Bring A scantron form A calculator Your 3 x 5 paper card of formulas Review questions
Waterbury Dam Disturbance Mike Fitzgerald Devin Rowland
 Waterbury Dam Disturbance Mike Fitzgerald Devin Rowland Abstract The Waterbury Dam was completed in October 1938 as a method of flood control in the Winooski Valley. The construction began in April1935
Step 5: Channel Bed and Planform Changes
 Step 5: Channel Bed and Planform Changes When disturbed, streams go through a series of adjustments to regain equilibrium with the flow and sediment supply of their watersheds. These adjustments often
Assessment of the Hood River Delta Hood River, Oregon
 Assessment of the Hood River Delta Hood River, Oregon Pacific Northwest Waterways Association Annual Meeting October 13, 2010 Michael McElwee, Executive Director Port of Hood River Overview U.S. Army Corps
FUTURE MEANDER BEND MIGRATION AND FLOODPLAIN DEVELOPMENT PATTERNS NEAR RIVER MILES 200 TO 191 OF THE SACRAMENTO RIVER PHASE III REPORT
 FUTURE MEANDER BEND MIGRATION AND FLOODPLAIN DEVELOPMENT PATTERNS NEAR RIVER MILES 200 TO 191 OF THE SACRAMENTO RIVER PHASE III REPORT Eric W. Larsen REPORT FOR DUCKS UNLIMITED March 31, 2006-1 - Contents
SECTION G SEDIMENT BUDGET
 SECTION G SEDIMENT BUDGET INTRODUCTION A sediment budget has been constructed for the for the time period 1952-2000. The purpose of the sediment budget is to determine the relative importance of different
ILLINOIS RIVER BASIN RESTORATION COMPREHENSIVE PLAN WITH INTEGRATED ENVIRONMENTAL ASSESSMENT APPENDIX B
 ILLINOIS RIVER BASIN RESTORATION COMPREHENSIVE PLAN WITH INTEGRATED ENVIRONMENTAL ASSESSMENT APPENDIX B SYSTEM ECOLOGY ILLINOIS RIVER BASIN RESTORATION COMPREHENSIVE PLAN WITH INTEGRATED ENVIRONMENTAL
Laboratory Exercise #3 The Hydrologic Cycle and Running Water Processes
 Laboratory Exercise #3 The Hydrologic Cycle and Running Water Processes page - 1 Section A - The Hydrologic Cycle Figure 1 illustrates the hydrologic cycle which quantifies how water is cycled throughout
Summary. Streams and Drainage Systems
 Streams and Drainage Systems Summary Streams are part of the hydrologic cycle and the chief means by which water returns from the land to the sea. They help shape the Earth s surface and transport sediment
Elevations are in meters above mean sea level. Scale 1:2000
 12.001 LAB 7: TOPOGRAPHIC MAPS Due: Monday, April 11 PART I: CONTOURING AND PROFILES (20 PTS) 1. Contour this area map using a 5 meter contour interval. Remember some fundamental rules of contour lines,
Kaskaskia Morphology Study Headwaters to Lake Shelbyville
 Kaskaskia Morphology Study Headwaters to Lake Shelbyville KWA Mini Summit 5 March 2012 1 Kaskaskia Morphology Study Headwaters to Lake Shelbyville Conducted by U.S. Army Corps of Engineers, St. Louis District
CR AAO Bridge. Dead River Flood & Natural Channel Design. Mitch Koetje Water Resources Division UP District
 CR AAO Bridge Dead River Flood & Natural Channel Design Mitch Koetje Water Resources Division UP District Old County Road AAO Bridge Map courtesy of Marquette County Silver Lake Basin McClure Basin
HEC-6 Modeling of the Main Stem of the Kankakee River in Illinois from the Stateline Bridge to the Kankakee Dam
 Contract Report 2004-04 HEC-6 Modeling of the Main Stem of the Kankakee River in Illinois from the Stateline Bridge to the Kankakee Dam by Nani G. Bhowmik, Christina Tsai, Paminder Parmar, and Misganaw
ES 105 Surface Processes I. Hydrologic cycle A. Distribution % in oceans 2. >3% surface water a. +99% surface water in glaciers b.
 ES 105 Surface Processes I. Hydrologic cycle A. Distribution 1. +97% in oceans 2. >3% surface water a. +99% surface water in glaciers b. >1/3% liquid, fresh water in streams and lakes~1/10,000 of water
Chapter 1 Overview of Maps
 Chapter 1 Overview of Maps In this chapter you will learn about: Key points when working with maps General types of maps Incident specific maps Map legend and symbols Map sources A map is a navigational
Appendix D. Sediment Texture and Other Soil Data
 5 6 7 8 Appendix D. Sediment Texture and Other Soil Data This appendix describes the sediment texture of the aquifer system in the Restoration Area. The contents of this appendix describe the: Importance
Appendix E Guidance for Shallow Flooding Analyses and Mapping
 Appendix E Guidance for Shallow Flooding Analyses and Mapping E.1 Introduction Different types of shallow flooding commonly occur throughout the United States. Types of flows that result in shallow flooding
Running Water Earth - Chapter 16 Stan Hatfield Southwestern Illinois College
 Running Water Earth - Chapter 16 Stan Hatfield Southwestern Illinois College Hydrologic Cycle The hydrologic cycle is a summary of the circulation of Earth s water supply. Processes involved in the hydrologic
Name: Mid-Year Review #2 SAR
 Name: Mid-Year Review #2 SAR Base your answers to questions 1 through 3 on on the diagram below, which shows laboratory materials used for an investigation of the effects of sediment size on permeability,
REDWOOD VALLEY SUBAREA
 Independent Science Review Panel Conceptual Model of Watershed Hydrology, Surface Water and Groundwater Interactions and Stream Ecology for the Russian River Watershed Appendices A-1 APPENDIX A A-2 REDWOOD
Lecture Outlines PowerPoint. Chapter 5 Earth Science 11e Tarbuck/Lutgens
 Lecture Outlines PowerPoint Chapter 5 Earth Science 11e Tarbuck/Lutgens 2006 Pearson Prentice Hall This work is protected by United States copyright laws and is provided solely for the use of instructors
Streams. Water. Hydrologic Cycle. Geol 104: Streams
 Streams Why study streams? Running water is the most important geologic agent in erosion, transportation and deposition of sediments. Water The unique physical and chemical properties of water make it
Flood Hazard Zone Modeling for Regulation Development
 Flood Hazard Zone Modeling for Regulation Development By Greg Lang and Jared Erickson Pierce County GIS June 2003 Abstract The desire to blend current digital information with government permitting procedures,
B-1. Attachment B-1. Evaluation of AdH Model Simplifications in Conowingo Reservoir Sediment Transport Modeling
 Attachment B-1 Evaluation of AdH Model Simplifications in Conowingo Reservoir Sediment Transport Modeling 1 October 2012 Lower Susquehanna River Watershed Assessment Evaluation of AdH Model Simplifications
The Sediment Budget of the Illinois River:
 Report of Investigation 122 Executive Summary The Sediment Budget of the Illinois River: 1981-2015 Riv er Misganaw Demissie, Elias Getahun, and Laura Keefer Illi is no M i ipp iss iss Ri v e r The Sediment
Erosion Surface Water. moving, transporting, and depositing sediment.
 + Erosion Surface Water moving, transporting, and depositing sediment. + Surface Water 2 Water from rainfall can hit Earth s surface and do a number of things: Slowly soak into the ground: Infiltration
Geomorphology Geology 450/750 Spring Fluvial Processes Project Analysis of Redwood Creek Field Data Due Wednesday, May 26
 Geomorphology Geology 450/750 Spring 2004 Fluvial Processes Project Analysis of Redwood Creek Field Data Due Wednesday, May 26 This exercise is intended to give you experience using field data you collected
U.S. ARMY CORPS OF ENGINEERS
 CORPS FACTS Regulating Mississippi River Navigation Pools U.S. ARMY CORPS OF ENGINEERS BUILDING STRONG Historical Background Federal improvements in the interest of navigation on the Mississippi River
WITTKOP, BENNETT, CHORMANN AND WUNSCH
 1 GEOLOGY OF THE MAY 2006 SUNCOOK RIVER AVULSION by Chad Wittkop, Department of Geology, University of Wisconsin Eau Claire, Eau Claire, WI 54701 Derek Bennett, Rick Chormann and David Wunsch, New Hampshire
Streams. Stream Water Flow
 CHAPTER 14 OUTLINE Streams: Transport to the Oceans Does not contain complete lecture notes. To be used to help organize lecture notes and home/test studies. Streams Streams are the major geological agents
Hydrographic Surveys for Six Water Bodies in Eastern Nebraska,
 University of Nebraska - Lincoln DigitalCommons@University of Nebraska - Lincoln Publications of the US Geological Survey US Geological Survey 2008 Hydrographic Surveys for Six Water Bodies in Eastern
MATHEMATICAL MODELING OF FLUVIAL SEDIMENT DELIVERY, NEKA RIVER, IRAN. S.E. Kermani H. Golmaee M.Z. Ahmadi
 JOURNAL OF ENVIRONMENTAL HYDROLOGY The Electronic Journal of the International Association for Environmental Hydrology On the World Wide Web at http://www.hydroweb.com VOLUME 16 2008 MATHEMATICAL MODELING
Rosgen Classification Unnamed Creek South of Dunka Road
 Rosgen Classification Unnamed Creek South of Dunka Road Prepared for Poly Met Mining Inc. September 2013 Rosgen Classification Unnamed Creek South of Dunka Road Prepared for Poly Met Mining Inc. September
Lab Topographic Maps. Name: Partner: Purpose. Background Information
 Lab Topographic Maps Name: Partner: Purpose The purpose of this lab is to familiarize you with graphic representations of the Earth s surface primarily maps. Simple line maps show the spatial relationship
Earth Science Chapter 6 Section 2 Review
 Name: Class: Date: Earth Science Chapter 6 Section Review Multiple Choice Identify the choice that best completes the statement or answers the question. 1. Most streams carry the largest part of their
Illinois State Water Survey Division
 Illinois State Water Survey Division SURFACE WATER SECTION SWS Miscellaneous Publication 108 SEDIMENT YIELD AND ACCUMULATION IN THE LOWER CACHE RIVER by Misganaw Demissie Champaign, Illinois June 1989
GRAPEVINE LAKE MODELING & WATERSHED CHARACTERISTICS
 GRAPEVINE LAKE MODELING & WATERSHED CHARACTERISTICS Photo Credit: Lake Grapevine Boat Ramps Nash Mock GIS in Water Resources Fall 2016 Table of Contents Figures and Tables... 2 Introduction... 3 Objectives...
Sediment Conditions In Backwater Lakes Along The Illinois River - Phase 2. by.
 Department of Registration and Education Sediment Conditions In Backwater Lakes Along The Illinois River - Phase 2 by. Ming T. Lee, P.E. Associate Engineer and John B. Stall, P.E. Head, Hydrology Section
Watershed Delineation in GIS Environment Rasheed Saleem Abed Lecturer, Remote Sensing Centre, University of Mosul, Iraq
 Watershed Delineation in GIS Environment Rasheed Saleem Abed Lecturer, Remote Sensing Centre, University of Mosul, Iraq Abstract: The management and protection of watershed areas is a major issue for human
Reconnaissance of Coal-Slurry Deposits in Indiana. IGS Web Report
 Reconnaissance of Coal-Slurry Deposits in Indiana Denver Harper Chris Dintaman Maria Mastalerz Sally Letsinger August 1, 2006 - April 30, 2007 Indiana Geological Survey Bloomington, Indiana 1 IGS Web Report
FORM A GEOGRAPHY 1114 LABORATORY FINAL EXAM Teaching Assistant SAMPLE Lab Meeting. Place all answers on the answer sheet; 2 points per question
 FORM A GEOGRAPHY 1114 NAME LABORATORY FINAL EXAM Teaching Assistant SAMPLE Lab Meeting Place all answers on the answer sheet; 2 points per question FORMULAS PPT = (PET-D) + S ± = Δ SOIL G = V H Q = V A
LOMR SUBMITTAL LOWER NESTUCCA RIVER TILLAMOOK COUNTY, OREGON
 LOMR SUBMITTAL LOWER NESTUCCA RIVER TILLAMOOK COUNTY, OREGON Prepared for: TILLAMOOK COUNTY DEPARTMENT OF COMMUNITY DEVELOPMENT 1510-B THIRD STREET TILLAMOOK, OR 97141 Prepared by: 10300 SW GREENBURG ROAD,
Laboratory Exercise #4 Geologic Surface Processes in Dry Lands
 Page - 1 Laboratory Exercise #4 Geologic Surface Processes in Dry Lands Section A Overview of Lands with Dry Climates The definition of a dry climate is tied to an understanding of the hydrologic cycle
TSEGI WASH 50% DESIGN REPORT
 TSEGI WASH 50% DESIGN REPORT 2/28/2014 Daniel Larson, Leticia Delgado, Jessica Carnes I Table of Contents Acknowledgements... IV 1.0 Project Description... 1 1.1 Purpose... 1 Figure 1. Erosion of a Headcut...
APPENDIX E. GEOMORPHOLOGICAL MONTORING REPORT Prepared by Steve Vrooman, Keystone Restoration Ecology September 2013
 APPENDIX E GEOMORPHOLOGICAL MONTORING REPORT Prepared by Steve Vrooman, Keystone Restoration Ecology September 2 Introduction Keystone Restoration Ecology (KRE) conducted geomorphological monitoring in
Upper Truckee River Restoration Lake Tahoe, California Presented by Brendan Belby Sacramento, California
 Upper Truckee River Restoration Lake Tahoe, California Presented by Brendan Belby Sacramento, California Mike Rudd (Project Manager), Charley Miller & Chad Krofta Declines in Tahoe s Water Clarity The
PolyMet NorthMet Project
 RS 26 Draft-01 December 8, 2005 RS26 Partridge River Level 1 Rosgen Geomorphic Survey Rosgen Classification Partridge River from Headwaters to Colby Lake Prepared for PolyMet NorthMet Project December
Sedimentation Survey of Paris West Lake, Edgar County, Illinois
 Contract Report 527 Sedimentation Survey of Paris West Lake, Edgar County, Illinois by William C. Bogner Office of Hydraulics & River Mechanics Prepared for the City of Paris March 1992 Illinois State
January 25, Summary
 January 25, 2013 Summary Precipitation since the December 17, 2012, Drought Update has been slightly below average in parts of central and northern Illinois and above average in southern Illinois. Soil
Huron Creek Watershed 2005 Land Use Map
 Huron Creek Watershed 2005 Land Use Map Created By: Linda Kersten, 12/20/06 Created For: MTU Introduction to GIS Class (FW 5550) The Huron Creek Watershed Advisory Committee Michigan Technological University,
Limitation to qualitative stability indicators. the real world is a continuum, not a dichotomy ~ 100 % 30 % ~ 100 % ~ 40 %
 Stream Stability Assessment & BEHI Surveys Joe Rathbun MDEQ Water Resources Division rathbunj@michigan.gov 517--373 517 373--8868 Stability Stream can transport its water and sediment inputs without changing
Stop 1: Marmot Dam Stop 1: Marmot Dam
 Stop 1: Marmot Dam Stop 1: Marmot Dam Following the removal of Marmot Dam in 2007, the fate of the reservoir sediments has been monitored through a series of surveys and sediment transport measurements.
Surface Processes Focus on Mass Wasting (Chapter 10)
") Surface Processes Focus on Mass Wasting (Chapter 10) 1. What is the distinction between weathering, mass wasting, and erosion? 2. What is the controlling force in mass wasting? What force provides resistance?
Surface Processes Focus on Mass Wasting (Chapter 10) 1. What is the distinction between weathering, mass wasting, and erosion? 2. What is the controlling force in mass wasting? What force provides resistance?
3. MARINE HABITAT RESTORATION
 Feasibility Study for Restoration of Titlow Lagoon Fish Passage South Puget Sound Salmon Enhancement Group 3. MARINE HABITAT RESTORATION Marine habitat restoration at Titlow Park could include restoration
Each basin is surrounded & defined by a drainage divide (high point from which water flows away) Channel initiation
 Channel initiation") DRAINAGE BASINS A drainage basin or watershed is defined from a downstream point, working upstream, to include all of the hillslope & channel areas which drain to that point Each basin is surrounded &
DRAINAGE BASINS A drainage basin or watershed is defined from a downstream point, working upstream, to include all of the hillslope & channel areas which drain to that point Each basin is surrounded &
Sedimentation Rate Change in the Winooski River Delta
 Sedimentation Rate Change in the Winooski River Delta Chris Ricker and Brian Connelly Abstract Historical air photographs, from 1937 show the Winooski River Delta extended much farther into Lake Champlain