Rock Mechanics for Tunneling
|
|
|
- Shannon Jenkins
- 5 years ago
- Views:
Transcription
1 Rock Mechanics for Tunneling Discrete Fracture Approach Dr. William Dershowitz Dept of Civil Engineering University of Washington FracMan Technology Group Golder Associates Inc
2 Rock Quality -RQD

3 Rock Quality -RMR

4 Rock Quality -RMR
5 Rock Tunnel Design by RMR
6 Rock Quality Q Q System
7 Rock Quality Q Q System
8 Rock Quality Q Q System
9 Rock Tunnel Design Using Q-System Q
10 after Hoek, 2000 Rock Tunnel Design Using Q-System Q
11 Rock Dowels
12 Rock Bolts
13 Rock Bolt Design

14 Shotcrete
15 Shotcrete

16 Hallandsås Tunnel: Excitement Under (and above) Ground

17 Hallandsås

18 Hallandsås: : Swedish Tunnel Disaster

19 Hallandsås Tunnel: Original Development by Drill and Blast with Grouting
20 Shotcrete

21 Shotcrete

22 Shotcrete

23 Tunneling in Weak Rock
24 Tunneling in Weak Rock
25 Tunneling in Weak Rock
26 Tunneling in Weak Rock
27 Tunneling in Weak Rock
28 Tunneling in Weak Rock
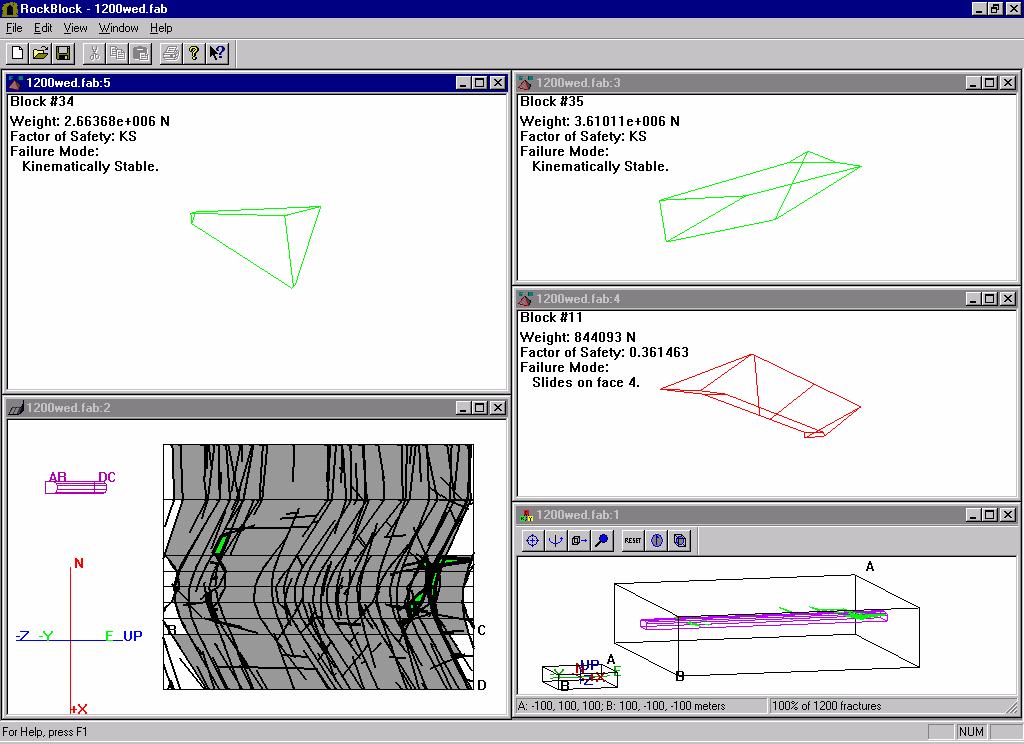
29 Tunneling in Weak Rock

30 Hallandsås Tunnel: TBM Tunneling

31 Inland Feeder Project
32 Structurally Controlled Tunnel Stability Wedge Formation from Hoek, 2000

33 Small Wedges - Raveling from Hoek, 2000
34 Rock Bolt Design from Hoek, 2000
35 Tunneling Sequence for Wedge Stability from Hoek, 2000

36 Kinematic Stability Analysis DFN Approach 3D Discrete Fracture Network Based on Field Measurement Simulated Slope Surfaces Reflect Effect of Fracture Size Rock Bridge Failure Reflected by Selective Increasing of Fracture Size


37 Tunnel Specification

38 Fracture Generation


39 Trace Maps and Wedge Identification


40 Wedge Stability Analysis
41 DFN Approach: Tunnel Scale Modeling Integrate Hydraulic, Grout, and Geologic Data During Tunnel Advance Condition Model to Groundwater Monitoring and Grout Take Update Model to Predict Structural Intersection Events


42 Äspö Project, Sweden


43 Äspö Tunnels Swedish Granite

44 Task 5 DFN Model - Deterministic Fractures
45 30-Apr Jan Nov-96 Weir Flux Time History Boundary Condition Total Flow into Weir Aug May Feb Nov Aug May Feb Nov Aug May Feb Nov Aug May Feb Nov Aug May Feb Nov Aug Jun Mar-91 Date Weir Flow Rate (l/min)
46 Head in Monitoring Section KAS06 MA66 KAS06 MA Oct Dec Mar Jun Sep Dec Mar Jun Sep Dec Mar Jun Sep Dec-93 Measured H-8 Date Head (m)
47 Head in Monitoring Section KAS08 MA81 KAS08 MA Measured H Oct Dec Mar Jun Sep Dec Mar Jun Sep Dec Mar Jun Sep Dec-93 Date Head (m)
48 Head in Monitoring Section KAS07 MA74 KAS07 MA Measured Simulated Date Head (m)
49 Geochemistry in Monitoring Well SA0813B SA0813B 100% 90% 80% Component Percentage 70% 60% 50% 40% 30% 20% 10% 0% 01-Oct Mar Sep Mar Sep Mar Sep-93 Date Sim Cpt 1 Sim Cpt 2 Sim Cpt 3 Sim Cpt 4 Sim Cpt 5 Sim Cpt 6 Sim Cpt 7 Data Cpt 1 Data Cpt 2 Data Cpt 3 Data Cpt 4 Data Cpt 5 Data Cpt 6 Data Cpt 7 14-Mar Sep Mar Sep Mar Aug Feb-97
50 Geochemistry in Monitoring Well SA2783A SA2783A 100% 90% 80% Component Percentage 70% 60% 50% 40% 30% 20% 10% 0% -10% -20% 01-Oct Mar Sep Mar Sep Mar Sep-93 Date Brine, Simulated Baltic Sea, Simulated Glacial, Simulated Meteoric, Simulated Brine, Measured Baltic Sea, Measured Glacial, Measured Meteoric, Measured 14-Mar Sep Mar Sep Mar Aug Feb-97
51 Grout Reliability Issues Grout Uptake to a Dominant Fracture
52 Grout Reliability Issues Subvertical Fractures Missed by Grouting and Confirmation Test Holes
53 Grout Reliability Issues Successful Confirmation Tests Signifying Nothing
54 Grout Reliability Issues Periodic/Regular Ungrouted Fractures

55 DFN Approach: Real time Modeling
 Continuum Model Source Sink b) Pathways Controlled by Fracture Geometry")
56 Tunneling Model: Realistic Geology and Hydrogeology Streamline for flow and transport defined perpendicular to pressure contours Pressure Contours a) Continuum Model Source Sink b) Pathways Controlled by Fracture Geometry

57 DFN Tunneling Model: Prediction of Difficult Ground DFN Incorporates Flow Barrier and Conductive Structures Correlate Geology, Grout Take and Hydraulic Response to Upcoming Structures Predict Structure Intersections Direct Interaction with Contractor

58 Tunneling Model Demonstrate Grout Effectiveness Tunnel Impact Modeling without Grout Grouting Simulation Phreatic Surface Impacts at Distance Tunnel Inflows and Chemistry w/ and w/o Grouting
59 Monitoring Model: Establish Seasonal/ Diurnal Variations Site 910 Model Natural Variation in Phreatic Surface Establish Criteria for Identifying Potential Tunnel Effects Model Phreatic Surface as Tunneling Progresses Date Elevation (ft, MSL)
60 Monitoring Model Correlation to Tunnel Advance Head (m) Measured Simulated KAS07 MA Date Simulate Head Reponse (Predictive) at different tunnel inflow rates Update Model as tunnel advances Correlate phreatic responses to Tunnel Advance (if any)
61 Concluding Remarks DFN Approach can provide a methodology for: Constructing a realistic hydrogeological model of local and regional scale responses Predicting grout efficiency Predicting inflows into the tunnel Mitigating reduction in the groundwater table
GAMINGRE 8/1/ of 7
 FYE 09/30/92 JULY 92 0.00 254,550.00 0.00 0 0 0 0 0 0 0 0 0 254,550.00 0.00 0.00 0.00 0.00 254,550.00 AUG 10,616,710.31 5,299.95 845,656.83 84,565.68 61,084.86 23,480.82 339,734.73 135,893.89 67,946.95
Variability and trends in daily minimum and maximum temperatures and in diurnal temperature range in Lithuania, Latvia and Estonia
 Variability and trends in daily minimum and maximum temperatures and in diurnal temperature range in Lithuania, Latvia and Estonia Jaak Jaagus Dept. of Geography, University of Tartu Agrita Briede Dept.
Analysis of mining deformations based on PSInSAR technique case study of the Walbrzych coal mines (Poland)
") Analysis of mining deformations based on PSInSAR technique case study of the Walbrzych coal mines (Poland) Dr. Jan Blachowski, Dr. Wojciech Milczarek Faculty of Geoengineering, Mining and Geology, Wroclaw
Analysis of mining deformations based on PSInSAR technique case study of the Walbrzych coal mines (Poland) Dr. Jan Blachowski, Dr. Wojciech Milczarek Faculty of Geoengineering, Mining and Geology, Wroclaw
ENGINEERING GEOLOGY AND ROCK ENGINEERING
 1 ENGINEERING GEOLOGY AND ROCK ENGINEERING HANDBOOK NO. 2 Norwegian Group for Rock Mechanics (NBG) www.bergmekanikk.com Prepared in co-operation with Norwegian Tunnelling Society (NFF) Issued in 2000 SECRETARIAT:
Background. Developing a FracMan DFN Model. Fractures, FracMan and Fragmentation Applications of DFN Models to Block & Panel Caving
 Background Golder Associates are one of the pioneering groups in the use of the Discrete Fracture Network (DFN) approach. DFN models seek to describe the heterogeneous nature of fractured rock masses by
Technical note on seasonal adjustment for M0
 Technical note on seasonal adjustment for M0 July 1, 2013 Contents 1 M0 2 2 Steps in the seasonal adjustment procedure 3 2.1 Pre-adjustment analysis............................... 3 2.2 Seasonal adjustment.................................
Annual Average NYMEX Strip Comparison 7/03/2017
 Annual Average NYMEX Strip Comparison 7/03/2017 To Year to Year Oil Price Deck ($/bbl) change Year change 7/3/2017 6/1/2017 5/1/2017 4/3/2017 3/1/2017 2/1/2017-2.7% 2017 Average -10.4% 47.52 48.84 49.58
Quantification of energy losses caused by blade icing and the development of an Icing Loss Climatology
 Quantification of energy losses caused by blade icing and the development of an Icing Loss Climatology Using SCADA data from Scandinavian wind farms Staffan Lindahl Winterwind 201 1 SAFER, SMARTER, GREENER
METHODOLOGY FOR ROCK CONDITION ASSESSMENT AND ROCK CONSTRUCTION DESIGN IN ACCORDANCE WITH THE OBSERVATIONAL METHOD
 METHODOLOGY FOR ROCK CONDITION ASSESSMENT AND ROCK CONSTRUCTION DESIGN IN ACCORDANCE WITH THE OBSERVATIONAL METHOD Åsa Fransson, Johan Thörn, Sara Kvartsberg, Gunnar Gustafson Chalmers University of Technology,
Underground nuclear waste storage
 Underground nuclear waste storage Groundwater flow and radionuclide transport Jan-Olof Selroos Cargese Summer School, July 5, 2018 Contents: Concept for geological disposal of nuclear waste A few words
TBM erection chamber HALLANDSÅS TUNNELS. Mid-adit. Hallandsås ridge. Probe hole. 06 June 2009
 TBM erection chamber HALLANDSÅS TUNNELS Mid-adit Hallandsås ridge 06 June 2009 Probe hole General project information Part of the West coast line railway project in South Sweden 2 tunnels 8.5 km long with
Winter Season Resource Adequacy Analysis Status Report
 Winter Season Resource Adequacy Analysis Status Report Tom Falin Director Resource Adequacy Planning Markets & Reliability Committee October 26, 2017 Winter Risk Winter Season Resource Adequacy and Capacity
PROBABILISTIC TRANSPORT PATH ANALYSIS THROUGH THREE-DIMENSIONAL DISCRETE FRACTURE NETWORKS FOR UNDERGROUND RADIOACTIVE WASTE DISPOSAL FACILITIES
 th International Conference on Probabilistic Safety Assessment and Management (PSAM ) PROBABILISTIC TRANSPORT PATH ANALYSIS THROUGH THREE-DIMENSIONAL DISCRETE FRACTURE NETWORKS FOR UNDERGROUND RADIOACTIVE
Location. Datum. Survey. information. Etrometa. Step Gauge. Description. relative to Herne Bay is -2.72m. The site new level.
 Tide Gauge Location OS: 616895E 169377N WGS84: Latitude: 51 o 22.919196 N Longitude: 01 o 6.9335907 E Instrument Type Etrometa Step Gauge Benchmarks Benchmark TGBM = 5.524m above Ordnance Datum Newlyn
Climatography of the United States No
 Climate Division: AK 5 NWS Call Sign: ANC Month (1) Min (2) Month(1) Extremes Lowest (2) Temperature ( F) Lowest Month(1) Degree s (1) Base Temp 65 Heating Cooling 90 Number of s (3) Jan 22.2 9.3 15.8
Application of Real-Time Rainfall Information System to CSO control. 2 October 2011 Naruhito Funatsu METAWATER Co., Ltd.
 Application of Real-Time Rainfall Information System to CSO control 2 October 2011 Naruhito Funatsu METAWATER Co., Ltd. Presentation Points Objectives To verify the applicability of the real-time rainfall
Location. Datum. Survey. information. Etrometa. Step Gauge. Description. relative to Herne Bay is -2.72m. The site new level.
 Tide Gauge Location OS: 616895E 169377N WGS84: Latitude: 51 o 22.919196 N Longitude: 01 o 6.9335907 E Instrument Type Etrometa Step Gauge Benchmarks Benchmark TGBM = 5.524m above Ordnance Datum Newlyn
Oktoberforum 2005: Case Histories in Engineering Geology and Geotechnical Engineering,, 4 th Oct. 2005, Petaling Jaya
 IEM-GSM Oktoberforum 2005: Case Histories in Engineering Geology and Geotechnical Engineering,, 4 th Oct. 2005, Petaling Jaya DISCONTINUITIES STUDY AND ROCK SLOPES STABILITY ANALYSIS FOR ROCK MASS AT DAMANSARA
GUIDELINES FOR OPEN PIT SLOPE DESIGN EDITORS: JOHN READ, PETER STACEY # & CSIRO. J x PUBLISHING
 GUIDELINES FOR OPEN PIT SLOPE DESIGN EDITORS: JOHN READ, PETER STACEY # & CSIRO J x PUBLISHING S Contents Preface and acknowledgments xiii 1 Fundamentals of slope design 1 Peter Stacey 1.1 Introduction
Effects of climate change on landslide frequencies in landslide prone districts in Sri Lanka; Overview
 Effects of climate change on landslide frequencies in landslide prone districts in Sri Lanka; Overview T. D. Rathnaweera 1)., M. P. Palihawadana 2)., H. L. L. Rangana 3). and Dr. U. P. Nawagamuwa 4). Abstract
Challenges and Innovations in Site investigation, Ground Behaviour Prediction and Risk Assessment for Deep Hard Rock Tunnels
 OCT 4 6, 2015 Queens University Kingston, ON Canada Challenges and Innovations in Site investigation, Ground Behaviour Prediction and Risk Assessment for Deep Hard Rock Tunnels Dr. Mark Diederichs, PhD.,
Underground Excavation Design Classification
 Underground Excavation Design Underground Excavation Design Classification Alfred H. Zettler alfred.zettler@gmx.at Rock Quality Designation Measurement and calculation of RQD Rock Quality Designation index
Pre-Calc Chapter 1 Sample Test. D) slope: 3 4
 slope: 3 4") Pre-Calc Chapter 1 Sample Test 1. Use the graphs of f and g to evaluate the function. f( x) gx ( ) (f o g)(-0.5) 1 1 0 4. Plot the points and find the slope of the line passing through the pair of points.
Pre-Calc Chapter 1 Sample Test 1. Use the graphs of f and g to evaluate the function. f( x) gx ( ) (f o g)(-0.5) 1 1 0 4. Plot the points and find the slope of the line passing through the pair of points.
PRELIMINARY DRAFT FOR DISCUSSION PURPOSES
 Memorandum To: David Thompson From: John Haapala CC: Dan McDonald Bob Montgomery Date: February 24, 2003 File #: 1003551 Re: Lake Wenatchee Historic Water Levels, Operation Model, and Flood Operation This
AASHTO Rigid Pavement Design
 AASHTO Rigid Pavement Design Dr. Antonis Michael Frederick University Notes Courtesy of Dr. Christos Drakos University of Florida 1. Introduction Empirical design based on the AASHO road test: Over 200
Project No India Basin Shadow Study San Francisco, California, USA
 Project No. 432301 India Basin Shadow Study San Francisco, California, USA Numerical Modelling Studies 04 th June 2018 For Build Inc. Report Title: India Basin Shadow Study San Francisco, California, USA
«Near Surface Geothermal Resources in the Territory of the Alpine Space» Pilot Study Switzerland, Davos
 Departement Umweltwissenschaften «Near Surface Geothermal Resources in the Territory of the Alpine Space» Pilot Study Switzerland, Davos Peter Huggenberger Stefan Scheidler Birte Anders Projectpartners:
Construction Technical Specifications on Rock-Foundation Excavating Engineering of Hydraulic Structures
 DL Electric Power Industry Standard of the People's Republic of China P DL I T 5389-- Construction Technical Specifications on Rock-Foundation Excavating Engineering of Hydraulic Structures DL/T 5389-
Table of Contents Development of rock engineering 2 When is a rock engineering design acceptable 3 Rock mass classification
 Table of Contents 1 Development of rock engineering...1 1.1 Introduction...1 1.2 Rockbursts and elastic theory...4 1.3 Discontinuous rock masses...6 1.4 Engineering rock mechanics...7 1.5 Geological data
Weather Products for Decision Support Tools Joe Sherry April 10, 2001
 Weather Products for Decision Support Tools Joe Sherry National Convective Weather Forecast (NCWF) Computer generated graphical forecast extending 0-1 hours, updated every 5 minutes Conservative forecast
Salem Economic Outlook
 Salem Economic Outlook November 2012 Tim Duy, PHD Prepared for the Salem City Council November 7, 2012 Roadmap US Economic Update Slow and steady Positives: Housing/monetary policy Negatives: Rest of world/fiscal
Andrew Lee BEng (Hons) CEng MIStructE FGS FPWS
 CEng MIStructE FGS FPWS") Jim Twaddle BSc (Hons) FGS Andrew Lee BEng (Hons) CEng MIStructE FGS FPWS 22 January 2010 ME50231/RE001 !! "# # $ " %! &' ( "# # $ ) # ' %! "# # $ # "# # $ * + # "# # $ "! # "# # $, # "# # $! -( +.!!/
Jim Twaddle BSc (Hons) FGS Andrew Lee BEng (Hons) CEng MIStructE FGS FPWS 22 January 2010 ME50231/RE001 !! "# # $ " %! &' ( "# # $ ) # ' %! "# # $ # "# # $ * + # "# # $ "! # "# # $, # "# # $! -( +.!!/
Presentations at NEA IRT hearing 12 December, 13:30 17:00. Geology, rock mechanics, hydraulic processes, (bio) geochemistry, hydrochemistry
 geochemistry, hydrochemistry") Presentations at NEA IRT hearing 12 December, 13:30 17:00 Geology, rock mechanics, hydraulic processes, (bio) geochemistry, hydrochemistry NEA IRT hearing 12 December 2 Example question #1 Geology Can
Presentations at NEA IRT hearing 12 December, 13:30 17:00 Geology, rock mechanics, hydraulic processes, (bio) geochemistry, hydrochemistry NEA IRT hearing 12 December 2 Example question #1 Geology Can
Hydrogeology and Simulated Effects of Future Water Use and Drought in the North Fork Red River Alluvial Aquifer: Progress Report
 Hydrogeology and Simulated Effects of Future Water Use and Drought in the North Fork Red River Alluvial Aquifer: Progress Report Developed in partnership with the Oklahoma Water Resources Board S. Jerrod
REPORT ON LABOUR FORECASTING FOR CONSTRUCTION
 REPORT ON LABOUR FORECASTING FOR CONSTRUCTION For: Project: XYZ Local Authority New Sample Project Contact us: Construction Skills & Whole Life Consultants Limited Dundee University Incubator James Lindsay
Pressure Grouting of Fractured Bedrock to Control Acid Mine Drainage
 WATER RESOURCES AT RISK May 14-18, 1995 Denver American Institute of Hydrology Pressure Grouting of Fractured Bedrock to Control Acid Mine Drainage S. A. Effner, G. D. Vandersluis, and V. Straskraba Hydro-Geo
Climatography of the United States No
 Climate Division: CA 4 NWS Call Sign: Elevation: 2 Feet Lat: 37 Month (1) Min (2) Month(1) Extremes Lowest (2) Temperature ( F) Lowest Month(1) Degree s (1) Base Temp 65 Heating Cooling 1 Number of s (3)
Climatography of the United States No
 Climate Division: CA 5 NWS Call Sign: Elevation: 6 Feet Lat: 37 Month (1) Min (2) Month(1) Extremes Lowest (2) Temperature ( F) Lowest Month(1) Degree s (1) Base Temp 65 Heating Cooling 1 Number of s (3)
Climatography of the United States No
 Climate Division: CA 4 NWS Call Sign: Elevation: 13 Feet Lat: 36 Month (1) Min (2) Month(1) Extremes Lowest (2) Temperature ( F) Lowest Month(1) Degree s (1) Base Temp 65 Heating Cooling 1 Number of s
January 22, Coronado National Forest 300 West Congress Street Tucson, AZ Jim Upchurch, Forest Supervisor. Dear Mr.
 January 22, 2015 Coronado National Forest 300 West Congress Street Tucson, AZ 85701 Attn: Jim Upchurch, Forest Supervisor Dear Mr. Upchurch: In your letter dated January 16, 2015, you requested that Hudbay
Climatography of the United States No
 Climate Division: CA 5 NWS Call Sign: Elevation: 1,14 Feet Lat: 36 Month (1) Min (2) Month(1) Extremes Lowest (2) Temperature ( F) Lowest Month(1) Degree s (1) Base Temp 65 Heating Cooling 1 Number of
ENGINEERING GEOLOGY AND ROCK ENGINEERING ASPECTS OF OPERATION AND CLOSURE OF KBS-3
 ENGINEERING GEOLOGY AND ROCK ENGINEERING ASPECTS OF OPERATION AND CLOSURE OF KBS-3 DAVID SAIANG Principal Consultant SRK Consulting Sweden NEIL MARSHALL Corporate Consultant SRK Consulting UK 1 of XX SRK
To: Rishi Adhikari and Roger Skirrow From: Leslie Cho and Ian Darrach Alberta Transportation File: Date: June 30, 2016
 To: Rishi Adhikari and Roger Skirrow From: Leslie Cho and Ian Darrach Stantec File: Date: June, Reference: North Central Region Edson Site NC HWY :, Deer Lodge Spring Task C: Instrumentation Monitoring
Hydrologic budget of the ORW mitigation wetland, 2002
 Billabong Hydrology 2002 81 Hydrologic budget of the ORW mitigation wetland, 2002 Li Zhang and William J. Mitsch School of Natural Resources, The Ohio State University Introduction Understanding the hydrologic
Jayalath Ekanayake Jonas Tappolet Harald Gall Abraham Bernstein. Time variance and defect prediction in software projects: additional figures
 Jayalath Ekanayake Jonas Tappolet Harald Gall Abraham Bernstein TECHNICAL REPORT No. IFI-2.4 Time variance and defect prediction in software projects: additional figures 2 University of Zurich Department
Climatography of the United States No
 Climate Division: CA 6 NWS Call Sign: LAX Elevation: 1 Feet Lat: 33 Month (1) Min (2) Month(1) Extremes Lowest (2) Temperature ( F) Lowest Month(1) Degree s (1) Base Temp 65 Heating Cooling 1 Number of
Climatography of the United States No
 Climate Division: CA 6 NWS Call Sign: TOA Elevation: 11 Feet Lat: 33 2W Temperature ( F) Month (1) Min (2) Month(1) Extremes Lowest (2) Lowest Month(1) Degree s (1) Base Temp 65 Heating Cooling 1 Number
Effects of the slope toe evolution on the behaviour of a slow-moving large landslide
 Effects of the slope toe evolution on the behaviour of a slow-moving large landslide A. Ferrari, A. Ledesma, J. Corominas MOUNTAIN RISKS - Topic Meeting WB1 Dynamic spatial modelling of landslide hazards
CAVE CLIMATE COMPARISON ACTIVITY BETWEEN THE SURFACE AND THE CAVERN
 CAVE CLIMATE COMPARISON ACTIVITY BETWEEN THE SURFACE AND THE CAVERN Created by Ray Bowers For the Virtual Center for the Environment (VCE) A part of the Institute of Natural Resources Analysis and Management
Monthly Magnetic Bulletin
 BRITISH GEOLOGICAL SURVEY Jim Carrigan Observatory Prudhoe Bay Monthly Magnetic Bulletin May 2014 14/05/JC JIM CARRIGAN OBSERVATORY MAGNETIC DATA 1. Introduction Jim Carrigan observatory is the fourth
Rock slope rock wedge stability
 Engineering manual No. 28 Updated: 02/2018 Rock slope rock wedge stability Program: Rock stability File: Demo_manual_28.gsk The aim of the chapter of this engineering manual is to explain a rock slope
Modelling Denitrification
 Modelling Denitrification Tom Anderson, Mike Fasham National Oceanography Centre, Southampton, UK Vladimir Ryabchenko, Viktor Gorchakov P.P. Shirshov Institute of Oceanology, St Petersburg, Russia Questions:
Geotechnical Deskstudy for Proposed Windfarm NV NORDISK VINDKRAFT AB. Fjällberg. Östersund , rev Fjällberg
 NV NORDISK VINDKRAFT AB Östersund 23-06-2011, rev 06-07-2012 Geotechnical Deskstudy for Proposed Windfarm Date 23-06-2011, rev 06-07-2012 Project number 61811144691000 JONSSON EVA TAJANI KRISTINA TAJANI
CHAPTER 1 EXPRESSIONS, EQUATIONS, FUNCTIONS (ORDER OF OPERATIONS AND PROPERTIES OF NUMBERS)
") Aug 29 CHAPTER 1 EXPRESSIONS, EQUATIONS, FUNCTIONS (ORDER OF OPERATIONS AND PROPERTIES OF NUMBERS) Sept 5 No School Labor Day Holiday CHAPTER 1 EXPRESSIONS, EQUATIONS, FUNCTIONS (RELATIONS AND FUNCTIONS)
Aug 29 CHAPTER 1 EXPRESSIONS, EQUATIONS, FUNCTIONS (ORDER OF OPERATIONS AND PROPERTIES OF NUMBERS) Sept 5 No School Labor Day Holiday CHAPTER 1 EXPRESSIONS, EQUATIONS, FUNCTIONS (RELATIONS AND FUNCTIONS)
Technical note on seasonal adjustment for Capital goods imports
 Technical note on seasonal adjustment for Capital goods imports July 1, 2013 Contents 1 Capital goods imports 2 1.1 Additive versus multiplicative seasonality..................... 2 2 Steps in the seasonal
Butte County Drought Task Force December 1, :00 AM noon 202 Mira Loma Drive, Tahoe Room Oroville, CA. Agenda
 WATER AND RESOURCE CONSERVATION 308 Nelson Avenue, Oroville, CA 95965 Telephone: (530) 538-4343 Fax: (530) 538-3807 www.buttecounty.net/waterandresource bcwater@buttecounty.net Paul Gosselin, Director
A High Resolution Vertical Gradient Approach for Delineation of Hydrogeologic Units at a Contaminated Sedimentary Rock Field Site
 A High Resolution Vertical Gradient Approach for Delineation of Hydrogeologic Units at a Contaminated Sedimentary Rock Field Site Jessica Meyer 2013 - Solinst Symposium High Resolution, Depth-Discrete
What is the difference between Weather and Climate?
 What is the difference between Weather and Climate? Objective Many people are confused about the difference between weather and climate. This makes understanding the difference between weather forecasts
Integrating Weather Forecasts into Folsom Reservoir Operations
 Integrating Weather Forecasts into Folsom Reservoir Operations California Extreme Precipitation Symposium September 6, 2016 Brad Moore, PE US Army Corps of Engineers Biography Brad Moore is a Lead Civil
Drilled Shafts for Bridge Foundation Stability Improvement Ohio 833 Bridge over the Ohio River An Update
 Drilled Shafts for Bridge Foundation Stability Improvement Ohio 833 Bridge over the Ohio River An Update Meigs County, Ohio Mason County, West Virginia By Stan Harris, P.E. and Eric Kistner, P.E. FMSM
Rock Suitability Classification for POPLU
 The research leading to these results has received funding from the European Union's European Atomic Energy Community's (Euratom) Seventh Framework Programme FP7/2011-2013, 2013, under Grant Agreement
10. GEOTECHNICAL EXPLORATION PROGRAM
 Geotechnical site investigations should be conducted in multiple phases to obtain data for use during the planning and design of the tunnel system. Geotechnical investigations typically are performed in
7. Foundation and Slope Stability
 The Asian Nuclear Safety Network 7. Foundation and Slope Stability (SER 2.5.4 & 2.5.5) Taek-Mo SHIM k147stm@kins.re.kr Korea Institute of Nuclear Safety Structural Systems and Site Evaluation Department
Life Cycle of Convective Systems over Western Colombia
 Life Cycle of Convective Systems over Western Colombia Meiry Sakamoto Uiversidade de São Paulo, São Paulo, Brazil Colombia Life Cycle of Convective Systems over Western Colombia Convective System (CS)
Monthly Magnetic Bulletin
 BRITISH GEOLOGICAL SURVEY Ascension Island Observatory Monthly Magnetic Bulletin March 2017 17/03/AS Crown copyright; Ordnance Survey ASCENSION ISLAND OBSERVATORY MAGNETIC DATA 1. Introduction Ascension
Climatography of the United States No
 No. 2 1971-2 Asheville, North Carolina 2881 COOP ID: 46175 Climate Division: CA 6 NWS Call Sign: 3L3 Elevation: 1 Feet Lat: 33 Month (1) Min (2) Month(1) Extremes Lowest (2) Temperature ( F) Lowest Month(1)
Climatography of the United States No
 No. 2 1971-2 Asheville, North Carolina 2881 COOP ID: 42713 Climate Division: CA 7 NWS Call Sign: Elevation: -3 Feet Lat: 32 Month (1) Min (2) Month(1) Extremes Lowest (2) Temperature ( F) Lowest Month(1)
FORECAST-BASED OPERATIONS AT FOLSOM DAM AND LAKE
 FORECAST-BASED OPERATIONS AT FOLSOM DAM AND LAKE 255 237 237 237 217 217 217 200 200 200 0 163 131 Bridging the Gap163Conference 255 0 132 255 0 163 122 The Dana on Mission Bay San Diego, CA January 28,
Average 175, , , , , , ,046 YTD Total 1,098,649 1,509,593 1,868,795 1,418, ,169 1,977,225 2,065,321
 AGRICULTURE 01-Agriculture JUL 2,944-4,465 1,783-146 102 AUG 2,753 6,497 5,321 1,233 1,678 744 1,469 SEP - 4,274 4,183 1,596 - - 238 OCT 2,694 - - 1,032 340-276 NOV 1,979-5,822 637 3,221 1,923 1,532 DEC
Average 175, , , , , , ,940 YTD Total 944,460 1,284,944 1,635,177 1,183, ,954 1,744,134 1,565,640
 AGRICULTURE 01-Agriculture JUL 2,944-4,465 1,783-146 102 AUG 2,753 6,497 5,321 1,233 1,678 744 1,469 SEP - 4,274 4,183 1,596 - - 238 OCT 2,694 - - 1,032 340-276 NOV 1,979-5,822 637 3,221 1,923 1,532 DEC
KING EDWARD POINT OBSERVATORY MAGNETIC DATA
 BRITISH GEOLOGICAL SURVEY King Edward d Point Observatory Monthly Magnetic Bulletin May 2018 18/05/KE King Edward Point (UK) Maps British Antarctic Survey KING EDWARD POINT OBSERVATORY MAGNETIC DATA 1.
KING EDWARD POINT OBSERVATORY MAGNETIC DATA
 BRITISH GEOLOGICAL SURVEY King Edward d Point Observatory Monthly Magnetic Bulletin September 2018 18/09/KE King Edward Point (UK) Maps British Antarctic Survey KING EDWARD POINT OBSERVATORY MAGNETIC DATA
ISOLINE MAPS and RAINFALL
 ISOLINE MAPS and RAINFALL Geography 101 Lab Name Purpose: Introduce students to one of the most common and useful types of maps used in studying the natural environment. When completed, the student should
Climatography of the United States No
 Month (1) Min (2) Month(1) Extremes Lowest (2) Temperature ( F) Lowest Month(1) Degree s (1) Base Temp 65 Heating Cooling 100 Number of s (3) Jan 63.9 39.3 51.6 86 1976 16 56.6 1986 20 1976 2 47.5 1973
Jackson County 2018 Weather Data 67 Years of Weather Data Recorded at the UF/IFAS Marianna North Florida Research and Education Center
 Jackson County 2018 Weather Data 67 Years of Weather Data Recorded at the UF/IFAS Marianna North Florida Research and Education Center Doug Mayo Jackson County Extension Director 1952-2008 Rainfall Data
Climatography of the United States No
 Temperature ( F) Month (1) Min (2) Month(1) Extremes Lowest (2) Lowest Month(1) Degree s (1) Base Temp 65 Heating Cooling 100 Number of s (3) Jan 32.8 21.7 27.3 62 1918 1 35.8 1983-24 1950 29 10.5 1979
KING EDWARD POINT OBSERVATORY MAGNETIC DATA
 BRITISH GEOLOGICAL SURVEY King Edward d Point Observatory Monthly Magnetic Bulletin October 2018 18/10/KE King Edward Point (UK) Maps British Antarctic Survey KING EDWARD POINT OBSERVATORY MAGNETIC DATA
REDWOOD VALLEY SUBAREA
 Independent Science Review Panel Conceptual Model of Watershed Hydrology, Surface Water and Groundwater Interactions and Stream Ecology for the Russian River Watershed Appendices A-1 APPENDIX A A-2 REDWOOD
Jackson County 2014 Weather Data
 Jackson County 2014 Weather Data 62 Years of Weather Data Recorded at the UF/IFAS Marianna North Florida Research and Education Center Doug Mayo Jackson County Extension Director 1952-2008 Rainfall Data
National Integrated Drought Information System. Southeast US Pilot for Apalachicola- Flint-Chattahoochee River Basin 20-March-2012
 National Integrated Drought Information System Southeast US Pilot for Apalachicola- Flint-Chattahoochee River Basin 20-March-2012 Current drought status from Drought Monitor http://www.drought.unl.edu/dm/monitor.html
In Centre, Online Classroom Live and Online Classroom Programme Prices
 In Centre, and Online Classroom Programme Prices In Centre Online Classroom Foundation Certificate Bookkeeping Transactions 430 325 300 Bookkeeping Controls 320 245 225 Elements of Costing 320 245 225
Climatography of the United States No
 Climate Division: CA 7 NWS Call Sign: Month (1) Min (2) Month(1) Extremes Lowest (2) Temperature ( F) Lowest Month(1) Degree s (1) Base Temp 65 Heating Cooling 100 Number of s (3) Jan 54.4 36.9 45.7 77+
Evapo-transpiration Losses Produced by Irrigation in the Snake River Basin, Idaho
 Nov 7, 2007 DRAFT Evapo-transpiration Losses Produced by Irrigation in the Snake River Basin, Idaho Wendell Tangborn and Birbal Rana HyMet Inc. Vashon Island, WA Abstract An estimated 8 MAF (million acre-feet)
Temporal Trends in Forest Fire Season Length
 Temporal Trends in Forest Fire Season Length Alisha Albert-Green aalbertg@sfu.ca Department of Statistics and Actuarial Science Simon Fraser University Stochastic Modelling of Forest Dynamics Webinar March
How are adding integers and subtracting integers related? Work with a partner. Use integer counters to find 4 2. Remove 2 positive counters.
 . How are adding integers and subtracting integers related? ACTIVITY: Work with a partner. Use integer counters to find 4. Start with 4 positive counters. Remove positive counters. What is the total number
National Integrated Drought Information System Southeast US Pilot for Apalachicola- Flint-Chattahoochee River Basin. 22 May 2012
 National Integrated Drought Information System Southeast US Pilot for Apalachicola- Flint-Chattahoochee River Basin 22 May 2012 Outline Welcome Keith Ingram, UF, Southeast Climate Consortium Current drought
Jackson County 2013 Weather Data
 Jackson County 2013 Weather Data 61 Years of Weather Data Recorded at the UF/IFAS Marianna North Florida Research and Education Center Doug Mayo Jackson County Extension Director 1952-2008 Rainfall Data
Session 3: Geology and Rock Mechanics Fundamentals
 Session 3: Geology and Rock Mechanics Fundamentals Geotechnical Engineering Appreciation Course (Jointly organised by IES Academy and GeoSS) Dr Zhou Yingxin, Senior Principal Engineer, DSTA Adjuct Associate
Climatography of the United States No
 Climate Division: CA 6 NWS Call Sign: Month (1) Min (2) Month(1) Extremes Lowest (2) Temperature ( F) Lowest Month(1) Degree s (1) Base Temp 65 Heating Cooling 1 Number of s (3) Jan 67.5 42. 54.8 92 1971
Climatography of the United States No
 Climate Division: CA 5 NWS Call Sign: Month (1) Min (2) Month(1) Extremes Lowest (2) Temperature ( F) Lowest Month(1) Degree s (1) Base Temp 65 Heating Cooling 100 Number of s (3) Jan 56.6 36.5 46.6 81
Climatography of the United States No
 Climate Division: CA 5 NWS Call Sign: Month (1) Min (2) Month(1) Extremes Lowest (2) Temperature ( F) Lowest Month(1) Degree s (1) Base Temp 65 Heating Cooling 100 Number of s (3) Jan 44.8 25.4 35.1 72
Climatography of the United States No
 Climate Division: CA 4 NWS Call Sign: Month (1) Min (2) Month(1) Extremes Lowest (2) Temperature ( F) Lowest Month(1) Degree s (1) Base Temp 65 Heating Cooling 100 Number of s (3) Jan 49.4 37.5 43.5 73
Climatography of the United States No
 Climate Division: CA 6 NWS Call Sign: Month (1) Min (2) Month(1) Extremes Lowest (2) Temperature ( F) Lowest Month(1) Degree s (1) Base Temp 65 Heating Cooling 100 Number of s (3) Jan 69.4 46.6 58.0 92
Climatography of the United States No
 Climate Division: CA 4 NWS Call Sign: Month (1) Min (2) Month(1) Extremes Lowest (2) Temperature ( F) Lowest Month(1) Degree s (1) Base Temp 65 Heating Cooling 1 Number of s (3) Jan 58.5 38.8 48.7 79 1962
Climatography of the United States No
 Climate Division: CA 4 NWS Call Sign: Month (1) Min (2) Month(1) Extremes Lowest (2) Temperature ( F) Lowest Month(1) Degree s (1) Base Temp 65 Heating Cooling 100 Number of s (3) Jan 55.6 39.3 47.5 77
Climatography of the United States No
 Climate Division: CA 1 NWS Call Sign: Month (1) Min (2) Month(1) Extremes Lowest (2) Temperature ( F) Lowest Month(1) Degree s (1) Base Temp 65 Heating Cooling 100 Number of s (3) Jan 57.9 38.9 48.4 85
Climatography of the United States No
 Climate Division: CA 1 NWS Call Sign: Month (1) Min (2) Month(1) Extremes Lowest (2) Temperature ( F) Lowest Month(1) Degree s (1) Base Temp 65 Heating Cooling 1 Number of s (3) Jan 57.8 39.5 48.7 85 1962
July 2017 LOGISTICAL HARMONY
 Li s&staging(wpedestriansidewalkprot.) (4/18/through7/18/2017) July2017 101BelvidereEastFaçadeWorkPipeStaging (4/18/through7/18/2017) 101BelvidereEastFaçadeWork (through8/31/2017) Legend RampaccesstoTMCX
Effects of depositional and diagenetic heterogeneitites on fluid flow in Plio -- Pleistocene reefal carbonates of the Southern Dominican Republic
 Viviana Díaz was born in Puerto Rico and received her undergraduate degree from the University of Puerto Rico and her Master's at the University of North Carolina. She is currently working on her PhD at
Cost of Inflow Forecast Uncertainty for Day Ahead Hydropower Production Scheduling
 Cost of Inflow Forecast Uncertainty for Day Ahead Hydropower Production Scheduling HEPEX 10 th University Workshop June 25 th, 2014 NOAA Center for Weather and Climate Thomas D. Veselka and Les Poch Argonne