Weather Products for Decision Support Tools Joe Sherry April 10, 2001
|
|
|
- Vanessa Hawkins
- 5 years ago
- Views:
Transcription

1 Weather Products for Decision Support Tools Joe Sherry
2 National Convective Weather Forecast (NCWF) Computer generated graphical forecast extending 0-1 hours, updated every 5 minutes Conservative forecast useful for rerouting (bias of ~1) Deterministic forecast (doesn t use probabilities) Better at forecasting lines than air mass storms TFM decision support more interested in lines Current operational forecast is an extrapolation only Lacks initiation, growth and decay algorithms Ongoing R&D will lead to better/longer forecasts (2-3 hrs) Limited vertical storm definition Better vertical definition may increase available capacity

3 2000Z Storm in Steady State Forecast Accuracy Acceptable
4 Collaborative Convective Forecast Product (CCFP) Human generated, collaborative, graphical forecast extending 0-6 hours, updated several times a day Non-conservative forecast less useful for rerouting (bias >1) Over forecasts, reducing capacity more than necessary Probabilistic forecast (e.g., 40% chance of 60% coverage) May be better at forecasting air mass storms Helped by over forecasting and human generation TFM decision support more interested in lines Limited vertical storm definition Better vertical definition may increase capacity
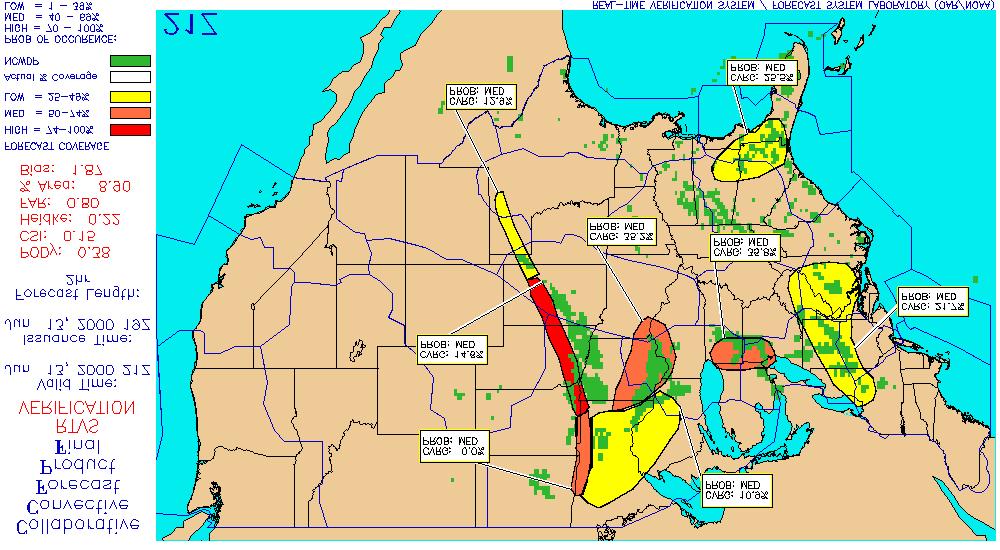
5 CCFP
6 Convective Weather R&D FAA NWS AWR funding NCWF, CCFP, TCWF Funding THOR CWSU meteorologists supporting CCFP AWC Distributing NCWF and supporting CCFP Airlines FSL Meteorologists supporting CCFP Inter-comparison exercise project is evaluating forecasts NCAR NCWF and Auto-Nowcaster MIT/LL TCWF
7 NCAR s Auto-Nowcaster (AN) Augments extrapolation forecast with initiation, growth and decay Based on storm, boundary-layer and cloud characteristics Derives thunderstorm likelihood fields (polygons) that are weighted, combined and compared to thresholds Linked to individual NEXRADs and requires mosaic for a national product Improves accuracy over extrapolation alone Needs improved growth and decay algorithms, greater spatial coverage, longer time periods (0-3 hrs) Needs vertical storm definition
8 Other Research Thunderstorm Operational Research (THOR) project Focussing on 0-2 hour convective weather forecast Plans to establish two regional test and evaluation sites Goal is to develop a seamless national product Working closely with weather research and aviation communities MIT/LL is developing a regional convective weather forecast by leveraging their terminal area work
9 CAASD s NCWF Weather Assessment 1-Hour NCWF Assessment (Polygon Comparison Methodology) POD FAR BIAS May-99 Jun-99 Jul-99 Aug-99 Sep-99 Oct-99 Nov-99 Dec-99 Jan-00 Feb-00 Mar-00 Apr-00 May-00 Jun-00 Jul-00 Aug-00 Sep-00 Apr-99 Statistical Results
10 CAASD s NCWF Weather Assessment (continued) Northern Extent of Missed 1-hr Forecasts, Where Extrapolation Possible Frequency Northern extent of 92% of missed forecasts <30 nmi, 96% <40nmi. Southern extent is 94% and 98%, respectively. Improvement detected between 1999 and Currently, applicable to mature lines only Missed Forecast (nmi) Apr-1999 May-1999 Jun-1999 Jul-1999 Aug-1999 Sep-1999 Oct-1999 Nov-1999 Dec-1999 Jan-2000 Feb-2000 Mar-2000 Apr-2000 May-2000 Jun-2000 Jul-2000
11 Conclusion Convective weather research is proceeding in a positive direction Accurate 2-hour forecasts of convective lines are anticipated in the near term (accurate 3-hour forecast may be possible)
GAMINGRE 8/1/ of 7
 FYE 09/30/92 JULY 92 0.00 254,550.00 0.00 0 0 0 0 0 0 0 0 0 254,550.00 0.00 0.00 0.00 0.00 254,550.00 AUG 10,616,710.31 5,299.95 845,656.83 84,565.68 61,084.86 23,480.82 339,734.73 135,893.89 67,946.95
Advances in Weather Technology
 Advances in Weather Technology Dr. G. Brant Foote National Center for Atmospheric Research 16 May 2001 NCAR Research Results in Aviation Weather Built on the foundation of the nation s long-standing investment
National Convective Weather Forecasts Cindy Mueller
 National Convective Weather Forecasts Cindy Mueller National Center for Atmospheric Research Research Applications Program National Forecast Demonstration 2-4-6 hr Convection Forecasts Collaborative forecast
Corridor Integrated Weather System (CIWS) MIT Lincoln Laboratory. CIWS D. Meyer 10/21/05
 MIT Lincoln Laboratory. CIWS D. Meyer 10/21/05") Corridor Integrated Weather System () Outline Example of Weather Impacting Air traffic Impacts on worst delay day Ways to reduce delay Improve forecasts Aid traffic flow management Aviation Delay Problem
Corridor Integrated Weather System () Outline Example of Weather Impacting Air traffic Impacts on worst delay day Ways to reduce delay Improve forecasts Aid traffic flow management Aviation Delay Problem
Hazard assessment based on radar-based rainfall nowcasts at European scale The HAREN project
 Hazard assessment based on radar-based rainfall nowcasts at European scale The HAREN project Marc Berenguer, Daniel Sempere-Torres 3 OPERA radar mosaic OPERA radar mosaic: 213919 133 Precipitation observations
FPAW October Pat Murphy & David Bright NWS Aviation Weather Center
 FPAW October 2014 Pat Murphy & David Bright NWS Aviation Weather Center Overview Ensemble & Probabilistic Forecasts What AWC Is Doing Now Ensemble Processor What s In Development (NOAA Aviation Weather
INTEGRATING IMPROVED WEATHER FORECAST DATA WITH TFM DECISION SUPPORT SYSTEMS Joseph Hollenberg, Mark Huberdeau and Mike Klinker
 INTEGRATING IMPROVED WEATHER FORECAST DATA WITH TFM DECISION SUPPORT SYSTEMS Joseph Hollenberg, Mark Huberdeau and Mike Klinker The MITRE Corporation Center for Advanced Aviation System Development (CAASD)
Blend of UKMET and GFS 3hr increments F06 to F degree downloadable grid available on WIFS
 Blend of UKMET and GFS 3hr increments F06 to F36 1.25 degree downloadable grid available on WIFS WWW.AVIATIONWEATHER.GOV/WAFS Wind, Turbulence and Cb 2 3 New Products: All diagnostics mapped to Eddy Dissipation
Traffic Flow Management (TFM) Weather Rerouting Decision Support. Stephen Zobell, Celesta Ball, and Joseph Sherry MITRE/CAASD, McLean, Virginia
 Weather Rerouting Decision Support. Stephen Zobell, Celesta Ball, and Joseph Sherry MITRE/CAASD, McLean, Virginia") Traffic Flow Management (TFM) Weather Rerouting Decision Support Stephen Zobell, Celesta Ball, and Joseph Sherry MITRE/CAASD, McLean, Virginia Stephen Zobell, Celesta Ball, and Joseph Sherry are Technical
Traffic Flow Management (TFM) Weather Rerouting Decision Support Stephen Zobell, Celesta Ball, and Joseph Sherry MITRE/CAASD, McLean, Virginia Stephen Zobell, Celesta Ball, and Joseph Sherry are Technical
Weather Evaluation Team (WET)
") Weather Evaluation Team (WET) Presented to: Friends and Partners in Aviation Weather Kevin Johnston ATCSCC Tom Fahey Delta Air Lines 1 WET Membership FAA Denver ARTCC Atlanta ARTCC ATCSCC Minneapolis TRACON
Weather Evaluation Team (WET) Presented to: Friends and Partners in Aviation Weather Kevin Johnston ATCSCC Tom Fahey Delta Air Lines 1 WET Membership FAA Denver ARTCC Atlanta ARTCC ATCSCC Minneapolis TRACON
2001 The MITRE Corporation. ALL RIGHTS RESERVED.
 TRAFFIC FLOW MANAGEMENT (TFM) WEATHER REROUTING Joseph E. Sherry*, C.G. Ball, S.M. Zobell The MITRE Corporation, Center for Advanced Aviation System Development (CAASD), McLean, Virginia This work was
Tactical Weather Decision Support To Complement Strategic Traffic Flow Management for Convective Weather *
 4 th USA/Europe Air Traffic Management R&D Seminar Santa Fe, New Mexico 3-7 December 2001 Tactical Weather Decision Support To Complement Strategic Traffic Flow Management for Convective Weather * Dr.
Marilyn Wolfson, Convective PDT lead Roy Rasmussen, Convective PDT Alternate lead FPAW meeting, 19 Oct 2006 Orlando. Convective Weather PDT
 Convective Weather Issues Marilyn Wolfson, Convective PDT lead Roy Rasmussen, Convective PDT Alternate lead FPAW meeting, 19 Oct 2006 Orlando Examples of Aviation Storm Forecasts Main issue: Large number
Progress in Aviation Weather Forecasting for ATM Decision Making FPAW 2010
 Progress in Aviation Weather Forecasting for ATM Decision Making FPAW 2010 Jim Evans Marilyn Wolfson 21 October 2010-1 Overview (1) Integration with storm avoidance models and ATC route usage models (2)
Update on CoSPA Storm Forecasts
 Update on CoSPA Storm Forecasts Haig August 2, 2011 This work was sponsored by the Federal Aviation Administration under Air Force Contract No. FA8721-05-C-0002. Opinions, interpretations, conclusions,
1.6 A RESPONSE TO HAZARDOUS WEATHER: INTEGRATE WEATHER INFORMATION INTO TRAFFIC FLOW MANAGEMENT
 1.6 A RESPONSE TO HAZARDOUS WEATHER: INTEGRATE WEATHER INFORMATION INTO TRAFFIC FLOW MANAGEMENT Debbie Johannes*, Dave Rodenhuis FAA, ATO, System Operations Services, Herndon, VA Mark Huberdeau MITRE CAASD,
Convective-scale NWP for Singapore
 Convective-scale NWP for Singapore Hans Huang and the weather modelling and prediction section MSS, Singapore Dale Barker and the SINGV team Met Office, Exeter, UK ECMWF Symposium on Dynamical Meteorology
Annual Average NYMEX Strip Comparison 7/03/2017
 Annual Average NYMEX Strip Comparison 7/03/2017 To Year to Year Oil Price Deck ($/bbl) change Year change 7/3/2017 6/1/2017 5/1/2017 4/3/2017 3/1/2017 2/1/2017-2.7% 2017 Average -10.4% 47.52 48.84 49.58
Time Series Analysis
 Time Series Analysis A time series is a sequence of observations made: 1) over a continuous time interval, 2) of successive measurements across that interval, 3) using equal spacing between consecutive
Performance of TANC (Taiwan Auto- Nowcaster) for 2014 Warm-Season Afternoon Thunderstorm
 for 2014 Warm-Season Afternoon Thunderstorm") Performance of TANC (Taiwan Auto- Nowcaster) for 2014 Warm-Season Afternoon Thunderstorm Wei-Peng Huang, Hui-Ling Chang, Yu-Shuang Tang, Chia-Jung Wu, Chia-Rong Chen Meteorological Satellite Center, Central
Performance of TANC (Taiwan Auto- Nowcaster) for 2014 Warm-Season Afternoon Thunderstorm Wei-Peng Huang, Hui-Ling Chang, Yu-Shuang Tang, Chia-Jung Wu, Chia-Rong Chen Meteorological Satellite Center, Central
SYSTEM BRIEF DAILY SUMMARY
 SYSTEM BRIEF DAILY SUMMARY * ANNUAL MaxTemp NEL (MWH) Hr Ending Hr Ending LOAD (PEAK HOURS 7:00 AM TO 10:00 PM MON-SAT) ENERGY (MWH) INCREMENTAL COST DAY DATE Civic TOTAL MAXIMUM @Max MINIMUM @Min FACTOR
Climatography of the United States No
 Climate Division: AK 5 NWS Call Sign: ANC Month (1) Min (2) Month(1) Extremes Lowest (2) Temperature ( F) Lowest Month(1) Degree s (1) Base Temp 65 Heating Cooling 90 Number of s (3) Jan 22.2 9.3 15.8
ASSESSING THE UTILITY OF AN AUTOMATED 0-1 h THUNDERSTORM PRODUCT TO AIR TRAFFIC MANAGERS
 20.1 ASSESSING THE UTILITY OF AN AUTOMATED 0-1 h THUNDERSTORM PRODUCT TO AIR TRAFFIC MANAGERS Dennis M. Rodgers, * Gregory Pratt, Lynn Sherretz NOAA Research - Forecast Systems Laboratory, Boulder, Colorado
Terminal Domain Decision Support. Jim Evans MIT Lincoln Lab. Tom Davis
 Terminal Domain Decision Support Jim Evans MIT Lincoln Lab on behalf of Tom Davis NASA Ames Outline Review of Center-TRACON Advisory System (CTAS) Winds information to support trajectory calculations Convective
Aviation Weather A NextGen Perspective. Mark Andrews Federal Chair Weather Working Group Joint Planning and Development Office July 21 st, 2010
 Aviation Weather A NextGen Perspective Mark Andrews Federal Chair Weather Working Group Joint Planning and Development Office July 21 st, 2010 1 NextGen 101 Weather accounts for 70% of all air traffic
SYSTEM BRIEF DAILY SUMMARY
 SYSTEM BRIEF DAILY SUMMARY * ANNUAL MaxTemp NEL (MWH) Hr Ending Hr Ending LOAD (PEAK HOURS 7:00 AM TO 10:00 PM MON-SAT) ENERGY (MWH) INCREMENTAL COST DAY DATE Civic TOTAL MAXIMUM @Max MINIMUM @Min FACTOR
Weather Forecast Guidance and Impact on NAS Management August 3, 2016
 Friends and Partners of Aviation Weather Summer 2016 Meeting Weather Forecast Guidance and Impact on NAS Management August 3, 2016 Jim Enders and Kevin Johnston FAA Air Traffic Organization INTRODUCTION
Verification for Terminal and En-route Weather Forecasts and TFM Decisions
 Verification for Terminal and En-route Weather Forecasts and TFM Decisions Jennifer Mahoney NOAA/Earth System Research Laboratory Jennifer.mahoney@noaa.gov 1 November 2012 Friends and Partners of Aviation
DESCRIPTION OF URET ENHANCEMENTS TO SUPPORT SEVERE WEATHER AVOIDANCE. Winfield S. Heagy* and Daniel B. Kirk
 P12.10 DESCRIPTION OF URET ENHANCEMENTS TO SUPPORT SEVERE WEATHER AVOIDANCE Winfield S. Heagy* and Daniel B. Kirk The MITRE Corporation Center for Advanced Aviation System Development (CAASD) McLean, Virginia
Life Cycle of Convective Systems over Western Colombia
 Life Cycle of Convective Systems over Western Colombia Meiry Sakamoto Uiversidade de São Paulo, São Paulo, Brazil Colombia Life Cycle of Convective Systems over Western Colombia Convective System (CS)
Weather. Information Migration and Transition (WIMAT) Federal Aviation Administration. Presented to: Friends and Partners of Aviation.
 Federal Aviation Administration. Presented to: Friends and Partners of Aviation.") Weather Information Migration and Transition (WIMAT) Presented to: Friends and Partners of Aviation Weather By: Jack May Date: July 18, 2018 The Problem (Example: Convection) Convective SIGMET C-SIGMET
Weather Information Migration and Transition (WIMAT) Presented to: Friends and Partners of Aviation Weather By: Jack May Date: July 18, 2018 The Problem (Example: Convection) Convective SIGMET C-SIGMET
Practical Applications of Probability in Aviation Decision Making
 Practical Applications of Probability in Aviation Decision Making Haig 22 October 2014 Portfolio of TFM Decisions Playbook Reroutes Ground Stops Ground Delay Programs Airspace Flow Programs Arrival & Departure
NCWF Probabilistic Nowcasts
 NCWF Probabilistic Nowcasts Cynthia Mueller 1, D. Megenhardt, S. Trier, D. Ahijevych, and N. Rehak National Center for Atmospheric Research 1. Introduction This paper describes the National Convective
Salem Economic Outlook
 Salem Economic Outlook November 2012 Tim Duy, PHD Prepared for the Salem City Council November 7, 2012 Roadmap US Economic Update Slow and steady Positives: Housing/monetary policy Negatives: Rest of world/fiscal
Climatography of the United States No
 Climate Division: CA 4 NWS Call Sign: Month (1) Min (2) Month(1) Extremes Lowest (2) Temperature ( F) Lowest Month(1) Degree s (1) Base Temp 65 Heating Cooling 100 Number of s (3) Jan 55.6 39.3 47.5 77
Climatography of the United States No
 Climate Division: CA 1 NWS Call Sign: Month (1) Min (2) Month(1) Extremes Lowest (2) Temperature ( F) Lowest Month(1) Degree s (1) Base Temp 65 Heating Cooling 100 Number of s (3) Jan 57.9 38.9 48.4 85
Climatography of the United States No
 Climate Division: CA 5 NWS Call Sign: Month (1) Min (2) Month(1) Extremes Lowest (2) Temperature ( F) Lowest Month(1) Degree s (1) Base Temp 65 Heating Cooling 100 Number of s (3) Jan 56.6 36.5 46.6 81
Climatography of the United States No
 Climate Division: CA 5 NWS Call Sign: Month (1) Min (2) Month(1) Extremes Lowest (2) Temperature ( F) Lowest Month(1) Degree s (1) Base Temp 65 Heating Cooling 100 Number of s (3) Jan 44.8 25.4 35.1 72
Climatography of the United States No
 Climate Division: CA 4 NWS Call Sign: Month (1) Min (2) Month(1) Extremes Lowest (2) Temperature ( F) Lowest Month(1) Degree s (1) Base Temp 65 Heating Cooling 100 Number of s (3) Jan 49.4 37.5 43.5 73
Climatography of the United States No
 Climate Division: CA 6 NWS Call Sign: Month (1) Min (2) Month(1) Extremes Lowest (2) Temperature ( F) Lowest Month(1) Degree s (1) Base Temp 65 Heating Cooling 100 Number of s (3) Jan 69.4 46.6 58.0 92
Climatography of the United States No
 Climate Division: CA 4 NWS Call Sign: Month (1) Min (2) Month(1) Extremes Lowest (2) Temperature ( F) Lowest Month(1) Degree s (1) Base Temp 65 Heating Cooling 1 Number of s (3) Jan 58.5 38.8 48.7 79 1962
Climatography of the United States No
 Climate Division: CA 1 NWS Call Sign: Month (1) Min (2) Month(1) Extremes Lowest (2) Temperature ( F) Lowest Month(1) Degree s (1) Base Temp 65 Heating Cooling 1 Number of s (3) Jan 57.8 39.5 48.7 85 1962
Climatography of the United States No
 Climate Division: CA 6 NWS Call Sign: Month (1) Min (2) Month(1) Extremes Lowest (2) Temperature ( F) Lowest Month(1) Degree s (1) Base Temp 65 Heating Cooling 1 Number of s (3) Jan 67.5 42. 54.8 92 1971
YACT (Yet Another Climate Tool)? The SPI Explorer
? The SPI Explorer") YACT (Yet Another Climate Tool)? The SPI Explorer Mike Crimmins Assoc. Professor/Extension Specialist Dept. of Soil, Water, & Environmental Science The University of Arizona Yes, another climate tool for
YACT (Yet Another Climate Tool)? The SPI Explorer Mike Crimmins Assoc. Professor/Extension Specialist Dept. of Soil, Water, & Environmental Science The University of Arizona Yes, another climate tool for
7.26 THE NWS/NCAR MAN-IN-THE-LOOP (MITL) NOWCASTING DEMONSTRATION: FORECASTER INPUT INTO A THUNDERSTORM NOWCASTING SYSTEM
 NOWCASTING DEMONSTRATION: FORECASTER INPUT INTO A THUNDERSTORM NOWCASTING SYSTEM") 7.26 THE NWS/NCAR MAN-IN-THE-LOOP (MITL) NOWCASTING DEMONSTRATION: FORECASTER INPUT INTO A THUNDERSTORM NOWCASTING SYSTEM Rita Roberts 1, Steven Fano 2, William Bunting 2, Thomas Saxen 1, Eric Nelson 1,
7.26 THE NWS/NCAR MAN-IN-THE-LOOP (MITL) NOWCASTING DEMONSTRATION: FORECASTER INPUT INTO A THUNDERSTORM NOWCASTING SYSTEM Rita Roberts 1, Steven Fano 2, William Bunting 2, Thomas Saxen 1, Eric Nelson 1,
Climatography of the United States No
 Climate Division: ND 8 NWS Call Sign: BIS Month (1) Min (2) Month(1) Extremes Lowest (2) Temperature ( F) Lowest Month(1) Degree s (1) Base Temp 65 Heating Cooling 100 Number of s (3) Jan 21.1 -.6 10.2
Climatography of the United States No
 Climate Division: TN 1 NWS Call Sign: Month (1) Min (2) Month(1) Extremes Lowest (2) Temperature ( F) Lowest Month(1) Degree s (1) Base Temp 65 Heating Cooling 100 Number of s (3) Jan 47.6 24.9 36.3 81
Emerging Aviation Weather Research at MIT Lincoln Laboratory*
 Emerging Aviation Weather Research at MIT Lincoln Laboratory* Haig 19 November 2015 *This work was sponsored by the Federal Aviation Administration under Air Force Contract No. FA8721-05-C-0002. Opinions,
Climatography of the United States No
 Climate Division: CA 5 NWS Call Sign: FAT Month (1) Min (2) Month(1) Extremes Lowest (2) Temperature ( F) Lowest Month(1) Degree s (1) Base Temp 65 Heating Cooling 1 Number of s (3) Jan 53.6 38.4 46. 78
Climatography of the United States No
 Climate Division: CA 6 NWS Call Sign: 1L2 N Lon: 118 3W Month (1) Min (2) Month(1) Extremes Lowest (2) Temperature ( F) Lowest Month(1) Degree s (1) Base Temp 65 Heating Cooling 1 Number of s (3) Jan 63.7
Climatography of the United States No
 Climate Division: CA 5 NWS Call Sign: BFL Month (1) Min (2) Month(1) Extremes Lowest (2) Temperature ( F) Lowest Month(1) Degree s (1) Base Temp 65 Heating Cooling 1 Number of s (3) Jan 56.3 39.3 47.8
Forecast Confidence. Haig Iskenderian. 18 November Sponsor: Randy Bass, FAA Aviation Weather Research Program, ANG-C6
 Forecast Confidence Haig Iskenderian 18 November 2014 Sponsor: Randy Bass, FAA Aviation Weather Research Program, ANG-C6 Distribution Statement A. Approved for public release; distribution is unlimited.
Quantification of energy losses caused by blade icing and the development of an Icing Loss Climatology
 Quantification of energy losses caused by blade icing and the development of an Icing Loss Climatology Using SCADA data from Scandinavian wind farms Staffan Lindahl Winterwind 201 1 SAFER, SMARTER, GREENER
Amy Harless. Jason Levit, David Bright, Clinton Wallace, Bob Maxson. Aviation Weather Center Kansas City, MO
 Amy Harless Jason Levit, David Bright, Clinton Wallace, Bob Maxson Aviation Weather Center Kansas City, MO AWC Mission Decision Support for Traffic Flow Management Ensemble Applications at AWC Testbed
Climatography of the United States No
 Climate Division: TN 3 NWS Call Sign: BNA Month (1) Min (2) Month(1) Extremes Lowest (2) Temperature ( F) Lowest Month(1) Degree s (1) Base Temp 65 Heating Cooling 100 Number of s (3) Jan 45.6 27.9 36.8
Mars Atmosphere and Volatile Evolution Mission (MAVEN) Status of the MAVEN Mission at Mars 18 May 2018
 Status of the MAVEN Mission at Mars 18 May 2018") Mars Atmosphere and Volatile Evolution Mission (MAVEN) Status of the MAVEN Mission at Mars 18 May 2018 Bruce Jakosky Laboratory for Atmospheric and Space Physics University of Colorado at Boulder USA MAVEN
Mars Atmosphere and Volatile Evolution Mission (MAVEN) Status of the MAVEN Mission at Mars 18 May 2018 Bruce Jakosky Laboratory for Atmospheric and Space Physics University of Colorado at Boulder USA MAVEN
Climatography of the United States No
 Climate Division: CA 5 NWS Call Sign: Elevation: 6 Feet Lat: 37 Month (1) Min (2) Month(1) Extremes Lowest (2) Temperature ( F) Lowest Month(1) Degree s (1) Base Temp 65 Heating Cooling 1 Number of s (3)
Climatography of the United States No
 Climate Division: CA 4 NWS Call Sign: Elevation: 2 Feet Lat: 37 Month (1) Min (2) Month(1) Extremes Lowest (2) Temperature ( F) Lowest Month(1) Degree s (1) Base Temp 65 Heating Cooling 1 Number of s (3)
Climatography of the United States No
 Climate Division: CA 4 NWS Call Sign: Elevation: 13 Feet Lat: 36 Month (1) Min (2) Month(1) Extremes Lowest (2) Temperature ( F) Lowest Month(1) Degree s (1) Base Temp 65 Heating Cooling 1 Number of s
Climatography of the United States No
 Climate Division: CA 5 NWS Call Sign: Elevation: 1,14 Feet Lat: 36 Month (1) Min (2) Month(1) Extremes Lowest (2) Temperature ( F) Lowest Month(1) Degree s (1) Base Temp 65 Heating Cooling 1 Number of
Climatography of the United States No
 Climate Division: CA 6 NWS Call Sign: LAX Elevation: 1 Feet Lat: 33 Month (1) Min (2) Month(1) Extremes Lowest (2) Temperature ( F) Lowest Month(1) Degree s (1) Base Temp 65 Heating Cooling 1 Number of
Climatography of the United States No
 Climate Division: CA 6 NWS Call Sign: TOA Elevation: 11 Feet Lat: 33 2W Temperature ( F) Month (1) Min (2) Month(1) Extremes Lowest (2) Lowest Month(1) Degree s (1) Base Temp 65 Heating Cooling 1 Number
Strengthening the CDM triad: A view from the cockpit
 Strengthening the CDM triad: A view from the cockpit Captain Rocky Stone Chief Technical Pilot United Airlines Friends and Partners in Aviation Weather July 21, 2010 NextGen Weather Concept Current NextGen
Climatography of the United States No
 No. 2 1971-2 Asheville, North Carolina 2881 COOP ID: 46646 Climate Division: CA 4 NWS Call Sign: 8W Month (1) Min (2) Month(1) Extremes Lowest (2) Temperature ( F) Lowest Month(1) Degree s (1) Base Temp
Climatography of the United States No
 No. 2 1971-2 Asheville, North Carolina 2881 COOP ID: 4792 Climate Division: CA 6 NWS Call Sign: Month (1) Min (2) Month(1) Extremes Lowest (2) Temperature ( F) Lowest Month(1) Degree s (1) Base Temp 65
Climatography of the United States No
 No. 2 1971-2 Asheville, North Carolina 2881 COOP ID: 43417 Climate Division: CA 4 NWS Call Sign: N Lon: 121 Month (1) Min (2) Month(1) Extremes Lowest (2) Temperature ( F) Lowest Month(1) Degree s (1)
0-6 hour Weather Forecast Guidance at The Weather Company. Steven Honey, Joseph Koval, Cathryn Meyer, Peter Neilley The Weather Company
 1 0-6 hour Weather Forecast Guidance at The Weather Company Steven Honey, Joseph Koval, Cathryn Meyer, Peter Neilley The Weather Company TWC Forecasts: Widespread Adoption 2 0-6 Hour Forecast Details 3
Climatography of the United States No
 No. 2 1971-2 Asheville, North Carolina 2881 COOP ID: 4795 Climate Division: CA 6 NWS Call Sign: SBA Month (1) Min (2) Month(1) Extremes Lowest (2) Temperature ( F) Lowest Month(1) Degree s (1) Base Temp
Supplementary appendix
 Supplementary appendix This appendix formed part of the original submission and has been peer reviewed. We post it as supplied by the authors. Supplement to: Lowe R, Stewart-Ibarra AM, Petrova D, et al.
In Centre, Online Classroom Live and Online Classroom Programme Prices
 In Centre, and Online Classroom Programme Prices In Centre Online Classroom Foundation Certificate Bookkeeping Transactions 430 325 300 Bookkeeping Controls 320 245 225 Elements of Costing 320 245 225
An Overview of Atmospheric Analyses and Reanalyses for Climate
 An Overview of Atmospheric Analyses and Reanalyses for Climate Kevin E. Trenberth NCAR Boulder CO Analysis Data Assimilation merges observations & model predictions to provide a superior state estimate.
Terminal Ceiling & Visibility PDT
 Terminal Ceiling & Visibility PDT AWRP Program Management Review 19 November 2002 Dave Clark PMR_Nov_02-1 Terminal C&V Project Areas SFO Marine Stratus Forecast System - 2002 Activities - Continued development
TILT, DAYLIGHT AND SEASONS WORKSHEET
 TILT, DAYLIGHT AND SEASONS WORKSHEET Activity Description: Students will use a data table to make a graph for the length of day and average high temperature in Utah. They will then answer questions based
Climatography of the United States No
 No. 2 1971-2 Asheville, North Carolina 2881 COOP ID: 46175 Climate Division: CA 6 NWS Call Sign: 3L3 Elevation: 1 Feet Lat: 33 Month (1) Min (2) Month(1) Extremes Lowest (2) Temperature ( F) Lowest Month(1)
Climatography of the United States No
 No. 2 1971-2 Asheville, North Carolina 2881 COOP ID: 42713 Climate Division: CA 7 NWS Call Sign: Elevation: -3 Feet Lat: 32 Month (1) Min (2) Month(1) Extremes Lowest (2) Temperature ( F) Lowest Month(1)
Weather Technology in the Cockpit (WTIC) Shortfall Analysis of Weather Information in Remote Airspace Friends and Partners of Aviation Weather Summer
 Shortfall Analysis of Weather Information in Remote Airspace Friends and Partners of Aviation Weather Summer") Weather Technology in the Cockpit (WTIC) Shortfall Analysis of Weather Information in Remote Airspace Friends and Partners of Aviation Weather Summer Meeting Tim Myers Metron Aviation August 26, 2015 2
Weather Technology in the Cockpit (WTIC) Shortfall Analysis of Weather Information in Remote Airspace Friends and Partners of Aviation Weather Summer Meeting Tim Myers Metron Aviation August 26, 2015 2
Evaluation of Collaborative Rationing of En Route Resources. Josh Marron, Antonio Abad Bill Hall, Francis Carr, Steve Kolitz 25 Sept 2003
 Evaluation of Collaborative Rationing of En Route Resources Josh Marron, Antonio Abad Bill Hall, Francis Carr, Steve Kolitz 25 Sept 2003 Outline The need for collaborative en route rationing Proposed routing
Isolating and Assessing Weather-related Air Traffic Delays. A closer-look at what makes this so difficult... Mike Robinson AvMet Applications, Inc.
 Isolating and Assessing Weather-related Air Traffic Delays A closer-look at what makes this so difficult... Mike Robinson AvMet Applications, Inc. Is this me? 1 What is a Weather Delay? (It depends on
Climatography of the United States No
 Month (1) Min (2) Month(1) Extremes Lowest (2) Temperature ( F) Lowest Month(1) Degree s (1) Base Temp 65 Heating Cooling 100 Number of s (3) Jan 63.9 39.3 51.6 86 1976 16 56.6 1986 20 1976 2 47.5 1973
Climatography of the United States No
 Temperature ( F) Month (1) Min (2) Month(1) Extremes Lowest (2) Lowest Month(1) Degree s (1) Base Temp 65 Heating Cooling 100 Number of s (3) Jan 32.8 21.7 27.3 62 1918 1 35.8 1983-24 1950 29 10.5 1979
Mark Miller NOAA NextGen Weather Program Manager July 21, 2010
 Mark Miller NOAA NextGen Weather Program Manager July 21, 2010 1 Progress toward an initial operating capability and beyond! Current Status FY10 Capability Evaluation Aligning with NWS Future Service Plans
Increasing Transmission Capacities with Dynamic Monitoring Systems
 INL/MIS-11-22167 Increasing Transmission Capacities with Dynamic Monitoring Systems Kurt S. Myers Jake P. Gentle www.inl.gov March 22, 2012 Concurrent Cooling Background Project supported with funding
UNCLASSIFIED. Environment, Safety and Health (ESH) Report
 Report") Environment, Safety and Health (ESH) Report Perfect Days On a Perfect Day nobody is hurt, we receive no community complaints, we have no security breaches, we do not breach our environmental permit conditions,
Environment, Safety and Health (ESH) Report Perfect Days On a Perfect Day nobody is hurt, we receive no community complaints, we have no security breaches, we do not breach our environmental permit conditions,
Climatography of the United States No
 Climate Division: CA 6 NWS Call Sign: Month (1) Min (2) Month(1) Extremes Lowest (2) Temperature ( F) Lowest Month(1) Degree s (1) Base Temp 65 Heating Cooling 100 Number of s (3) Jan 51.5 35.0 43.3 80
Climatography of the United States No
 Climate Division: CA 5 NWS Call Sign: Month (1) Min (2) Month(1) Extremes Lowest (2) Temperature ( F) Lowest Month(1) Degree s (1) Base Temp 65 Heating Cooling 100 Number of s (3) 59.3 31.5 45.4 80 1976
Climatography of the United States No
 Climate Division: CA 7 NWS Call Sign: Month (1) Min (2) Month(1) Extremes Lowest (2) Temperature ( F) Lowest Month(1) Degree s (1) Base Temp 65 Heating Cooling 100 Number of s (3) 44.5 29.3 36.9 69 1951
Climatography of the United States No
 Climate Division: CA 2 NWS Call Sign: Month (1) Min (2) Month(1) Extremes Lowest (2) Temperature ( F) Lowest Month(1) Degree s (1) Base Temp 65 Heating Cooling 100 Number of s (3) 53.3 37.1 45.2 77 1962
Climatography of the United States No
 Climate Division: CA 2 NWS Call Sign: Month (1) Min (2) Month(1) Extremes Lowest (2) Temperature ( F) Lowest Month(1) Degree s (1) Base Temp 65 Heating Cooling 100 Number of s (3) 53.3 31.8 42.6 74+ 1975
Climatography of the United States No
 Climate Division: CA 6 NWS Call Sign: Month (1) Min (2) Month(1) Extremes Lowest (2) Temperature ( F) Lowest Month(1) Degree s (1) Base Temp 65 Heating Cooling 100 Number of s (3) 68.5 45.7 57.1 90 1971
Climatography of the United States No
 Climate Division: CA 2 NWS Call Sign: Month (1) Min (2) Month(1) Extremes Lowest (2) Temperature ( F) Lowest Month(1) Degree s (1) Base Temp 65 Heating Cooling 100 Number of s (3) 53.7 32.7 43.2 79 1962
Climatography of the United States No
 Climate Division: CA 7 NWS Call Sign: Month (1) Min (2) Month(1) Extremes Lowest (2) Temperature ( F) Lowest Month(1) Degree s (1) Base Temp 65 Heating Cooling 100 Number of s (3) 56.0 35.7 45.9 83 1975
Climatography of the United States No
 Climate Division: CA 7 NWS Call Sign: Month (1) Min (2) Month(1) Extremes Lowest (2) Temperature ( F) Lowest Month(1) Degree s (1) Base Temp 65 Heating Cooling 1 Number of s (3) 64.8 45.4 55.1 85 1971
Climatography of the United States No
 Climate Division: CA 7 NWS Call Sign: Month (1) Min (2) Month(1) Extremes Lowest (2) Temperature ( F) Lowest Month(1) Degree s (1) Base Temp 65 Heating Cooling 1 Number of s (3) 65.5 38.7 52.1 87 1962
Implementing Relevant Performance Measures for Traffic Flow Management
 Implementing Relevant Performance Measures for Traffic Flow Management Friends/Partners of Aviation Weather Forum October 11, 2011 Las Vegas, Nevada Cyndie Abelman NOAA/NWS Aviation Services Baseline of
Climatography of the United States No
 Climate Division: CA 7 NWS Call Sign: Month (1) Min (2) Month(1) Extremes Lowest (2) Temperature ( F) Lowest Month(1) Degree s (1) Base Temp 65 Heating Cooling 100 Number of s (3) 58.8 34.3 46.6 81+ 1948
Winter Season Resource Adequacy Analysis Status Report
 Winter Season Resource Adequacy Analysis Status Report Tom Falin Director Resource Adequacy Planning Markets & Reliability Committee October 26, 2017 Winter Risk Winter Season Resource Adequacy and Capacity
Climatography of the United States No
 Climate Division: CA 7 NWS Call Sign: Month (1) Min (2) Month(1) Extremes Lowest (2) Temperature ( F) Lowest Month(1) Degree s (1) Base Temp 65 Heating Cooling 100 Number of s (3) 70.4 44.2 57.3 95 1971
Climatography of the United States No
 Climate Division: CA 1 NWS Call Sign: Month (1) Min (2) Month(1) Extremes Lowest (2) Temperature ( F) Lowest Month(1) Degree s (1) Base Temp 65 Heating Cooling 100 Number of s (3) Jan 52.4 35.4 43.9 69
Climatography of the United States No
 Climate Division: CA 4 NWS Call Sign: Month (1) Min (2) Month(1) Extremes Lowest (2) Temperature ( F) Lowest Month(1) Degree s (1) Base Temp 65 Heating Cooling 100 Number of s (3) Jan 61.9 42.0 52.0 89