Monthly Magnetic Bulletin
|
|
|
- Imogen Wilkinson
- 5 years ago
- Views:
Transcription


1 BRITISH GEOLOGICAL SURVEY Ascension Island Observatory Monthly Magnetic Bulletin March /03/AS Crown copyright; Ordnance Survey
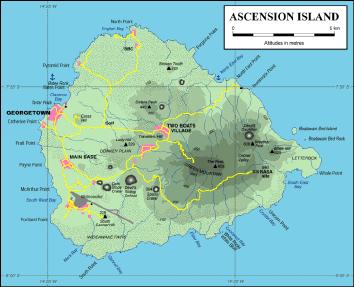
2 ASCENSION ISLAND OBSERVATORY MAGNETIC DATA 1. Introduction Ascension Island observatory was installed by the British Geological Survey (BGS) with financial support from a consortium of oil companies and became operational in September This bulletin is published to provide rapid access to the provisional geomagnetic observatory results. The information is freely available for personal, academic, educational and non-commercial research or use. Magnetic observatory data are presented as a series of plots of one-minute, hourly and daily values, followed by tabulations of monthly values. The operation of the observatory and presentation of data are described in the rest of this section. Enquiries about the data should be addressed to: 2. Position Geomagnetism Team Earth Hazards and Systems British Geological Survey Murchison House, West Mains Road Edinburgh EH9 3LA Scotland, UK Tel: +44 (0) Fax: +44 (0) enquiries@bgs.ac.uk Internet: Ascension Island Observatory, one of the geomagnetic observatories maintained and operated by BGS, is situated on a site adjacent to the Cable and Wireless Earth Station on Donkey Plain. The observatory co-ordinates are: Geographic: 7 S 345 E Geomagnetic: 2 S 057 E Height above mean sea level: 177 m The geographical coordinates are measured by a handheld GPS device, which uses WGS84 as the reference coordinate system. The height above MSL is determined from the best available contour maps. The geomagnetic co-ordinates are approximations, calculated using the 12th generation International Geomagnetic Reference Field (IGRF) at epoch On-line access to models (including IGRF), charts and navigational data are available at _compass/home 3. The Observatory Operation 3.1 GDAS The observatory operates under the control of the Geomagnetic Data Acquisition System (GDAS), which was developed by BGS staff, installed and became operational in August The data acquisition software, running on QNX operated computers, controls the data logging and the communications. There are two sets of sensors used for making magnetic measurements. A tri-axial linear-core fluxgate magnetometer, manufactured by the Danish Meteorological Institute, is used to measure the variations in the horizontal (H) and vertical (Z) components of the field. The third sensor is oriented perpendicular to these, and measures variations, which are proportional to the changes in declination (D). Measurements are made at a rate of 1 Hz. In addition to the fluxgate sensors there is a proton precession magnetometer (PPM) making measurements of the absolute total field intensity (F) at a rate of 0.1Hz. The raw unfiltered data are retrieved automatically via Internet connections to the BGS office in Edinburgh in near real-time. The fluxgate data are filtered to produce one-minute values using a 61- point cosine filter and the total field intensity samples are filtered using a 7-point cosine filter. The one-minute values provide input for various data products, available on-line at Absolute Observations The GDAS fluxgate magnetometers accurately measure variations in the components of the geomagnetic field, but not the absolute magnitudes. Two sets of absolute measurements of the field are made manually once per month. A fluxgate sensor mounted on a theodolite is used to determine D and inclination (I); the GDAS PPM measurements, with a site difference correction applied, are used for F. The absolute observations are used in conjunction with the GDAS variometer measurements to produce a continuous record of the absolute values of the geomagnetic field elements as if they had been measured at the observatory reference pillar.
3 4. Observatory Results The data presented in the bulletin are in the form of plots and tabulations described in the following sections. 4.1 Absolute Observations The absolute observation measurements made during the month are tabulated. Also included are the corresponding baseline values, which are the differences between the absolute measurements and the variometer measurements of D, H and Z (in the sense absolute variometer). These are also plotted (markers) along with the derived preliminary daily baseline values (line) throughout the year. Daily mean differences between the measured absolute F and the F computed from the baseline corrected H and Z values are plotted in the fourth panel (in the sense measured derived). The bottom panel shows the daily mean temperature in the fluxgate chamber. 4.2 Summary magnetograms Small-scale magnetograms are plotted which allow the month's data to be viewed at a glance. They are plotted 16 days to a page and show the one-minute variations in D, H and Z. The scales are shown on the right-hand side of the page. On disturbed days the scales are multiplied by a factor, which is indicated above the panel for that day. The variations are centred on the monthly mean value, shown on the left side of the page. 4.3 Magnetograms The daily magnetograms are plotted using oneminute values of D, H and Z from the fluxgate sensors, with any gaps filled using back-up data. The magnetograms are plotted to a variable scale; scale bars are shown to the right of each plot. The absolute level (the monthly mean value) is indicated on the left side of the plots. quiet intervals. Plotting the data in this way highlights this recurrence. Diurnal variations are also clear in these plots and the amplitude changes throughout the year highlight the seasonal changes. Longer term secular variation is also illustrated. 4.5 Daily and Monthly Mean Values Daily mean values of D, H, Z and F are plotted throughout the year. In addition, a table of monthly mean values of all the geomagnetic elements is provided. These values depend on accurate specification of the fluxgate sensor baselines. It is anticipated that these provisional values will not be altered by more than a few nt or tenths of arcminutes before being made definitive at the end of the year. 5. Conditions of Use The data presented in this bulletin are provided for personal, academic, educational, non-commercial research or other non-commercial use and are not for sale or distribution to third parties without written permission from BGS. Reproduction of any part of this bulletin should be accompanied by the statement: 'Reproduced with the permission of the British Geological Survey NERC. All rights Reserved'. Publications making use of the data should include an acknowledgment statement of the form: The results presented in this paper rely on the data collected at Ascension Island magnetic observatory, operated by the British Geological Survey. Commercial users can contact the geomagnetism team for information on the range of applications and services offered. Full contact details are available at Hourly Mean Value Plots Hourly mean values of D, H and Z for the past 12 months are plotted in 27-day segments corresponding to the Bartels solar rotation number. Magnetic disturbances associated with active regions and/or coronal holes on the Sun may recur after 27 days: the same is true for geomagnetically NERC All rights reserved Edinburgh British Geological Survey 2017
4 ASCENSION ISLAND OBSERVATORY ABSOLUTE OBSERVATIONS Date Day Number Time (UT) Declination Inclination Total Field Horizontal Intensity Vertical Intensity Absolute (º) Baseline (º) Time (UT) Absolute (º) Site difference (nt) Absolute corrected (nt) 12-Mar : : GA 12-Mar : : GA Absolute (nt) Baseline (nt) Absolute (nt) Baseline (nt) Observer
5 2017 Declination : Absolute - Variometer (markers) and Baseline Applied (line) min Horizontal Intensity : Absolute - Variometer (markers) and Baseline Applied (line) nT Vertical Intensity : Absolute - Variometer (markers) and Baseline Applied (line) nT Total Intensity : Absolute (Proton F) - Baseline Adjusted Variometer (derived F) nT Temperature Inside Variometer Hut C Jan Feb Mar Apr May Jun Jul Aug Sep Oct Nov Dec
6 March Scale x D 0.30 o H Z D H 150 nt Z D H Z 75 nt D H Z
7 D 0.30 o H Z D H 150 nt Z Scale x 2 28 D H Z 75 nt D UT H Z Ascension Island March 2017
8 Date: Day number: nT 20nT Date: Day number: nT 20nT
9 Date: Day number: nT 20nT Date: Day number: nT
10 Date: Day number: nT Date: Day number: nT
11 Date: Day number: nT Date: Day number: nT
12 Date: Day number: nT Date: Day number: nT
13 Date: Day number: nT Date: Day number: nT 20nT
14 Date: Day number: nT Date: Day number: nT
15 Date: Day number: nT Date: Day number: nT
16 Date: Day number: nT Date: Day number: nT 20nT
17 Date: Day number: nT Date: Day number: nT
18 Date: Day number: nT Date: Day number: nT
19 Date: Day number: nT Date: Day number: nT
20 Date: Day number: nT Date: Day number: nT
21 Date: Day number: nT Date: Day number: nT
22 Date: Day number: nT Date: Day number: nT
23 Date: Day number: nT
24 Observatory: Declination (degrees) Rotn Apr16 May 2493 Jun 2494 Jul 2495 Aug 2496 Sep 2497 Oct 2498 Nov Dec 2501 Jan Feb 2503 Mar Hourly Mean Values Plotted By Bartels Solar Rotation Number
25 Observatory: Horizontal Intensity (nt) Rotn Apr16 May 2493 Jun 2494 Jul 2495 Aug 2496 Sep 2497 Oct 2498 Nov Dec 2501 Jan Feb 2503 Mar Hourly Mean Values Plotted By Bartels Solar Rotation Number
26 Observatory: Vertical Intensity (nt) Rotn Apr16 May 2493 Jun 2494 Jul 2495 Aug 2496 Sep 2497 Oct 2498 Nov Dec 2501 Jan Feb 2503 Mar Hourly Mean Values Plotted By Bartels Solar Rotation Number
27 Ascension Is Observatory 2017 Daily Mean Declination (deg) min Daily Mean Horizontal Intensity (nt) nT Daily Mean Vertical Intensity (nt) nT Daily Mean Total Intensity (nt) nT Jan Feb Mar Apr May Jun Jul Aug Sep Oct Nov Dec
28 Monthly Mean Values for Ascension Island Observatory 2017 Month D H I X Y Z F January nt nt nt nt nt February nt nt nt nt nt March nt nt nt nt nt Note i. The values shown here are provisional.
KING EDWARD POINT OBSERVATORY MAGNETIC DATA
 BRITISH GEOLOGICAL SURVEY King Edward d Point Observatory Monthly Magnetic Bulletin September 2018 18/09/KE King Edward Point (UK) Maps British Antarctic Survey KING EDWARD POINT OBSERVATORY MAGNETIC DATA
KING EDWARD POINT OBSERVATORY MAGNETIC DATA
 BRITISH GEOLOGICAL SURVEY King Edward d Point Observatory Monthly Magnetic Bulletin October 2018 18/10/KE King Edward Point (UK) Maps British Antarctic Survey KING EDWARD POINT OBSERVATORY MAGNETIC DATA
KING EDWARD POINT OBSERVATORY MAGNETIC DATA
 BRITISH GEOLOGICAL SURVEY King Edward d Point Observatory Monthly Magnetic Bulletin May 2018 18/05/KE King Edward Point (UK) Maps British Antarctic Survey KING EDWARD POINT OBSERVATORY MAGNETIC DATA 1.
Monthly Magnetic Bulletin
 BRITISH GEOLOGICAL SURVEY Jim Carrigan Observatory Prudhoe Bay Monthly Magnetic Bulletin May 2014 14/05/JC JIM CARRIGAN OBSERVATORY MAGNETIC DATA 1. Introduction Jim Carrigan observatory is the fourth
Monthly Magnetic Bulletin
 BRITISH GEOLOGICAL SURVEY Port Stanley Observatory Monthly Magnetic Bulletin July 2011 11/07/PS Jason Islands West Falkland King George Bay Queen Charlotte Bay Weddell Island Caracass Island Saunders Island
Monthly Magnetic Bulletin
 BRITISH GEOLOGICAL SURVEY Ascension Island Observatory Monthly Magnetic Bulletin December 2008 08/12/AS Crown copyright; Ordnance Survey ASCENSION ISLAND OBSERVATORY MAGNETIC DATA 1. Introduction Ascension
Monthly Magnetic Bulletin
 BRITISH GEOLOGICAL SURVEY Fort McMurray Observatory Monthly Magnetic Bulletin March 2017 17/03/FM Fort McMurray FORT McMURRAY OBSERVATORY MAGNETIC DATA 1. Introduction The British Geological Survey (BGS)
Monthly Magnetic Bulletin
 BRITISH GEOLOGICAL SURVEY Fort McMurray Observatory Monthly Magnetic Bulletin February 2016 16/02/FM Fort McMurray FORT McMURRAY OBSERVATORY MAGNETIC DATA 1. Introduction The British Geological Survey
Monthly Magnetic Bulletin
 BRITISH GEOLOGICAL SURVEY Port Stanley Observatory Monthly Magnetic Bulletin July 2010 10/07/PS Jason Islands a ar C West Falkland Kin gg eor ge B Port Salavador ay Weddell Island Mount Osborne So un d
Monthly Magnetic Bulletin
 BRITISH GEOLOGICAL SURVEY Port Stanley Observatory Monthly Magnetic Bulletin July 2009 09/07/PS Jason Islands a ar C West Falkland Kin gg eor ge B Port Salavador ay Weddell Island Mount Osborne So un d
Monthly Magnetic Bulletin
 BRITISH GEOLOGICAL SURVEY Port Stanley Observatory Monthly Magnetic Bulletin May 2009 09/05/PS Jason Islands a ar C West Falkland Kin gg eor ge B Port Salavador ay Weddell Island Mount Osborne So un d
Monthly Magnetic Bulletin
 BRITISH GEOLOGICAL SURVEY Port Stanley Observatory Monthly Magnetic Bulletin April 2009 09/04/PS Jason Islands a ar C West Falkland Kin gg eor ge B Port Salavador ay Weddell Island Mount Osborne So un
Monthly Magnetic Bulletin
 BRITISH GEOLOGICAL SURVEY Port Stanley Observatory Monthly Magnetic Bulletin December 2007 07/12/PS Jason Islands a ar C West Falkland Kin gg eor ge B Port Salavador ay Weddell Island Mount Osborne So
BRITISH GEOLOGICAL SURVEY Hartland Observatory Monthly Magnetic Bulletin March /03/HA
 BRITISH GEOLOGICAL SURVEY Hartland Observatory Monthly Magnetic Bulletin March 2010 10 /03/HA HARTLAND OBSERVATORY MAGNETIC DATA 1. Introduction Hartland observatory is one of three geomagnetic observatories
BRITISH GEOLOGICAL SURVEY Hartland Observatory Monthly Magnetic Bulletin June /06/HA
 BRITISH GEOLOGICAL SURVEY Hartland Observatory Monthly Magnetic Bulletin June 2016 16/06/HA HARTLAND OBSERVATORY MAGNETIC DATA 1. Introduction Hartland observatory is one of three geomagnetic observatories
Monthly Magnetic Bulletin March 2010
 BRITISH GEOLOGICAL SURVEY Eskdalemuir Observatory Monthly Magnetic Bulletin March 2010 10/03/ES Crown copyright; Ordnance Survey ESKDALEMUIR OBSERVATORY MAGNETIC DATA 1. Introduction Eskdalemuir observatory
BRITISH GEOLOGICAL SURVEY Lerwick Observatory Monthly Magnetic Bulletin September /09/LE
 BRITISH GEOLOGICAL SURVEY Lerwick Observatory Monthly Magnetic Bulletin September 2010 10/09/LE LERWICK OBSERVATORY MAGNETIC DATA 1. Introduction Lerwick observatory is one of three geomagnetic observatories
Monthly Geomagnetic Bulletin
 HARTLAND OBSERVATORY Monthly Geomagnetic Bulletin BRISTOL CHANNEL December 2002 02/12/HA Hartland NERC 2002 1. HARTLAND OBSERVATORY MAGNETIC DATA 1.1 Introduction This bulletin is published to meet the
Hermanus Magnetic Observatory
 Hermanus Magnetic Observatory A facility of the National Research Foundation Magnetic Results 2009 Hermanus, Hartebeesthoek and Keetmanshoop observatories 1. INTRODUCTION The Hermanus Magnetic Observatory
Monthly Magnetic Bulletin August 2011
 BRITISH GEOLOGICAL SURVEY Eskdalemuir Observatory Monthly Magnetic Bulletin August 2011 11/08/ES Crown copyright; Ordnance Survey ESKDALEMUIR OBSERVATORY MAGNETIC DATA 1. Introduction Eskdalemuir o bservatory
RECOMMENDATIONS FOR EUROPEAN MAGNETIC REPEAT STATION SURVEYS
 RECOMMENDATIONS FOR EUROPEAN MAGNETIC REPEAT STATION SURVEYS Andrzej Sas Uhrynowski, Monika Korte, Jean Jacques Schott and Gerhard Schwarz, Coordination Committee for common European repeat station surveys.
BRITISH GEOLOGICAL SURVEY Lerwick Observatory Monthly Magnetic Bulletin August /08/LE
 BRITISH GEOLOGICAL SURVEY Lerwick Observatory Monthly Magnetic Bulletin August 2011 11/08/LE LERWICK OBSERVATORY MAGNETIC DATA 1. Introduction Lerwick observatory i s o ne o f t hree g eomagnetic observatories
Gan Magnetic Observatory Annual Report
 Gan Magnetic Observatory Maldive Islands South Indian Ocean 2013 Annual Report Aerial view of the island of Gan, the observatory is located below the runway approximately at its midpoint 1 List of Contents
GAMINGRE 8/1/ of 7
 FYE 09/30/92 JULY 92 0.00 254,550.00 0.00 0 0 0 0 0 0 0 0 0 254,550.00 0.00 0.00 0.00 0.00 254,550.00 AUG 10,616,710.31 5,299.95 845,656.83 84,565.68 61,084.86 23,480.82 339,734.73 135,893.89 67,946.95
Establishment of Abdus Salam Geomagnetic Observatory Sonmiani, Pakistan: Site Selection to INTERMAGNET Certification
 Pakistan Space & Upper Atmosphere Research Commission Establishment of Abdus Salam Geomagnetic Observatory Sonmiani, Pakistan: Site Selection to INTERMAGNET Certification G. Murtaza Space Science Department
Annual Report of New Zealand Magnetic Observatories, 2007
 Annual Report of New Zealand Magnetic Observatories, 2007 INTRODUCTION There were no significant changes to the equipment used in the magnetic observatories in 2007. The new fluxgate at Scott Base continued
Location. Datum. Survey. information. Etrometa. Step Gauge. Description. relative to Herne Bay is -2.72m. The site new level.
 Tide Gauge Location OS: 616895E 169377N WGS84: Latitude: 51 o 22.919196 N Longitude: 01 o 6.9335907 E Instrument Type Etrometa Step Gauge Benchmarks Benchmark TGBM = 5.524m above Ordnance Datum Newlyn
SOUTH AFRICAN TIDE TABLES
 SAN HO-2 2018 SOUTH AFRICAN TIDE TABLES PUBLISHED BY THE HYDROGRAPHER SOUTH AFRICAN NAVY PRIVATE BAG X1 TOKAI, 7966 COPYRIGHT RESERVED ISBN 978-0-9869717-9-2 CONTENTS Preface.... (iii) Tidal Levels......(iv)
Mountain View Community Shuttle Monthly Operations Report
 Mountain View Community Shuttle Monthly Operations Report December 6, 2018 Contents Passengers per Day, Table...- 3 - Passengers per Day, Chart...- 3 - Ridership Year-To-Date...- 4 - Average Daily Ridership
Scarborough Tide Gauge
 Tide Gauge Location OS: 504898E 488622N WGS84: Latitude: 54 16' 56.990"N Longitude: 00 23' 25.0279"W Instrument Valeport 740 (Druck Pressure Transducer) Benchmarks Benchmark Description TGBM = 4.18m above
SOUTH AFRICAN TIDE TABLES
 SAN HO-2 2019 SOUTH AFRICAN TIDE TABLES PUBLISHED BY THE HYDROGRAPHER SOUTH AFRICAN NAVY PRIVATE BAG X1 TOKAI, 7966 COPYRIGHT RESERVED ISBN 978-0-9947002-0-9 Intentionally left blank CONTENTS Preface....
Monthly Magnetic Bulletin
 BRITISH GEOLOGICAL SURVEY Eskdalemuir Observatory Monthly Magnetic Bulletin 20 10/1 /ES Crown copyright; Ordnance Survey ESKDALEMUIR OBSERVATORY MAGNETIC DATA 1. Introduction Eskdalemuir obs ervatory i
Computing & Telecommunications Services Monthly Report January CaTS Help Desk. Wright State University (937)
") January 215 Monthly Report Computing & Telecommunications Services Monthly Report January 215 CaTS Help Desk (937) 775-4827 1-888-775-4827 25 Library Annex helpdesk@wright.edu www.wright.edu/cats/ Last
January 215 Monthly Report Computing & Telecommunications Services Monthly Report January 215 CaTS Help Desk (937) 775-4827 1-888-775-4827 25 Library Annex helpdesk@wright.edu www.wright.edu/cats/ Last
ENGINE SERIAL NUMBERS
 ENGINE SERIAL NUMBERS The engine number was also the serial number of the car. Engines were numbered when they were completed, and for the most part went into a chassis within a day or so. However, some
Magnetic field nomenclature
 Magnetic field nomenclature Declination trend angle between horizontal projection of F and true North Inclination plunge angle between horizontal and F Magnetic equator location on surface where field
Monthly Magnetic Bulletin November 2009
 BRITISH GEOLOGICAL SURVEY Eskdalemuir Observatory Monthly Magnetic Bulletin November 2009 09 /11/ES Crown copyright; Ordnance Survey ESKDALEMUIR OBSERVATORY MAGNETIC DATA 1. Introduction This bulletin
Changing Hydrology under a Changing Climate for a Coastal Plain Watershed
 Changing Hydrology under a Changing Climate for a Coastal Plain Watershed David Bosch USDA-ARS, Tifton, GA Jeff Arnold ARS Temple, TX and Peter Allen Baylor University, TX SEWRU Objectives 1. Project changes
Wind Resource Data Summary Cotal Area, Guam Data Summary and Transmittal for December 2011
 Wind Resource Data Summary Cotal Area, Guam Data Summary and Transmittal for December 2011 Prepared for: GHD Inc. 194 Hernan Cortez Avenue 2nd Floor, Ste. 203 Hagatna, Guam 96910 January 2012 DNV Renewables
NATIONAL ANTARCTIC RESEARCH PROGRAM. Terra Nova Bay, Antarctica Geomagnetic Observatory
 NATIONAL ANTARCTIC RESEARCH PROGRAM Terra Nova Bay, Antarctica Geomagnetic Observatory Magnetic Observation Results 2007-2008 L. Cafarella, S. Lepidi, A. Meloni, P. Palangio, M. Pietrolungo and L. Santarelli
Jackson County 2013 Weather Data
 Jackson County 2013 Weather Data 61 Years of Weather Data Recorded at the UF/IFAS Marianna North Florida Research and Education Center Doug Mayo Jackson County Extension Director 1952-2008 Rainfall Data
Exercise 6. Solar Panel Orientation EXERCISE OBJECTIVE DISCUSSION OUTLINE. Introduction to the importance of solar panel orientation DISCUSSION
 Exercise 6 Solar Panel Orientation EXERCISE OBJECTIVE When you have completed this exercise, you will understand how the solar illumination at any location on Earth varies over the course of a year. You
Computing & Telecommunications Services
 Computing & Telecommunications Services Monthly Report September 214 CaTS Help Desk (937) 775-4827 1-888-775-4827 25 Library Annex helpdesk@wright.edu www.wright.edu/cats/ Table of Contents HEAT Ticket
Technical note on seasonal adjustment for M0
 Technical note on seasonal adjustment for M0 July 1, 2013 Contents 1 M0 2 2 Steps in the seasonal adjustment procedure 3 2.1 Pre-adjustment analysis............................... 3 2.2 Seasonal adjustment.................................
WHEN IS IT EVER GOING TO RAIN? Table of Average Annual Rainfall and Rainfall For Selected Arizona Cities
 WHEN IS IT EVER GOING TO RAIN? Table of Average Annual Rainfall and 2001-2002 Rainfall For Selected Arizona Cities Phoenix Tucson Flagstaff Avg. 2001-2002 Avg. 2001-2002 Avg. 2001-2002 October 0.7 0.0
2003 Water Year Wrap-Up and Look Ahead
 2003 Water Year Wrap-Up and Look Ahead Nolan Doesken Colorado Climate Center Prepared by Odie Bliss http://ccc.atmos.colostate.edu Colorado Average Annual Precipitation Map South Platte Average Precipitation
Gan Magnetic Observatory. Maldive Islands South Indian Ocean Annual Report
 Gan Magnetic Observatory Maldive Islands South Indian Ocean 2016 Annual Report 1 Institut für Geophysik, Zürich Gan Magnetic Observatory Maldive Islands South Indian Ocean 2016 Annual Report Report Editor
Center Data Analysis Service supported by the FAGS
 Solar Influences Data analysis Center Data Analysis Service supported by the FAGS SUNSPOT BULLETIN 2 n Provisional international and normalized hemispheric daily sunspot numbers for September 2 computed
WYANDOTTE MUNICIPAL SERVICES COMMUNITY WIND ENERGY PROJECT WIND RESOUCE SUMMARY
 WYANDOTTE MUNICIPAL SERVICES COMMUNITY WIND ENERGY PROJECT WIND RESOUCE SUMMARY MONTHLY REPORT October 15, 2007 Black & Veatch Project: 144374 Prepared by: Black & Veatch Corporation 6300 S. Syracuse Way
Time Series Analysis
 Time Series Analysis A time series is a sequence of observations made: 1) over a continuous time interval, 2) of successive measurements across that interval, 3) using equal spacing between consecutive
WIND DATA REPORT FOR THE YAKUTAT JULY 2004 APRIL 2005
 WIND DATA REPORT FOR THE YAKUTAT JULY 2004 APRIL 2005 Prepared on July 12, 2005 For Bob Lynette 212 Jamestown Beach Lane Sequim WA 98382 By John Wade Wind Consultant LLC 2575 NE 32 nd Ave Portland OR 97212
REPORT ON LABOUR FORECASTING FOR CONSTRUCTION
 REPORT ON LABOUR FORECASTING FOR CONSTRUCTION For: Project: XYZ Local Authority New Sample Project Contact us: Construction Skills & Whole Life Consultants Limited Dundee University Incubator James Lindsay
Results of Geomagnetic Observations Belsk, Hel, Hornsund, 2008
 PUBLS. INST. GEOPHYS. POL. ACAD. SC., C-102 (409), 2009 Results of Geomagnetic Observations Belsk, Hel, Hornsund, 2008 Jan REDA, Mariusz NESKA and Stanisław WÓJCIK Institute of Geophysics, Polish Academy
NATIONAL ANTARCTIC RESEARCH PROGRAM. Terra Nova Bay, Antarctica Geomagnetic Observatory
 NATIONAL ANTARCTIC RESEARCH PROGRAM Terra Nova Bay, Antarctica Geomagnetic Observatory Magnetic Observation Results 2009-2010 L. Cafarella, S. Lepidi, A. Meloni, P. Palangio, M. Pietrolungo L. Santarelli
PGI GEOPHYSICAL DATA
 1 2 PGI GEOPYSICAL ATA V. VOROBJEV, editor V. Brusentsova and N. Golubtsova, make-up editors This bulletin presents the preliminary ground-based optical, geomagnetic and cosmic ray data obtained by Polar
PRELIMINARY DRAFT FOR DISCUSSION PURPOSES
 Memorandum To: David Thompson From: John Haapala CC: Dan McDonald Bob Montgomery Date: February 24, 2003 File #: 1003551 Re: Lake Wenatchee Historic Water Levels, Operation Model, and Flood Operation This
Calculations Equation of Time. EQUATION OF TIME = apparent solar time - mean solar time
 Calculations Equation of Time APPARENT SOLAR TIME is the time that is shown on sundials. A MEAN SOLAR DAY is a constant 24 hours every day of the year. Apparent solar days are measured from noon one day
Sunspot Index and Long-term Solar Observations World Data Center supported by the ICSU - WDS
 Sunspot Index and Long-term Solar Observations World Data Center supported by the ICSU - WDS 2016 n 7 WARNING OF MAJOR DATA CHANGE Over the past 4 years a community effort has been carried out to revise
2.1 Inductive Reasoning Ojectives: I CAN use patterns to make conjectures. I CAN disprove geometric conjectures using counterexamples.
 2.1 Inductive Reasoning Ojectives: I CAN use patterns to make conjectures. I CAN disprove geometric conjectures using counterexamples. 1 Inductive Reasoning Most learning occurs through inductive reasoning,
Jackson County 2018 Weather Data 67 Years of Weather Data Recorded at the UF/IFAS Marianna North Florida Research and Education Center
 Jackson County 2018 Weather Data 67 Years of Weather Data Recorded at the UF/IFAS Marianna North Florida Research and Education Center Doug Mayo Jackson County Extension Director 1952-2008 Rainfall Data
STATISTICAL FORECASTING and SEASONALITY (M. E. Ippolito; )
") STATISTICAL FORECASTING and SEASONALITY (M. E. Ippolito; 10-6-13) PART I OVERVIEW The following discussion expands upon exponential smoothing and seasonality as presented in Chapter 11, Forecasting, in
STATISTICAL FORECASTING and SEASONALITY (M. E. Ippolito; 10-6-13) PART I OVERVIEW The following discussion expands upon exponential smoothing and seasonality as presented in Chapter 11, Forecasting, in
Bryan Butler. National Radio Astronomy Observatory. November 23, 1998
 MMA Memo. No. 238 Precipitable Water at KP 1993{1998 Bryan Butler National Radio Astronomy Observatory November 23, 1998 Introduction This memo is essentially a clone of MMA Memo No. 237 (also VLA Scientic
Determine the trend for time series data
 Extra Online Questions Determine the trend for time series data Covers AS 90641 (Statistics and Modelling 3.1) Scholarship Statistics and Modelling Chapter 1 Essent ial exam notes Time series 1. The value
WIND DATA REPORT. Vinalhaven
 WIND DATA REPORT Vinalhaven July 1, 2004 September 30, 2004 Prepared for Fox Islands Electric Cooperative By Melissa L. Ray Anthony L. Rogers April 4, 2005 Renewable Energy Research Laboratory 160 Governors
Meteorological Data recorded at Armagh Observatory from 1795 to 2001: Volume I - Daily, Monthly and Annual Rainfall
 Meteorological Data recorded at Armagh Observatory from 1795 to 2001: Volume I - Daily, Monthly and Annual Rainfall 1838-2001 A. M. García-Suárez, C.J. Butler, D. Cardwell, A.D.S. Coughlin, A. Donnelly,
Arun Platform Tide Gauge
 Arun Platform Tide Gauge Location OS: 506423E 97778N WGS84: Latitude: 50 46 11.39042"N Longitude: 00 29 31.73595"W Instrument Valeport 730 (Druck Pressure Transducer) TGBM Benchmarks Benchmark Description
_ falian GEOMAGNETISM REPORT
 blications compactus w u t; n :0 o c r ir. iifc _ falian GEOMAGNETISM REPORT MAGNETIC OBSERVATORIES VOLUME 40 No.6 JUNE 1992 BUREAU OF MINERAL RESOURCES, GEOLOGY & GEOPHYSICS DEPARTMENT OF PRIMARY INDUSTRIES
Chiang Rai Province CC Threat overview AAS1109 Mekong ARCC
 Chiang Rai Province CC Threat overview AAS1109 Mekong ARCC This threat overview relies on projections of future climate change in the Mekong Basin for the period 2045-2069 compared to a baseline of 1980-2005.
SYSTEM BRIEF DAILY SUMMARY
 SYSTEM BRIEF DAILY SUMMARY * ANNUAL MaxTemp NEL (MWH) Hr Ending Hr Ending LOAD (PEAK HOURS 7:00 AM TO 10:00 PM MON-SAT) ENERGY (MWH) INCREMENTAL COST DAY DATE Civic TOTAL MAXIMUM @Max MINIMUM @Min FACTOR
UWM Field Station meteorological data
 University of Wisconsin Milwaukee UWM Digital Commons Field Station Bulletins UWM Field Station Spring 992 UWM Field Station meteorological data James W. Popp University of Wisconsin - Milwaukee Follow
DANISH METEOROLOGICAL INSTITUTE
 DANISH METEOROLOGICAL INSTITUTE TECHNICAL REPORT 03-01 Magnetic Results 2001 Brorfelde, Qeqertarsuaq, Qaanaaq and Narsarsuaq Observatories COPENHAGEN 2003 DMI Technical Report 03-01 Compiled by Børge Pedersen
PROGRESS ACCOMPLISHED THIS PERIOD
 Semi-Annual Report Period Covered: September 1, 21 through February 28, 217 Prepared By: Richard Radigan Title: Monitoring of a Constructed Oyster Reef in the St. Lucie Estuary Agency: Florida Fish & Wildlife
WIND DATA REPORT. Vinalhaven
 WIND DATA REPORT Vinalhaven April 1, 2004 June 30, 2004 Prepared for Fox Islands Electric Cooperative By Melissa L. Ray Anthony L. Rogers April 4, 2005 Renewable Energy Research Laboratory 160 Governors
Orbit Design Marcelo Suárez. 6th Science Meeting; Seattle, WA, USA July 2010
 Orbit Design Marcelo Suárez Orbit Design Requirements The following Science Requirements provided drivers for Orbit Design: Global Coverage: the entire extent (100%) of the ice-free ocean surface to at
Project No India Basin Shadow Study San Francisco, California, USA
 Project No. 432301 India Basin Shadow Study San Francisco, California, USA Numerical Modelling Studies 04 th June 2018 For Build Inc. Report Title: India Basin Shadow Study San Francisco, California, USA
Estimation of Diffuse Solar Radiation for Yola, Adamawa State, North- Eastern, Nigeria
 International Research Journal of Engineering and Technology (IRJET) e-issn: - Volume: Issue: Nov- www.irjet.net p-issn: - Estimation of Diffuse Solar Radiation for Yola, Adamawa State, North- Eastern,
L. Cafarella, S. Lepidi, A. Meloni, P. Palangio, M. Pietrolungo, L. Santarelli and A. Zirizzotti
 1$7,21$/$17$5&7,&5(6($5&+352*5$0 7HUUD1RYD%D\$QWDUFWLFD *HRPDJQHWLF2EVHUYDWRU\ 0DJQHWLF2EVHUYDWLRQ5HVXOWV L. Cafarella, S. Lepidi, A. Meloni, P. Palangio, M. Pietrolungo, L. Santarelli and A. Zirizzotti
Sunspot Index and Long-term Solar Observations World Data Center supported by the ICSU - WDS
 Sunspot Index and Long-term Solar Observations World Data Center supported by the ICSU - WDS 2016 n 6 WARNING OF MAJOR DATA CHANGE Over the past 4 years a community effort has been carried out to revise
2019 Settlement Calendar for ASX Cash Market Products. ASX Settlement
 2019 Settlement Calendar for ASX Cash Market Products ASX Settlement Settlement Calendar for ASX Cash Market Products 1 ASX Settlement Pty Limited (ASX Settlement) operates a trade date plus two Business
Average 175, , , , , , ,046 YTD Total 1,098,649 1,509,593 1,868,795 1,418, ,169 1,977,225 2,065,321
 AGRICULTURE 01-Agriculture JUL 2,944-4,465 1,783-146 102 AUG 2,753 6,497 5,321 1,233 1,678 744 1,469 SEP - 4,274 4,183 1,596 - - 238 OCT 2,694 - - 1,032 340-276 NOV 1,979-5,822 637 3,221 1,923 1,532 DEC
Average 175, , , , , , ,940 YTD Total 944,460 1,284,944 1,635,177 1,183, ,954 1,744,134 1,565,640
 AGRICULTURE 01-Agriculture JUL 2,944-4,465 1,783-146 102 AUG 2,753 6,497 5,321 1,233 1,678 744 1,469 SEP - 4,274 4,183 1,596 - - 238 OCT 2,694 - - 1,032 340-276 NOV 1,979-5,822 637 3,221 1,923 1,532 DEC
13 SHADOW FLICKER Introduction Methodology
 Table of contents 13 SHADOW FLICKER... 13-1 13.1 Introduction... 13-1 13.2 Methodology... 13-1 13.2.1 Factors Influencing Shadow Flicker Occurrence... 13-2 13.2.2 Shadow Flicker Analysis Methodology...
FEB DASHBOARD FEB JAN FEB MAR APR MAY JUN JUL AUG SEP OCT NOV DEC
 Positive Response Compliance 215 Compliant 215 Non-Compliant 216 Compliant 216 Non-Compliant 1% 87% 96% 86% 96% 88% 89% 89% 88% 86% 92% 93% 94% 96% 94% 8% 6% 4% 2% 13% 4% 14% 4% 12% 11% 11% 12% JAN MAR
How to find Sun's GHA using TABLE How to find Sun's Declination using TABLE 4...4
 1 of 8 How to use- TABLE 4. - GHA and Declination of the Sun for the Years 2001 to 2036- Argument Orbit Time How to find Sun's GHA using TABLE 4... 2 How to find Sun's Declination using TABLE 4...4 Before
Sluggish Economy Puts Pinch on Manufacturing Technology Orders
 Updated Release: June 13, 2016 Contact: Penny Brown, AMT, 703-827-5275 pbrown@amtonline.org Sluggish Economy Puts Pinch on Manufacturing Technology Orders Manufacturing technology orders for were down
Long-term Water Quality Monitoring in Estero Bay
 Long-term Water Quality Monitoring in Estero Bay Keith Kibbey Laboratory Director Lee County Environmental Laboratory Division of Natural Resource Management Estero Bay Monitoring Programs Three significant
GEOPHYSICAL OBSERVATORY REPORT
 (LENDING SECTION) GEOPHYSICAL OBSERVATORY REPORT V M «> 'j. 3 O. - MAGNETIC OBSERVATORIES VOLUME 34 Na 12 DECEMBER 1986 ;, ' L J OF MINERAL RESOURCES, GEOLOGY & GEOPHYSICS DEPARTMENT OF RESOURCES RND ENERGY
Site Description: Tower Site
 Resource Summary for Fort Collins Site Final Report Colorado Anemometer Loan Program Monitoring Period: /0/00 11/03/007 Report Date: January 1, 00 Site Description: The site is located adjacent to the
Outline. The Path of the Sun. Emissivity and Absorptivity. Average Radiation Properties II. Average Radiation Properties
 The Path of the Sun Larry Caretto Mechanical Engineering 83 Alternative Energy Engineering II March, 2 Outline Review radiation properties for solar collectors Orientation of earth and sun Earth-based
Temperature Tests on Modern Magnetometers
 PUBLS. INST. GEOPHYS. POL. ACAD. SC., C-99 (398), 2007 Temperature Tests on Modern Magnetometers András CSONTOS, László HEGYMEGI and Balázs HEILIG Eötvös Loránd Geophysical Institute Budapest, Kolombusz
Multivariate Regression Model Results
 Updated: August, 0 Page of Multivariate Regression Model Results 4 5 6 7 8 This exhibit provides the results of the load model forecast discussed in Schedule. Included is the forecast of short term system
Stability analysis of geomagnetic baseline data obtained at Cheongyang observatory in Korea
 https://doi.org/10.5194/gi-6-231-2017 Author(s) 2017. This work is distributed under the Creative Commons Attribution 3.0 License. Stability analysis of geomagnetic baseline data obtained at Cheongyang
Variability and trends in daily minimum and maximum temperatures and in diurnal temperature range in Lithuania, Latvia and Estonia
 Variability and trends in daily minimum and maximum temperatures and in diurnal temperature range in Lithuania, Latvia and Estonia Jaak Jaagus Dept. of Geography, University of Tartu Agrita Briede Dept.
Geomagnetic Calibration of Sunspot Numbers
 Geomagnetic Calibration of Sunspot Numbers Leif Svalgaard Stanford University 2 nd SSN Workshop, Brussels, May 212 1 Wolf s Several Lists of SSNs During his life Wolf published several lists of his Relative
Geomagnetic Calibration of Sunspot Numbers. Leif Svalgaard HEPL, Stanford University SSN-Workshop, Sunspot, NM, Sept. 2011
 Geomagnetic Calibration of Sunspot Numbers Leif Svalgaard HEPL, Stanford University SSN-Workshop, Sunspot, NM, Sept. 2011 1 Wolf s Several Lists of SSNs During his life Wolf published several lists of
Site Description: Tower Site
 Resource Summary for Elizabeth Site Final Report Colorado Anemometer Loan Program Monitoring Period: 7/3/06 /26/07 Report Date: January, 0 Site Description: The site is.6 miles northeast of the town of
Interannual variation of MODIS NDVI in Lake Taihu and its relation to climate in submerged macrophyte region
 Yale-NUIST Center on Atmospheric Environment Interannual variation of MODIS NDVI in Lake Taihu and its relation to climate in submerged macrophyte region ZhangZhen 2015.07.10 1 Outline Introduction Data
Published by ASX Settlement Pty Limited A.B.N Settlement Calendar for ASX Cash Market Products
 Published by Pty Limited A.B.N. 49 008 504 532 2012 Calendar for Cash Market Products Calendar for Cash Market Products¹ Pty Limited ( ) operates a trade date plus three Business (T+3) settlement discipline
OPTIMIZATION OF GLOBAL SOLAR RADIATION OF TILT ANGLE FOR SOLAR PANELS, LOCATION: OUARGLA, ALGERIA
 OPTIMIZATION OF GLOBAL SOLAR RADIATION OF TILT ANGLE FOR SOLAR PANELS, LOCATION: OUARGLA, ALGERIA Mohamed Lakhdar LOUAZENE Dris KORICHI Department of Electrical Engineering, University of Ouargla, Algeria.
Mars Atmosphere and Volatile Evolution Mission (MAVEN) Status of the MAVEN Mission at Mars 18 May 2018
 Status of the MAVEN Mission at Mars 18 May 2018") Mars Atmosphere and Volatile Evolution Mission (MAVEN) Status of the MAVEN Mission at Mars 18 May 2018 Bruce Jakosky Laboratory for Atmospheric and Space Physics University of Colorado at Boulder USA MAVEN
Mars Atmosphere and Volatile Evolution Mission (MAVEN) Status of the MAVEN Mission at Mars 18 May 2018 Bruce Jakosky Laboratory for Atmospheric and Space Physics University of Colorado at Boulder USA MAVEN