Spatio-temporal Statistical Modelling for Environmental Epidemiology
|
|
|
- Lee Glenn
- 5 years ago
- Views:
Transcription
1 Spatio-temporal Statistical Modelling for Environmental Epidemiology Peter Diggle Department of Medicine, Lancaster University and Department of Biostatistics, Johns Hopkins University WHO Geneva, September 2007
2 Introduction environmental determinants of health vary: continuously; in space; and in time assigning a spatially and/or temporally averaged exposure to an individual at risk is at best a pragmatic approximation models of the association between exposure and health outcome should acknowledge the statistical uncertainty in exposure estimates model-based geostatistical methods can be used to estimate a spatially and temporally continuous exposure surface from spatially and/or temporally sparse data with accompanying estimates of precision
3 1. APOC Two case-studies goal: predict Loa loa prevalence from spatially sparse community-level surveys environmental covariates: elevation, green-ness (from satellite images) policy-relevant question: does prevalence exceed 20%? 2. PAMPER goal: estimate a spatio-temporal exposure surface of black smoke concentrations for UK city of Newcastle upon Tyne over a thirty-year period goal: relate exposure estimates to pregnancy outcomes spatially sparse network of monitors, operating intermittently over study-period
4 Geostatistics Data (x i, Y i ) : i = 1,..., n x i = location of ith measurement Y i = measured value at location x i plus relevant covariate information, context,... Model S(x) = spatial process of interest (exposure surface) Y i = noisy version of S(x i ) Spatio-temporal extension: Y i = S(x i, t i )+ noise
5 African Programme for Onchocerciasis Control river blindness an endemic disease in wet tropical regions donation programme of mass treatment with ivermectin approximately 30 million treatments to date serious adverse reactions experienced by some patients highly co-infected with Loa loa parasites precautionary measures put in place before mass treatment in areas of high Loa loa prevalence
6 Schematic representation of Loa loa model prevalence local fluctuation sampling error environmental gradient location
7 Modelling strategy use relationship between environmental variables and ground-truth prevalence to construct preliminary predictions via logistic regression use local deviations from regression model to estimate smooth residual spatial variation Bayesian paradigm for quantification of uncertainty in resulting model-based predictions
8 logit prevalence vs elevation logit prevalence elevation
9 logit prevalence vs max NDVI logit prevalence Max Greeness
10 Comparing non-spatial and spatial predictions in Cameroon Non-spatial
11 Spatial

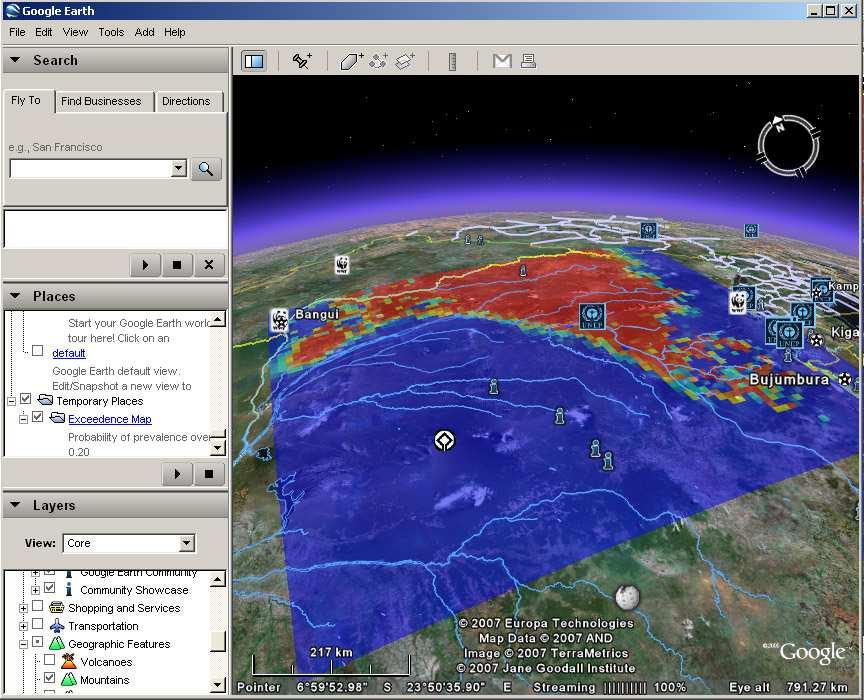
12 Probabilistic prediction in Cameroon
13 RAPLOA have you ever had eye-worm? did it look like this photograph? did it go away within a week?
14 eplacemen RAPLOA calibration parasitology prevalence parasitology logit RAPLOA prevalence RAPLOA logit Calibration relationship enables improved prediction of parasitological prevalence in areas of high uncertainty
15 PAMPER Goal: Construct predictions of black smoke levels, S(x, t), over thirty-year period Available data: monitored black smoke levels from spatially discrete monitoring network

16 monitors are only active intermittently
17 Modelling strategy Two-stage approach: 1. model temporal variation in spatially averaged black smoke levels 2. model residual spatio-temporal variation about temporal average
18 Model for temporal variation in spatially averaged black smoke Y t = spatially averaged black smoke at time t Model needs to take account of: long-term (decreasing) trend seasonal variation Classical regression model for Y t is log P t = α + βt + r {A k cos(kωt) + B k sin(kωt)} + Z t k=1 Case r = 1 gives pure sinusoid, r = 2, 3,... allows non-sinusoidal seasonal patterns
19 Fitted values, model Week Lag Log average black smoke level Autocorrelation
20 Model for temporal variation in spatially averaged black smoke (continued) Classical model fails because seasonal pattern is stochastic. Dynamic model: log P t = α + βt + {A t cos(ωt) + B t sin(ωt)} + Z t A t B t = A t 1 + ǫ t = B t 1 + δ t Allows locations and magnitudes of seasonal peaks and troughs to vary between years
21 Week Model (2) Lag Autocorrelation Log average black smoke level
22 Model for spatio-temporal variation in residuals Y t (x) = log ˆP t + S(x, t) + Z t (x) S(x, t) = spatio-temporally correlated (?) random field Z t (x) = mutually independent measurement errors
23 Constructed covariates where does the spatio-temporal correlation come from? look for possible surrogate measures which: are available at all locations and times correlate well with measured black smoke concentrations at monitored locations
24 Monitored black smoke vs domestic chimney density Important interactions with: non-residential/residential land-use (solid/open circles) clean-air act (staggered implementation) Average residual from dynamic model Average chimney count within 500 metres
25 Discussion points 1. Reliance on area-level data to analyse individual-level risk-factors is tricky 2. APOC (a) target for prediction linked directly to policy-relevant question (b) spatially dense surrogate outcomes (RAPLOA) used in combination with spatially sparse primary outcomes (parasitology) to improve spatial prediction
26 3. PAMPER (a) temporal takes precedence over spatial (b) construction of spatially continuous explanatory variables assists prediction of spatio-temporally continuous exposure surface (c) and may eliminate residual spatio-temporal correlation
27 4. Epidemiological relevance of point exposure in space-time: (a) ambient vs indoor? (b) integration over space and/or time? (c) integration over tracked movements of individuals at risk? 5. Making proper allowance for imprecision in exposure estimates is important 6. Integrated analysis of exposure and health outcome data: (a) possible in principle (APOC Loa loa study) (b) but computationally challenging for large data-sets 7. Real-time spatial prediction feasible using spatio-temporal models in conjunction with Monte Carlo algorithms
28
29 References Diggle, P.J., Thomson, M.C., Christensen, O.F., Rowlingson, B., Obsomer, V., Gardon, J., Wanji, S., Takougang, I., Enyong, P., Kamgno, J., Remme, H., Boussinesq, M. and Molyneux, D.H. (2007). Spatial modelling and prediction of Loa loa risk: decision making under uncertainty. Annals of Tropical Medicine and Parasitology, 101, Fanshawe, T.R., Diggle, P.J., Rushton, S., Sanderson, R., Lurz, P.W.W., Glinianaia, S.V., Pearce, M.S., Parker, L., Charlton, M. and Pless- Mulloli, T. (2007). Modelling spatio-temporal variation in exposure to particulate matter: a two-stage approach. Environmetrics (in press)
A Tale of Two Parasites
 A Tale of Two Parasites Geostatistical Modelling for Tropical Disease Mapping Peter J Diggle Lancaster University and University of Liverpool CHICAS combining health information, computation and statistics
Spatio-temporal modeling of weekly malaria incidence in children under 5 for early epidemic detection in Mozambique
 Spatio-temporal modeling of weekly malaria incidence in children under 5 for early epidemic detection in Mozambique Katie Colborn, PhD Department of Biostatistics and Informatics University of Colorado
Statistical and epidemiological considerations in using remote sensing data for exposure estimation
 Statistical and epidemiological considerations in using remote sensing data for exposure estimation Chris Paciorek Department of Biostatistics Harvard School of Public Health Collaborators: Yang Liu, Doug
Statistical Analysis of Spatio-temporal Point Process Data. Peter J Diggle
 Statistical Analysis of Spatio-temporal Point Process Data Peter J Diggle Department of Medicine, Lancaster University and Department of Biostatistics, Johns Hopkins University School of Public Health
Predicting Long-term Exposures for Health Effect Studies
 Predicting Long-term Exposures for Health Effect Studies Lianne Sheppard Adam A. Szpiro, Johan Lindström, Paul D. Sampson and the MESA Air team University of Washington CMAS Special Session, October 13,
Measurement Error in Spatial Modeling of Environmental Exposures
 Measurement Error in Spatial Modeling of Environmental Exposures Chris Paciorek, Alexandros Gryparis, and Brent Coull August 9, 2005 Department of Biostatistics Harvard School of Public Health www.biostat.harvard.edu/~paciorek
The Use of Spatial Exposure Predictions in Health Effects Models: An Application to PM Epidemiology
 The Use of Spatial Exposure Predictions in Health Effects Models: An Application to PM Epidemiology Chris Paciorek and Brent Coull Department of Biostatistics Harvard School of Public Health wwwbiostatharvardedu/
Pumps, Maps and Pea Soup: Spatio-temporal methods in environmental epidemiology
 Pumps, Maps and Pea Soup: Spatio-temporal methods in environmental epidemiology Gavin Shaddick Department of Mathematical Sciences University of Bath 2012-13 van Eeden lecture Thanks Constance van Eeden
Combining Incompatible Spatial Data
 Combining Incompatible Spatial Data Carol A. Gotway Crawford Office of Workforce and Career Development Centers for Disease Control and Prevention Invited for Quantitative Methods in Defense and National
Comparison of data-fitting models for schistosomiasis: a case study in Xingzi, China
 Geospatial Health 8(1), 2013, pp. 125132 Comparison of datafitting models for schistosomiasis: a case study in Xingzi, China Yi Hu 1,2,3,*, ChengLong Xiong 1,2,*, ZhiJie Zhang 1,2,3,4, Robert Bergquist
Dismantling the Mantel tests
 Methods in Ecology and Evolution 2012 doi: 10.1111/2041-210x.12018 FORUM Dismantling the Mantel tests Gilles Guillot 1 *andfrancßois Rousset 2 1 Informatics and Mathematical Modelling Department, Technical
Introduction to Regression Analysis. Dr. Devlina Chatterjee 11 th August, 2017
 Introduction to Regression Analysis Dr. Devlina Chatterjee 11 th August, 2017 What is regression analysis? Regression analysis is a statistical technique for studying linear relationships. One dependent
Faculty of Health Sciences. Regression models. Counts, Poisson regression, Lene Theil Skovgaard. Dept. of Biostatistics
 Faculty of Health Sciences Regression models Counts, Poisson regression, 27-5-2013 Lene Theil Skovgaard Dept. of Biostatistics 1 / 36 Count outcome PKA & LTS, Sect. 7.2 Poisson regression The Binomial
Physician Performance Assessment / Spatial Inference of Pollutant Concentrations
 Physician Performance Assessment / Spatial Inference of Pollutant Concentrations Dawn Woodard Operations Research & Information Engineering Cornell University Johns Hopkins Dept. of Biostatistics, April
Spatial bias modeling with application to assessing remotely-sensed aerosol as a proxy for particulate matter
 Spatial bias modeling with application to assessing remotely-sensed aerosol as a proxy for particulate matter Chris Paciorek Department of Biostatistics Harvard School of Public Health application joint
Bayesian Geostatistical Design
 Johns Hopkins University, Dept. of Biostatistics Working Papers 6-5-24 Bayesian Geostatistical Design Peter J. Diggle Medical Statistics Unit, Lancaster University, UK & Department of Biostatistics, Johns
Brent Coull, Petros Koutrakis, Joel Schwartz, Itai Kloog, Antonella Zanobetti, Joseph Antonelli, Ander Wilson, Jeremiah Zhu.
 Harvard ACE Project 2: Air Pollutant Mixtures in Eastern Massachusetts: Spatial Multi-resolution Analysis of Trends, Effects of Modifiable Factors, Climate, and Particle-induced Mortality Brent Coull,
PrevMap: An R Package for Prevalence Mapping
 PrevMap: An R Package for Prevalence Mapping Emanuele Giorgi Lancaster University Peter J. Diggle Lancaster University Abstract In this paper we introduce a new R package, PrevMap, for the analysis of
Journal of Statistical Software
 JSS Journal of Statistical Software MMMMMM YYYY, Volume VV, Issue II. http://www.jstatsoft.org/ PrevMap: An R Package for Prevalence Mapping Emanuele Giorgi Lancaster University Peter J. Diggle Lancaster
Disease mapping with Gaussian processes
 EUROHEIS2 Kuopio, Finland 17-18 August 2010 Aki Vehtari (former Helsinki University of Technology) Department of Biomedical Engineering and Computational Science (BECS) Acknowledgments Researchers - Jarno
Modelling spatio-temporal patterns of disease
 Modelling spatio-temporal patterns of disease Peter J Diggle CHICAS combining health information, computation and statistics References AEGISS Brix, A. and Diggle, P.J. (2001). Spatio-temporal prediction
What is (certain) Spatio-Temporal Data?
 Spatio-Temporal Data?") What is (certain) Spatio-Temporal Data? A spatio-temporal database stores triples (oid, time, loc) In the best case, this allows to look up the location of an object at any time 2 What is (certain) Spatio-Temporal
What is (certain) Spatio-Temporal Data? A spatio-temporal database stores triples (oid, time, loc) In the best case, this allows to look up the location of an object at any time 2 What is (certain) Spatio-Temporal
Clinical Trials. Olli Saarela. September 18, Dalla Lana School of Public Health University of Toronto.
 Introduction to Dalla Lana School of Public Health University of Toronto olli.saarela@utoronto.ca September 18, 2014 38-1 : a review 38-2 Evidence Ideal: to advance the knowledge-base of clinical medicine,
Linkage Methods for Environment and Health Analysis General Guidelines
 Health and Environment Analysis for Decision-making Linkage Analysis and Monitoring Project WORLD HEALTH ORGANIZATION PUBLICATIONS Linkage Methods for Environment and Health Analysis General Guidelines
Estimating the long-term health impact of air pollution using spatial ecological studies. Duncan Lee
 Estimating the long-term health impact of air pollution using spatial ecological studies Duncan Lee EPSRC and RSS workshop 12th September 2014 Acknowledgements This is joint work with Alastair Rushworth
Cluster Analysis using SaTScan
 Cluster Analysis using SaTScan Summary 1. Statistical methods for spatial epidemiology 2. Cluster Detection What is a cluster? Few issues 3. Spatial and spatio-temporal Scan Statistic Methods Probability
Environmental factors associated with the distribution of Loa loa vectors Chrysops spp. in Central and West Africa: seeing the forest for the trees
 Badia-Rius et al. Parasites & Vectors (2019) 12:72 https://doi.org/10.1186/s13071-019-3327-9 RESEARCH Open Access Environmental factors associated with the distribution of Loa loa vectors Chrysops spp.
WHO lunchtime seminar Mapping child growth failure in Africa between 2000 and Professor Simon I. Hay March 12, 2018
 WHO lunchtime seminar Mapping child growth failure in Africa between 2000 and 2015 Professor Simon I. Hay March 12, 2018 Outline Local Burden of Disease (LBD) at IHME Child growth failure From global to
Rejoinder. Peihua Qiu Department of Biostatistics, University of Florida 2004 Mowry Road, Gainesville, FL 32610
 Rejoinder Peihua Qiu Department of Biostatistics, University of Florida 2004 Mowry Road, Gainesville, FL 32610 I was invited to give a plenary speech at the 2017 Stu Hunter Research Conference in March
at least 50 and preferably 100 observations should be available to build a proper model
 III Box-Jenkins Methods 1. Pros and Cons of ARIMA Forecasting a) need for data at least 50 and preferably 100 observations should be available to build a proper model used most frequently for hourly or
Statistics in medicine
 Statistics in medicine Lecture 3: Bivariate association : Categorical variables Proportion in one group One group is measured one time: z test Use the z distribution as an approximation to the binomial
Modelling trends in the ocean wave climate for dimensioning of ships
 Modelling trends in the ocean wave climate for dimensioning of ships STK1100 lecture, University of Oslo Erik Vanem Motivation and background 2 Ocean waves and maritime safety Ships and other marine structures
Space-time downscaling under error in computer model output
 Space-time downscaling under error in computer model output University of Michigan Department of Biostatistics joint work with Alan E. Gelfand, David M. Holland, Peter Guttorp and Peter Craigmile Introduction
Bayesian Hierarchical Models
 Bayesian Hierarchical Models Gavin Shaddick, Millie Green, Matthew Thomas University of Bath 6 th - 9 th December 2016 1/ 34 APPLICATIONS OF BAYESIAN HIERARCHICAL MODELS 2/ 34 OUTLINE Spatial epidemiology
Extended Follow-Up and Spatial Analysis of the American Cancer Society Study Linking Particulate Air Pollution and Mortality
 Extended Follow-Up and Spatial Analysis of the American Cancer Society Study Linking Particulate Air Pollution and Mortality Daniel Krewski, Michael Jerrett, Richard T Burnett, Renjun Ma, Edward Hughes,
Community Health Needs Assessment through Spatial Regression Modeling
 Community Health Needs Assessment through Spatial Regression Modeling Glen D. Johnson, PhD CUNY School of Public Health glen.johnson@lehman.cuny.edu Objectives: Assess community needs with respect to particular
Site-specific Prediction of Mosquito Abundance using Spatio-Temporal Geostatistics
 Site-specific Prediction of Mosquito Abundance using Spatio-Temporal Geostatistics E.-H. Yoo 1, D. Chen 2 and C. Russell 3 1 Department of Geography, University at Buffalo, SUNY, Buffalo, NY, USA eunhye@buffalo.edu,
EPIDEMIOLOGY FOR URBAN MALARIA MAPPING
 TELE-EPIDEMIOLOGY EPIDEMIOLOGY FOR URBAN MALARIA MAPPING @IRD/M Dukhan Vanessa Machault Observatoire Midi-Pyrénées, Laboratoire d Aérologie Pleiades days 17/01/2012 The concept of Tele-epidemiology The
TELE-EPIDEMIOLOGY URBAN MALARIA MAPPING
 TELE-EPIDEMIOLOGY URBAN MALARIA MAPPING Ministère de la Défense Vanessa Machault Advances in Geospatial Technologies for Health 12-13/09/2011 Objective To develop a robust pre-operational methodology to
Map Methodology Loa loa Estimated prevalence of Eye Worm:
 Loa loa Estimated of Eye Worm: Surveys informing this layer were conducted using the RAPLOA methodology 1. ArcGIS 10.0 was used for spatial analysis of the data. The of history of eye worm for each village
Spatio-temporal precipitation modeling based on time-varying regressions
 Spatio-temporal precipitation modeling based on time-varying regressions Oleg Makhnin Department of Mathematics New Mexico Tech Socorro, NM 87801 January 19, 2007 1 Abstract: A time-varying regression
Flexible modelling of the cumulative effects of time-varying exposures
 Flexible modelling of the cumulative effects of time-varying exposures Applications in environmental, cancer and pharmaco-epidemiology Antonio Gasparrini Department of Medical Statistics London School
Analysis of Longitudinal Data. Patrick J. Heagerty PhD Department of Biostatistics University of Washington
 Analysis of Longitudinal Data Patrick J Heagerty PhD Department of Biostatistics University of Washington Auckland 8 Session One Outline Examples of longitudinal data Scientific motivation Opportunities
Advanced analysis and modelling tools for spatial environmental data. Case study: indoor radon data in Switzerland
 EnviroInfo 2004 (Geneva) Sh@ring EnviroInfo 2004 Advanced analysis and modelling tools for spatial environmental data. Case study: indoor radon data in Switzerland Mikhail Kanevski 1, Michel Maignan 1
Model-based Geostatistics
 This is page i Printer: Opaque this Model-based Geostatistics Peter J. Diggle and Paulo J. Ribeiro Jr. November 7, 2006 This is page ii Printer: Opaque this Peter J. Diggle Department of Mathematics and
A Geostatistical Approach to Linking Geographically-Aggregated Data From Different Sources
 A Geostatistical Approach to Linking Geographically-Aggregated Data From Different Sources Carol A. Gotway Crawford National Center for Environmental Health Centers for Disease Control and Prevention,
Measurement error effects on bias and variance in two-stage regression, with application to air pollution epidemiology
 Measurement error effects on bias and variance in two-stage regression, with application to air pollution epidemiology Chris Paciorek Department of Statistics, University of California, Berkeley and Adam
GIS Application in Landslide Hazard Analysis An Example from the Shihmen Reservoir Catchment Area in Northern Taiwan
 GIS Application in Landslide Hazard Analysis An Example from the Shihmen Reservoir Catchment Area in Northern Taiwan Chyi-Tyi Lee Institute of Applied Geology, National Central University, No.300, Jungda
ICU Monitoring: An Engineering Perspective
 ICU Monitoring: An Engineering Perspective Kenneth A. Loparo Department of Electrical Engineering and Computer Science Case Western Reserve University September 14, 2008 Industrial Automation: A Paradigm
UKPMC Funders Group Author Manuscript Adv Parasitol. Author manuscript; available in PMC 2011 February 12.
 UKPMC Funders Group Author Manuscript Published in final edited form as: Adv Parasitol. 2011 ; 74: 267 296. doi:10.1016/b978-0-12-385897-9.00005-7. The Applications of Model-Based Geostatistics in Helminth
Bayesian SAE using Complex Survey Data Lecture 4A: Hierarchical Spatial Bayes Modeling
 Bayesian SAE using Complex Survey Data Lecture 4A: Hierarchical Spatial Bayes Modeling Jon Wakefield Departments of Statistics and Biostatistics University of Washington 1 / 37 Lecture Content Motivation
Probabilistic Graphical Models
 Probabilistic Graphical Models Brown University CSCI 2950-P, Spring 2013 Prof. Erik Sudderth Lecture 13: Learning in Gaussian Graphical Models, Non-Gaussian Inference, Monte Carlo Methods Some figures
Probabilistic assessment of danger zones using a surrogate model of CFD simulations
 HARMO 17 17 th International Conference on Harmonisation within Atmospheric Dispersion Modelling for Regulatory Purposes Probabilistic assessment of danger zones using a surrogate model of CFD simulations
Multivariate Count Time Series Modeling of Surveillance Data
 Multivariate Count Time Series Modeling of Surveillance Data Leonhard Held 1 Michael Höhle 2 1 Epidemiology, Biostatistics and Prevention Institute, University of Zurich, Switzerland 2 Department of Mathematics,
Gaussian Process Approximations of Stochastic Differential Equations
 Gaussian Process Approximations of Stochastic Differential Equations Cédric Archambeau Centre for Computational Statistics and Machine Learning University College London c.archambeau@cs.ucl.ac.uk CSML
Identification of hotspots of rat abundance and their effect on human risk of leptospirosis in a Brazilian slum community
 Identification of hotspots of rat abundance and their effect on human risk of leptospirosis in a Brazilian slum community Poppy Miller 1 Kate Hacker 2 Peter Diggle 1 Mike Begon 3 James Childs 2 Albert
Comparative effectiveness of dynamic treatment regimes
 Comparative effectiveness of dynamic treatment regimes An application of the parametric g- formula Miguel Hernán Departments of Epidemiology and Biostatistics Harvard School of Public Health www.hsph.harvard.edu/causal
Chris Fraley and Daniel Percival. August 22, 2008, revised May 14, 2010
 Model-Averaged l 1 Regularization using Markov Chain Monte Carlo Model Composition Technical Report No. 541 Department of Statistics, University of Washington Chris Fraley and Daniel Percival August 22,
Niche Modeling. STAMPS - MBL Course Woods Hole, MA - August 9, 2016
 Niche Modeling Katie Pollard & Josh Ladau Gladstone Institutes UCSF Division of Biostatistics, Institute for Human Genetics and Institute for Computational Health Science STAMPS - MBL Course Woods Hole,
Spatio-temporal modeling of avalanche frequencies in the French Alps
 Available online at www.sciencedirect.com Procedia Environmental Sciences 77 (011) 311 316 1 11 Spatial statistics 011 Spatio-temporal modeling of avalanche frequencies in the French Alps Aurore Lavigne
Lecture 1 January 18
 STAT 263/363: Experimental Design Winter 2016/17 Lecture 1 January 18 Lecturer: Art B. Owen Scribe: Julie Zhu Overview Experiments are powerful because you can conclude causality from the results. In most
Stochastic Hydrology. a) Data Mining for Evolution of Association Rules for Droughts and Floods in India using Climate Inputs
 Data Mining for Evolution of Association Rules for Droughts and Floods in India using Climate Inputs") Stochastic Hydrology a) Data Mining for Evolution of Association Rules for Droughts and Floods in India using Climate Inputs An accurate prediction of extreme rainfall events can significantly aid in policy
Stochastic Hydrology a) Data Mining for Evolution of Association Rules for Droughts and Floods in India using Climate Inputs An accurate prediction of extreme rainfall events can significantly aid in policy
Proteomics and Variable Selection
 Proteomics and Variable Selection p. 1/55 Proteomics and Variable Selection Alex Lewin With thanks to Paul Kirk for some graphs Department of Epidemiology and Biostatistics, School of Public Health, Imperial
Data Integration Model for Air Quality: A Hierarchical Approach to the Global Estimation of Exposures to Ambient Air Pollution
 Data Integration Model for Air Quality: A Hierarchical Approach to the Global Estimation of Exposures to Ambient Air Pollution Matthew Thomas 9 th January 07 / 0 OUTLINE Introduction Previous methods for
Bayesian methods for missing data: part 1. Key Concepts. Nicky Best and Alexina Mason. Imperial College London
 Bayesian methods for missing data: part 1 Key Concepts Nicky Best and Alexina Mason Imperial College London BAYES 2013, May 21-23, Erasmus University Rotterdam Missing Data: Part 1 BAYES2013 1 / 68 Outline
Flexible Spatio-temporal smoothing with array methods
 Int. Statistical Inst.: Proc. 58th World Statistical Congress, 2011, Dublin (Session IPS046) p.849 Flexible Spatio-temporal smoothing with array methods Dae-Jin Lee CSIRO, Mathematics, Informatics and
Goodness-of-Fit Tests for the Ordinal Response Models with Misspecified Links
 Communications of the Korean Statistical Society 2009, Vol 16, No 4, 697 705 Goodness-of-Fit Tests for the Ordinal Response Models with Misspecified Links Kwang Mo Jeong a, Hyun Yung Lee 1, a a Department
Spatial data analysis
 Spatial data analysis Global Health Sciences Global Health Group Data Science Africa 2016 Ricardo Andrade Outline The geographic context Geostatistics Non-linear models Discrete processes Time interactions
Previous lecture. P-value based combination. Fixed vs random effects models. Meta vs. pooled- analysis. New random effects testing.
 Previous lecture P-value based combination. Fixed vs random effects models. Meta vs. pooled- analysis. New random effects testing. Interaction Outline: Definition of interaction Additive versus multiplicative
BIOL 51A - Biostatistics 1 1. Lecture 1: Intro to Biostatistics. Smoking: hazardous? FEV (l) Smoke
 Smoke") BIOL 51A - Biostatistics 1 1 Lecture 1: Intro to Biostatistics Smoking: hazardous? FEV (l) 1 2 3 4 5 No Yes Smoke BIOL 51A - Biostatistics 1 2 Box Plot a.k.a box-and-whisker diagram or candlestick chart
BIOL 51A - Biostatistics 1 1 Lecture 1: Intro to Biostatistics Smoking: hazardous? FEV (l) 1 2 3 4 5 No Yes Smoke BIOL 51A - Biostatistics 1 2 Box Plot a.k.a box-and-whisker diagram or candlestick chart
CLIMATE AND LAND USE DRIVERS OF MALARIA RISK IN THE PERUVIAN AMAZON,
 CLIMATE AND LAND USE DRIVERS OF MALARIA RISK IN THE PERUVIAN AMAZON, 2001-2012 Ben Zaitchik Johns Hopkins University Beth Feingold, Denis Valle, Alex Sandoval, Carlos Alvarez Antonio, Rosa Patricia Zegarra
On dealing with spatially correlated residuals in remote sensing and GIS
 On dealing with spatially correlated residuals in remote sensing and GIS Nicholas A. S. Hamm 1, Peter M. Atkinson and Edward J. Milton 3 School of Geography University of Southampton Southampton SO17 3AT
Lognormal Measurement Error in Air Pollution Health Effect Studies
 Lognormal Measurement Error in Air Pollution Health Effect Studies Richard L. Smith Department of Statistics and Operations Research University of North Carolina, Chapel Hill rls@email.unc.edu Presentation
Time Series. Anthony Davison. c
 Series Anthony Davison c 2008 http://stat.epfl.ch Periodogram 76 Motivation............................................................ 77 Lutenizing hormone data..................................................
Lecture 01: Introduction
 Lecture 01: Introduction Dipankar Bandyopadhyay, Ph.D. BMTRY 711: Analysis of Categorical Data Spring 2011 Division of Biostatistics and Epidemiology Medical University of South Carolina Lecture 01: Introduction
Spatial Inference of Nitrate Concentrations in Groundwater
 Spatial Inference of Nitrate Concentrations in Groundwater Dawn Woodard Operations Research & Information Engineering Cornell University joint work with Robert Wolpert, Duke Univ. Dept. of Statistical
Time Series Analysis -- An Introduction -- AMS 586
 Time Series Analysis -- An Introduction -- AMS 586 1 Objectives of time series analysis Data description Data interpretation Modeling Control Prediction & Forecasting 2 Time-Series Data Numerical data
Dengue Forecasting Project
 Dengue Forecasting Project In areas where dengue is endemic, incidence follows seasonal transmission patterns punctuated every few years by much larger epidemics. Because these epidemics are currently
Spatio-temporal modelling of daily air temperature in Catalonia
 Spatio-temporal modelling of daily air temperature in Catalonia M. Saez 1,, M.A. Barceló 1,, A. Tobias 3, D. Varga 1,4 and R. Ocaña-Riola 5 1 Research Group on Statistics, Applied Economics and Health
An application of the GAM-PCA-VAR model to respiratory disease and air pollution data
 An application of the GAM-PCA-VAR model to respiratory disease and air pollution data Márton Ispány 1 Faculty of Informatics, University of Debrecen Hungary Joint work with Juliana Bottoni de Souza, Valdério
USING CLUSTERING SOFTWARE FOR EXPLORING SPATIAL AND TEMPORAL PATTERNS IN NON-COMMUNICABLE DISEASES
 USING CLUSTERING SOFTWARE FOR EXPLORING SPATIAL AND TEMPORAL PATTERNS IN NON-COMMUNICABLE DISEASES Mariana Nagy "Aurel Vlaicu" University of Arad Romania Department of Mathematics and Computer Science
EpiMAN-TB, a decision support system using spatial information for the management of tuberculosis in cattle and deer in New Zealand
 EpiMAN-TB, a decision support system using spatial information for the management of tuberculosis in cattle and deer in New Zealand J.S. McKenzie 1, R.S. Morris 1, C.J. Tutty 2, D.U. Pfeiffer 1 Dept of
Introduction to Bayesian Inference
 Introduction to Bayesian Inference p. 1/2 Introduction to Bayesian Inference September 15th, 2010 Reading: Hoff Chapter 1-2 Introduction to Bayesian Inference p. 2/2 Probability: Measurement of Uncertainty
Report on Kriging in Interpolation
 Tabor Reedy ENVS421 3/12/15 Report on Kriging in Interpolation In this project I explored use of the geostatistical analyst extension and toolbar in the process of creating an interpolated surface through
ECLT 5810 Linear Regression and Logistic Regression for Classification. Prof. Wai Lam
 ECLT 5810 Linear Regression and Logistic Regression for Classification Prof. Wai Lam Linear Regression Models Least Squares Input vectors is an attribute / feature / predictor (independent variable) The
Lecture 5: Poisson and logistic regression
 Dankmar Böhning Southampton Statistical Sciences Research Institute University of Southampton, UK S 3 RI, 3-5 March 2014 introduction to Poisson regression application to the BELCAP study introduction
Introduction to ecosystem modelling Stages of the modelling process
 NGEN02 Ecosystem Modelling 2018 Introduction to ecosystem modelling Stages of the modelling process Recommended reading: Smith & Smith Environmental Modelling, Chapter 2 Models in science and research
1 The problem of survival analysis
 1 The problem of survival analysis Survival analysis concerns analyzing the time to the occurrence of an event. For instance, we have a dataset in which the times are 1, 5, 9, 20, and 22. Perhaps those
Statistical challenges in Disease Ecology
 Statistical challenges in Disease Ecology Jennifer Hoeting Department of Statistics Colorado State University February 2018 Statistics rocks! Get thee to graduate school Colorado State University, Department
Everything is related to everything else, but near things are more related than distant things.
 SPATIAL ANALYSIS DR. TRIS ERYANDO, MA Everything is related to everything else, but near things are more related than distant things. (attributed to Tobler) WHAT IS SPATIAL DATA? 4 main types event data,
Applications of GIS in Health Research. West Nile virus
 Applications of GIS in Health Research West Nile virus Outline Part 1. Applications of GIS in Health research or spatial epidemiology Disease Mapping Cluster Detection Spatial Exposure Assessment Assessment
Characterisation of Near-Earth Magnetic Field Data for Space Weather Monitoring
 Contact: Qingying Shu q.shu.1@research.gla.ac.uk School of Mathematics and Statistics University of Glasgow G12 8QW, Scotland, UK Space Glasgow Space Weather: The Physics Behind a Slogan (2005) Characterisation
STATISTICS-STAT (STAT)
") Statistics-STAT (STAT) 1 STATISTICS-STAT (STAT) Courses STAT 158 Introduction to R Programming Credit: 1 (1-0-0) Programming using the R Project for the Statistical Computing. Data objects, for loops,
Statistics-STAT (STAT) 1 STATISTICS-STAT (STAT) Courses STAT 158 Introduction to R Programming Credit: 1 (1-0-0) Programming using the R Project for the Statistical Computing. Data objects, for loops,
Bayesian Areal Wombling for Geographic Boundary Analysis
 Bayesian Areal Wombling for Geographic Boundary Analysis Haolan Lu, Haijun Ma, and Bradley P. Carlin haolanl@biostat.umn.edu, haijunma@biostat.umn.edu, and brad@biostat.umn.edu Division of Biostatistics
Mathematical Modelling on the CDTI Prospects for Elimination of Onchocerciasis: A Deterministic Model Approach
 Research Journal of Mathematics and tatistics 3(4): 136-14, 211 N: 24-755 Mawell cientific Organization, 211 ubmitted: October 2, 211 Accepted: November 4, 211 Published: December 15, 211 Mathematical
Cluster Analysis using SaTScan. Patrick DeLuca, M.A. APHEO 2007 Conference, Ottawa October 16 th, 2007
 Cluster Analysis using SaTScan Patrick DeLuca, M.A. APHEO 2007 Conference, Ottawa October 16 th, 2007 Outline Clusters & Cluster Detection Spatial Scan Statistic Case Study 28 September 2007 APHEO Conference
Uncertainty quantification of world population growth: A self-similar PDF model
 DOI 10.1515/mcma-2014-0005 Monte Carlo Methods Appl. 2014; 20 (4):261 277 Research Article Stefan Heinz Uncertainty quantification of world population growth: A self-similar PDF model Abstract: The uncertainty
The STS Surgeon Composite Technical Appendix
 The STS Surgeon Composite Technical Appendix Overview Surgeon-specific risk-adjusted operative operative mortality and major complication rates were estimated using a bivariate random-effects logistic
Roger S. Bivand Edzer J. Pebesma Virgilio Gömez-Rubio. Applied Spatial Data Analysis with R. 4:1 Springer
 Roger S. Bivand Edzer J. Pebesma Virgilio Gömez-Rubio Applied Spatial Data Analysis with R 4:1 Springer Contents Preface VII 1 Hello World: Introducing Spatial Data 1 1.1 Applied Spatial Data Analysis
LARGE NUMBERS OF EXPLANATORY VARIABLES. H.S. Battey. WHAO-PSI, St Louis, 9 September 2018
 LARGE NUMBERS OF EXPLANATORY VARIABLES HS Battey Department of Mathematics, Imperial College London WHAO-PSI, St Louis, 9 September 2018 Regression, broadly defined Response variable Y i, eg, blood pressure,