Lognormal Measurement Error in Air Pollution Health Effect Studies
|
|
|
- Emily Neal
- 5 years ago
- Views:
Transcription
1 Lognormal Measurement Error in Air Pollution Health Effect Studies Richard L. Smith Department of Statistics and Operations Research University of North Carolina, Chapel Hill Presentation for SAMSI Spatial Epidemiology Course October Funded by NIH/NIEHS With Jim Crooks (EPA), Duanping Liao (Penn State), Eric Whitsel, Miguel Quibrera, Diane Catellier (UNC) 1
2 Background on EEAWHI Environmental Epidemiology of Arrhythmogenesis in the Women s Health Initiative Multi-university study centered at UNC; other partners include Penn State, Wake Forest, University of Washington Objective to study effects of air pollution (especially PM 10, PM 2.5 ) on participants in the Women s Health Initiative clinical trials, through various twelve-lead electrocardiographic measures including heart rate and heart rate variability. Multi-center study A major issue is interpolation of air pollution data from monitors to participants addresses 2
3 Paper 1: GIS Approaches for the Estimation of Residential-Level Ambient PM Concentrations, by Duanping Liao and co-authors. Environmental Health Perspectives 114, (number 9, September 2006). 3
4 Data: Daily PM 10 and PM 2.5 measurements for from EPA s Air Quality System (2000 data used in this study) Mean of 325 PM 10 sites per day (range: ) Mean of 456 PM 2.5 sites per day (range: ) Latitude-longitude coordinates of monitor sites Geocoded addresses of WHI participants (some geocoding error) Mean distance from participant s address to nearest monitor is km. (median is 7.81 km.) Overall mean level of PM 10 : µg/m 3 Overall mean level of PM 2.5 : µg/m 3 4
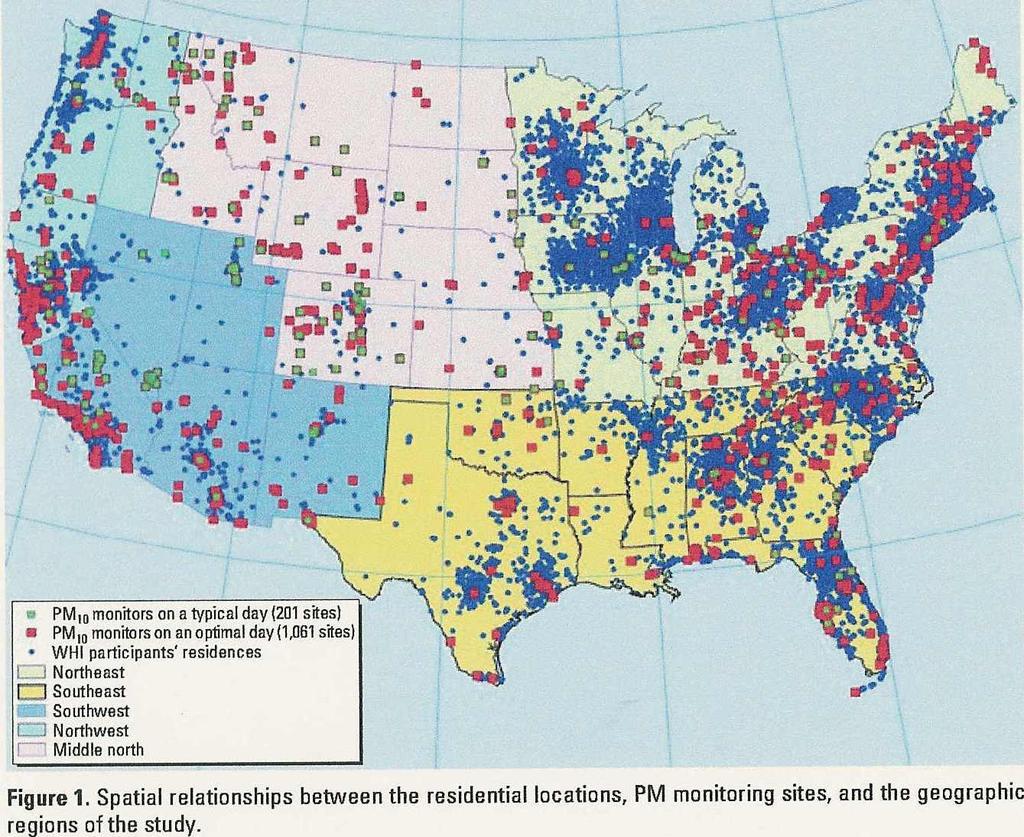
5 5
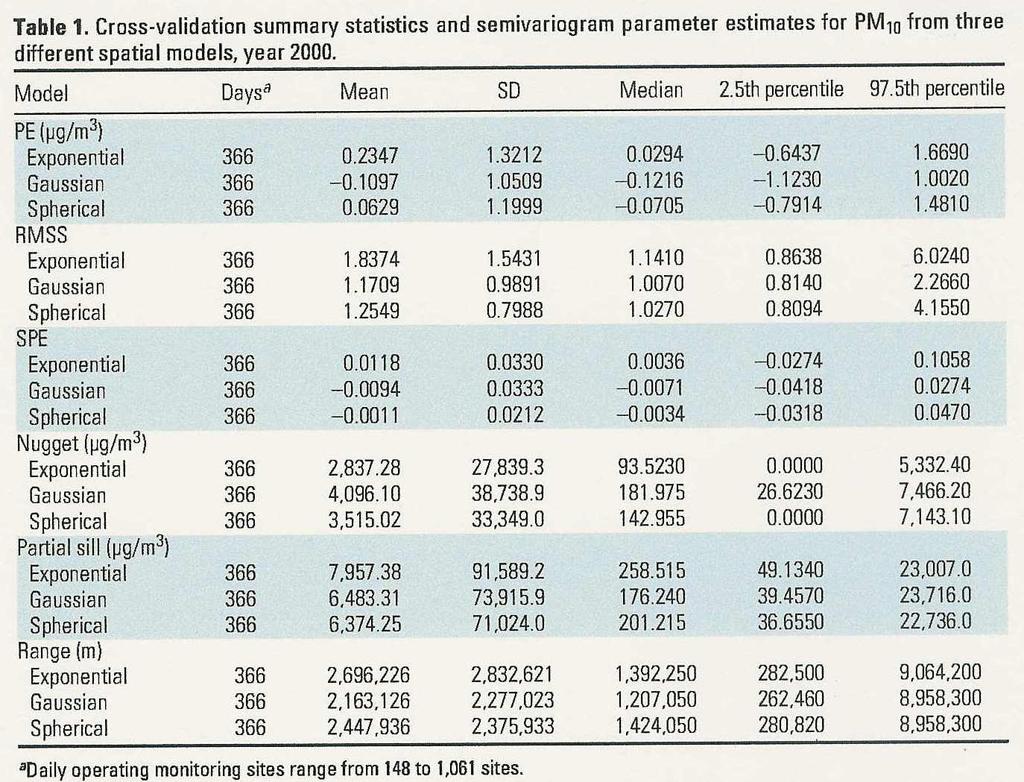
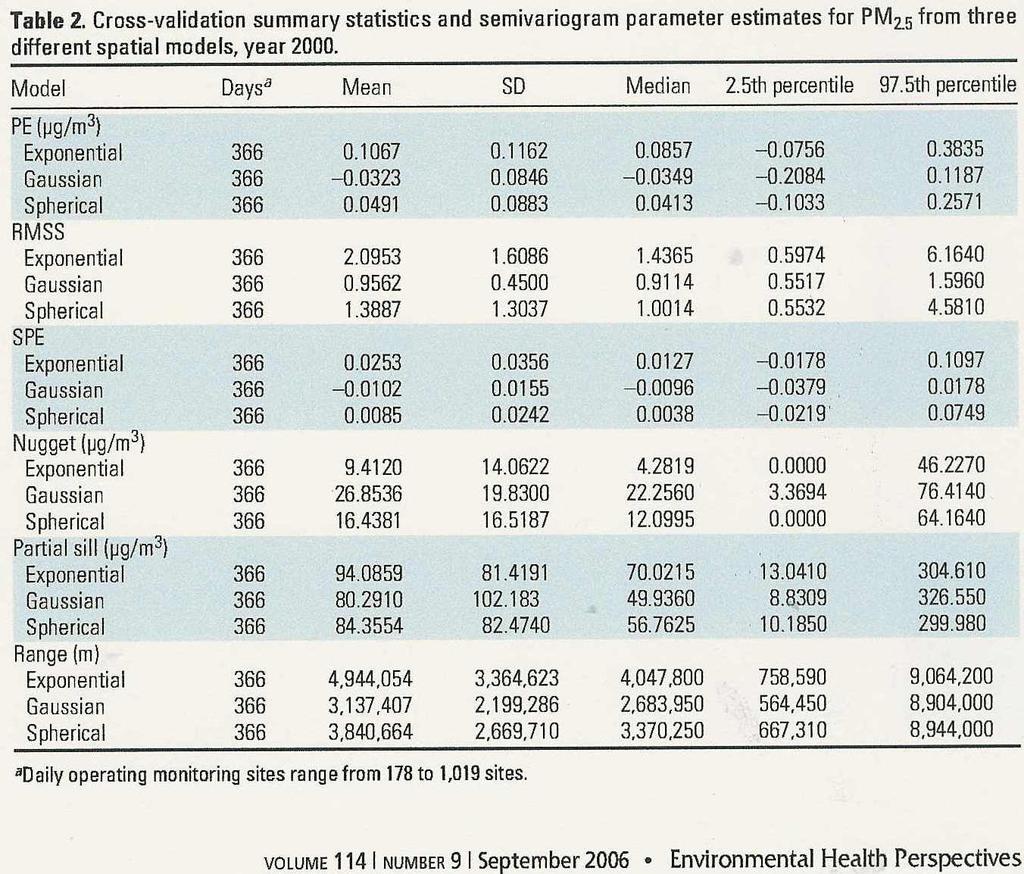
6 Analytic Methods ArcView GIS and Geostatistical Analyst Extension used for determining semivariogram and kriging. Spherical, exponential and Gaussian covariance models Fitted by Cressie s WLS method (option of manual adjustment ) Estimated parameters: range, partial sill and nugget Ordinary normal or lognormal kriging, together with standard error estimation (SE) Cross-validation used to assess goodness of fit PE: average of prediction error SPE: average of standardized prediction error (i.e. divide by SE of estimation across all sites) RMSS: Standard deviation of SPE across all sites (should be 1) SE: Average of SEs of all estimations RMS: Root mean square error 6
7 Tables 1 and 2 Show spatial model parameters and cross-validations for PM 10 (Table 1) and PM 2.5 (Table 2). Overall the three models appear comparable but spherical slightly better than the others Cross-validation statistics satisfactory but there are individual days where RMSS is much greater than 1 7
8 8
9 9
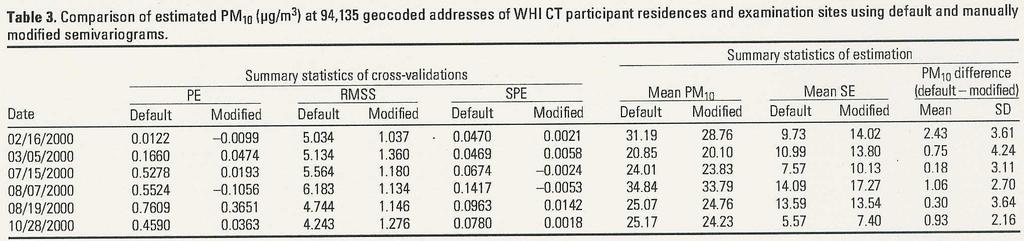
10 Table 3 Examined manual adjustment of model parameters on 6 days when RMSS was especially bad. Manual adjustment improves RMSS but at cost of overall prediction error (especially, see Mean SE column) Conclusion: Manual adjustment not worth the effort 10
11 11
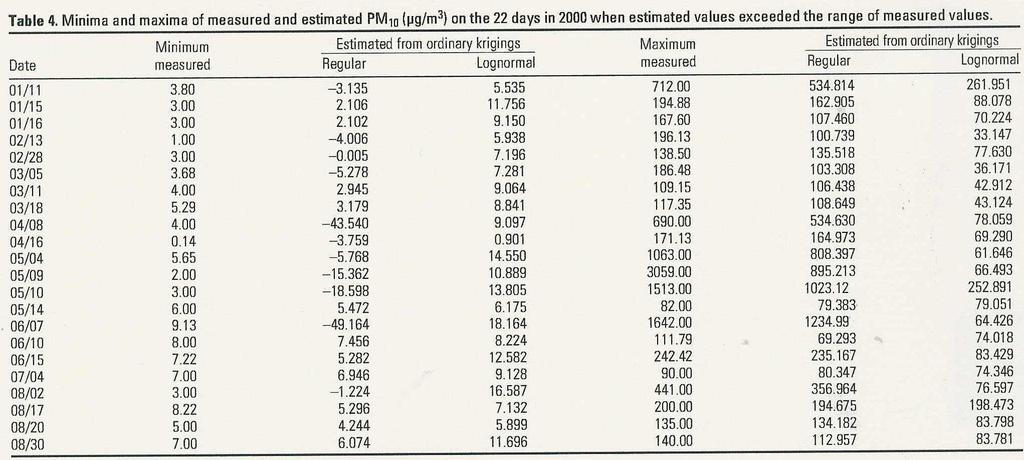
12 Table 4 Compared regular and lognormal kriging, focussing on 22 days where predictions has a wider range than observations On those days, lognormal does better than regular (e.g. only one day when minimum of lognormal kriging is smaller than minimum of data) Conclusion: Prefer lognormal kriging (Table 5, not shown here, also supported this by looking at cross-validations on the 22 bad days) 12
13 13
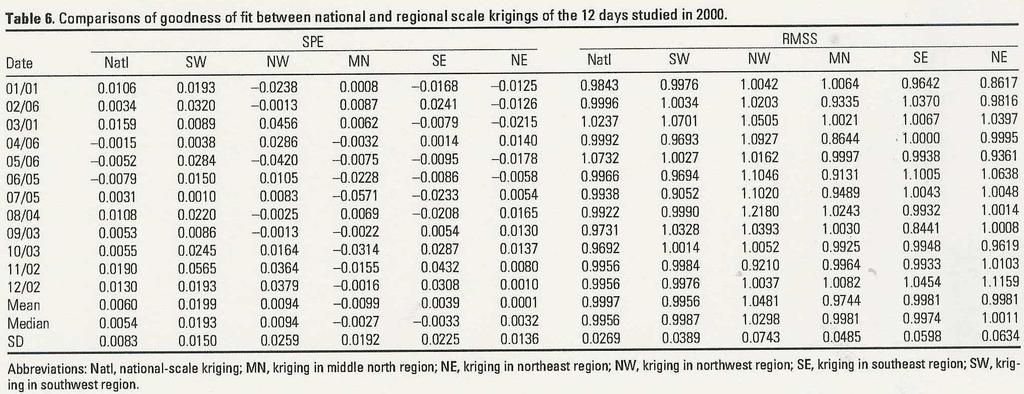
14 Table 6 Compared regional and national kriging from 12 randomly selected days with > 900 monitors. National kriging did at least as well. Moreover, this is just for good days (large number of monitors) for which we would expect regional kriging to do well. Conclusion (controversial!): Prefer national kriging 14
15 15
16 Overall conclusions on spatial interpolation Use lognormal kriging based on spherical covariance model fitted by WLS Separate analysis for each day Proposed national model (i.e. one spatial model for all data on any given day) as this is simpler to implement and seems no less accurate 16
17 Paper 2: Hierarchical Models for the Effect of Spatial Interpolation Error on the Inferred Relationship between Ambient Particulate Matter Exposure and Cardiovascular Health Crooks et al. 17
18 Overview of Problem Data from 53,000 participants in 57 centers Response variable: A measure of heart performance log RR: inverse of heart rate log RMSSD: standard deviation of RR Individual-level covariates (e.g. history of CHD, hypertension, diabetes, age, temperature, race/ethnicity, day of week, season, also smoking status, prior history of lung disease and use of beta-blockers. PM 10 or PM 2.5 (with SE) from lognormal kriging Objective is to determine effect of PM on RR or RMSSD, controlling for all the other variables (concentrate on RR here) 18
19 Simple Regressions Log RR as response Covariates: Exam site (categorical with 57 levels) Temperature Time of Day Season Day of week Participant characteristics PM 10 or PM 2.5 at various lags 19
20 20
21 Interactions Consider subgroups defined by smoking status (SM), prior history of lung disease (LD) and use of beta-blockers (BB) Only the group with no SM or LD produces a statistically significant result Suggests we split participants by Non smoker with no history of lung disease Everyone else and then further subdivide by use of beta-blockers. (Maybe PM 10 effect slightly stronger than PM 2.5 ) 21
22 22
23 23
24 NMMAPS-style Analysis Fit regressions separately to each of 57 centers (participant numbers range from 57 to 1972) Use tlnise program to combine main regression coefficient across sites Restricted to four main subgroups identified in previous analysis, with PM average across lags 0 and 1. 24
25 25
26 Fully Bayesian Analysis Extends NMMAPS analysis by allowing for measurement error within centers Assumes prior distribution for PM variable defined by lognormal kriging For simplicity present only model without subgroups, but extension to subgroups case is straightforward 26
27 Variables y ij : Response of subject j at center i x ij1 : PM 10 at subject s address (unknown) x ijk, k = 2,..., K: Other subject-specific covariates (known) z it, t = 1,..., T : Center-specific covariates at center i V ij : Estimate of x ij1 from kriging procedure s ij : Standard error of x ij1 from kriging procedure β ik, θ ik, α kt : Regression coefficients κ i, ψ k, τ k : Precision parameters a 0, b 0, c 0, d 0, e 0, f 0 : Gamma hyperparameters (set = 0.001) α k : vector of α kt, t = 1,..., T, β i : vector of β ik, k = 1,..., K, θ i vector of θ ik, k = 1,..., K for fixed i, θ k vector of θ ik, i = 1,..., C for fixed k, x ij : vector of x ijk, k = 1,..., K for fixed i and j, Z: matrix of z it Ψ: diagonal matrix of ψ 1,..., ψ K. 27
28 Statistical Model y ij N k x ijk β ik, κ 1, j = 1,..., n i, i = 1,..., C, i κ i Γ[a 0, b 0 ], β ik N [ θ ik, ψk 1 ], k = 1,..., K, ψ k Γ[c 0, d 0 ], θ ik N T t=1 τ k Γ[e 0, f 0 ]), α kt U[, ], z it α kt, τ 1 log x ij1 N [ log V ij, u ij ] k, (u ij known, = s2 ij ). Vij 2 28
29 Conditional Distributions κ i Γ a 0 + n i 2, b ψ k Γ c 0 + C 2, d τ k Γ e 0 + C 2, f j i i y ij k (β ik θ ik ) 2 θ ik t α k N [ (Z T Z) 1 Z T θ k, (τ k Z T Z) 1], [ ψk β θ ik N ik + τ k t z it α kt 1, ψ k + τ k ψ k + τ k... x ijk β ik, z it α kt ], 2, 2, 29
30 Conditional Distributions (continued) β i N 1 κ i x ij x T ij + Ψ κ i x ij y ij + Ψθ i j κ i x ij x T ij + Ψ j 1, x ij1 Update by Metropolis j, 30
31 RESULTS Focus on α 1,..., α 4 : estimates of PM regression parameter in four main subgroups k = 1: no SM/LD, no BB; k = 2: SM or LD, no BB; k = 3: no SM/LD, with BB; k = 4: SM or LD, with BB. Also consider multiplying PM standard deviation by multiplier M M = 0: ignore measurement error M = 1: true measurement error SD M = 2: alternative case to illustrate effect of increasing SD of measurement error 31
32 Posterior densities for PM 10 regression coefficient by subgroup (first 2 subgroups) 32
33 Posterior densities for PM 10 regression coefficient by subgroup (last 2 subgroups) 33
34 Posterior densities for PM 2.5 regression coefficient by subgroup (first 2 subgroups) 34
35 Posterior densities for PM 2.5 regression coefficient by subgroup (last 2 subgroups) 35
36 36
37 37
38 MCMC Convergence Diagnostics Used Gelman-Rubin diagnostics (CODA package) 4 independent model runs, iterations (only did case for M = 1 with PM 10 as variable of interest) Starting values overdispersed multiplied initial PM estimate by 0.2, 1, 5, 25. Gelman-Rubin R should be close to 1 to indicate convergence (result: discard burn-in of 20000) Also used Heidelberg-Welch procedure to compute standard errors from autocorrelated MCMC runs Table 7: Compared posterior estimates across MCMC runs Table 8: Computed probability that α k < 0 for k = 1, 2, 3, 4. 38
39 Gelman-Rubin s R diagnostic (PM 10 coefficient with M=1) 39
40 Posterior Densities of PM 10 coefficient by subgroup, first part (4 runs of MCMC) 40
41 Posterior Densities of PM 10 coefficient by subgroup, last part (4 runs of MCMC) 41
42 42
43 43
44 Conclusions from Data Analysis There is an inverse association between log RR and PM and it does appear to be robust against measurement error (main epidemiological result!) The effect is statistically significant only for non-smokers and individuals without previous lung disease The magnitude of the effect is much larger for the group taking beta-blockers than the group that does not Effect of kriging uncertainty is unclear: sometimes moved posterior distribution towards zero, sometimes away (contrast with Gaussian measurement error case) However for doubled measurement error, the effect always seems to be to move the posterior mean towards zero, but at the same time to decrease the posterior variance 44
45 Simulations (Jim Crooks) We have observed that as M increases, the posterior distribution of the slope parameter becomes narrower and moves towards the origin. Is this a general property? Let V i = i, s i = MV i, i = 1,..., 100 and true data Y i N[V i, 1] (independent). For model-fitting purposes, assume y i N [ β 0 + x i β 1, τ 1], i = 1,..., 100 log(x i ) N [log(v i ), s i /V i ], i = 1,..., 100, π(β j ) 1, j = 0, 1 τ G [0.01, 0.01]. 45
46 Density Density Density β β log(τ) β log(τ) β β 0 The effect of moving M from 0.1 to 2.5. β 1 log(τ) 46
47 Posterior distributions widen as M increases Most dispersed around M = 2.5 By M = 2.5, slope posterior sharply peaked around 0, posterior of β 0 reflects the mean of the data τ also becomes tightly focussed near inverse of sample variance of the Y i s. Next experiment: Hold M = 1, shift whole distribution rightward by W (so V i = i + W ; still s i V i held constant) As W increases, posterior distributions approach interceptonly forms (Interpretation: Posterior estimates are more sensitive to measurement error when W is large) 47
48 Density Density W values Density β β log(τ) β log(τ) β β 0 β 1 log(τ) The effect of moving x values to the right by a given amount W when M = 1 while holding s/v constant 48
49 If we repeat previous experiment but with s i constant (rather than s i V i ) behavior is different posterior distribution of rescaled intercept β 0 β 1 + W becomes much tighter; posterior distribution of τ more diffuse 49
50 Density W values Density Density β 0 β 1 + W β 1 log(τ) β log(τ) β 0 β 1 + W β 0 β 1 + W The effect of shifting the V values by a given factor W while holding s constant β 1 log(τ) 50
51 Next: multiply V i s all by same Z Present β 1 results rescaled by Z Z : parameters converge to ignored-error values Z 0: parameters converge to intercept-only values Multiplying V i s by Z has same effect as multiplying s i s by M = 1 V. 51
52 Density Z values Density Density β β 1 Z log(τ) β 1 Z log(τ) β β 0 β 1 Z log(τ) The effect of stretching and contracting the V values by a given factor Z while holding s constant 52
53 Stretch and contract all Y values by Q while leaving V i and s i unchanged Posterior distributions of β 0 Q and β 1 Q Q 0. become very dispersed as 53
54 Density Q values 1/200 1/50 1/10 1/4 1 4 Density Density β 0 Q β 1 Q log(τ) β 1 Q log(τ) β 0 Q β 0 Q β 1 Q log(τ) The effect of stretching and contracting the y values by a given factor while holding s and V constant 54
55 Conclusions from Simulations The simulations confirm that the phenomenon based on M in the real data is real. However, there are several other possible data transformations that have a similar effect. 55
56 THE END!! 56
ERIC A. WHITSEL Departments of Epidemiology and Medicine Schools of Public Health and Medicine
 Submitted for publication on August 27, 2008. c The Authors. All rights reserved. Hierarchical Models for the Effect of Spatial Interpolation Error on the Inferred Relationship between Ambient Particulate
Air Pollution Epidemiology R.L.S. 02/05/09
 1 Introduction and Background To be written 2 Time Series Analysis Air Pollution Epidemiology R.L.S. 02/05/09 One of the maor sampling designs for air pollution studies is time series analysis. In the
ESTIMATING THE MEAN LEVEL OF FINE PARTICULATE MATTER: AN APPLICATION OF SPATIAL STATISTICS
 ESTIMATING THE MEAN LEVEL OF FINE PARTICULATE MATTER: AN APPLICATION OF SPATIAL STATISTICS Richard L. Smith Department of Statistics and Operations Research University of North Carolina Chapel Hill, N.C.,
ST 740: Markov Chain Monte Carlo
 ST 740: Markov Chain Monte Carlo Alyson Wilson Department of Statistics North Carolina State University October 14, 2012 A. Wilson (NCSU Stsatistics) MCMC October 14, 2012 1 / 20 Convergence Diagnostics:
Predicting Long-term Exposures for Health Effect Studies
 Predicting Long-term Exposures for Health Effect Studies Lianne Sheppard Adam A. Szpiro, Johan Lindström, Paul D. Sampson and the MESA Air team University of Washington CMAS Special Session, October 13,
11/8/2018. Spatial Interpolation & Geostatistics. Kriging Step 1
 (Z i Z j ) 2 / 2 (Z i Zj) 2 / 2 Semivariance y 11/8/2018 Spatial Interpolation & Geostatistics Kriging Step 1 Describe spatial variation with Semivariogram Lag Distance between pairs of points Lag Mean
STATISTICS 174: APPLIED STATISTICS FINAL EXAM DECEMBER 10, 2002
 Time allowed: 3 HOURS. STATISTICS 174: APPLIED STATISTICS FINAL EXAM DECEMBER 10, 2002 This is an open book exam: all course notes and the text are allowed, and you are expected to use your own calculator.
Introduction. Semivariogram Cloud
 Introduction Data: set of n attribute measurements {z(s i ), i = 1,, n}, available at n sample locations {s i, i = 1,, n} Objectives: Slide 1 quantify spatial auto-correlation, or attribute dissimilarity
Spatial Interpolation & Geostatistics
 (Z i Z j ) 2 / 2 Spatial Interpolation & Geostatistics Lag Lag Mean Distance between pairs of points 1 y Kriging Step 1 Describe spatial variation with Semivariogram (Z i Z j ) 2 / 2 Point cloud Map 3
Models for spatial data (cont d) Types of spatial data. Types of spatial data (cont d) Hierarchical models for spatial data
 Types of spatial data. Types of spatial data (cont d) Hierarchical models for spatial data") Hierarchical models for spatial data Based on the book by Banerjee, Carlin and Gelfand Hierarchical Modeling and Analysis for Spatial Data, 2004. We focus on Chapters 1, 2 and 5. Geo-referenced data arise
Hierarchical models for spatial data Based on the book by Banerjee, Carlin and Gelfand Hierarchical Modeling and Analysis for Spatial Data, 2004. We focus on Chapters 1, 2 and 5. Geo-referenced data arise
Bayesian Methods for Machine Learning
 Bayesian Methods for Machine Learning CS 584: Big Data Analytics Material adapted from Radford Neal s tutorial (http://ftp.cs.utoronto.ca/pub/radford/bayes-tut.pdf), Zoubin Ghahramni (http://hunch.net/~coms-4771/zoubin_ghahramani_bayesian_learning.pdf),
Hierarchical Modeling for Univariate Spatial Data
 Hierarchical Modeling for Univariate Spatial Data Geography 890, Hierarchical Bayesian Models for Environmental Spatial Data Analysis February 15, 2011 1 Spatial Domain 2 Geography 890 Spatial Domain This
Supplement to A Hierarchical Approach for Fitting Curves to Response Time Measurements
 Supplement to A Hierarchical Approach for Fitting Curves to Response Time Measurements Jeffrey N. Rouder Francis Tuerlinckx Paul L. Speckman Jun Lu & Pablo Gomez May 4 008 1 The Weibull regression model
BAYESIAN MODEL FOR SPATIAL DEPENDANCE AND PREDICTION OF TUBERCULOSIS
 BAYESIAN MODEL FOR SPATIAL DEPENDANCE AND PREDICTION OF TUBERCULOSIS Srinivasan R and Venkatesan P Dept. of Statistics, National Institute for Research Tuberculosis, (Indian Council of Medical Research),
Data Integration Model for Air Quality: A Hierarchical Approach to the Global Estimation of Exposures to Ambient Air Pollution
 Data Integration Model for Air Quality: A Hierarchical Approach to the Global Estimation of Exposures to Ambient Air Pollution Matthew Thomas 9 th January 07 / 0 OUTLINE Introduction Previous methods for
STATISTICAL MODELS FOR QUANTIFYING THE SPATIAL DISTRIBUTION OF SEASONALLY DERIVED OZONE STANDARDS
 STATISTICAL MODELS FOR QUANTIFYING THE SPATIAL DISTRIBUTION OF SEASONALLY DERIVED OZONE STANDARDS Eric Gilleland Douglas Nychka Geophysical Statistics Project National Center for Atmospheric Research Supported
BAYESIAN KRIGING AND BAYESIAN NETWORK DESIGN
 BAYESIAN KRIGING AND BAYESIAN NETWORK DESIGN Richard L. Smith Department of Statistics and Operations Research University of North Carolina Chapel Hill, N.C., U.S.A. J. Stuart Hunter Lecture TIES 2004
Previous lecture. P-value based combination. Fixed vs random effects models. Meta vs. pooled- analysis. New random effects testing.
 Previous lecture P-value based combination. Fixed vs random effects models. Meta vs. pooled- analysis. New random effects testing. Interaction Outline: Definition of interaction Additive versus multiplicative
Default Priors and Effcient Posterior Computation in Bayesian
 Default Priors and Effcient Posterior Computation in Bayesian Factor Analysis January 16, 2010 Presented by Eric Wang, Duke University Background and Motivation A Brief Review of Parameter Expansion Literature
Report on Kriging in Interpolation
 Tabor Reedy ENVS421 3/12/15 Report on Kriging in Interpolation In this project I explored use of the geostatistical analyst extension and toolbar in the process of creating an interpolated surface through
Bayesian data analysis in practice: Three simple examples
 Bayesian data analysis in practice: Three simple examples Martin P. Tingley Introduction These notes cover three examples I presented at Climatea on 5 October 0. Matlab code is available by request to
Bayesian spatial hierarchical modeling for temperature extremes
 Bayesian spatial hierarchical modeling for temperature extremes Indriati Bisono Dr. Andrew Robinson Dr. Aloke Phatak Mathematics and Statistics Department The University of Melbourne Maths, Informatics
Convergence Diagnostics For Markov chain Monte Carlo. Eric B. Ford (Penn State) Bayesian Computing for Astronomical Data Analysis June 9, 2017
 Bayesian Computing for Astronomical Data Analysis June 9, 2017") Convergence Diagnostics For Markov chain Monte Carlo Eric B. Ford (Penn State) Bayesian Computing for Astronomical Data Analysis June 9, 2017 MCMC: A Science & an Art Science: If your algorithm is designed
Convergence Diagnostics For Markov chain Monte Carlo Eric B. Ford (Penn State) Bayesian Computing for Astronomical Data Analysis June 9, 2017 MCMC: A Science & an Art Science: If your algorithm is designed
Pumps, Maps and Pea Soup: Spatio-temporal methods in environmental epidemiology
 Pumps, Maps and Pea Soup: Spatio-temporal methods in environmental epidemiology Gavin Shaddick Department of Mathematical Sciences University of Bath 2012-13 van Eeden lecture Thanks Constance van Eeden
Hierarchical Modelling for Univariate Spatial Data
 Hierarchical Modelling for Univariate Spatial Data Sudipto Banerjee 1 and Andrew O. Finley 2 1 Biostatistics, School of Public Health, University of Minnesota, Minneapolis, Minnesota, U.S.A. 2 Department
Combining Incompatible Spatial Data
 Combining Incompatible Spatial Data Carol A. Gotway Crawford Office of Workforce and Career Development Centers for Disease Control and Prevention Invited for Quantitative Methods in Defense and National
spbayes: An R Package for Univariate and Multivariate Hierarchical Point-referenced Spatial Models
 spbayes: An R Package for Univariate and Multivariate Hierarchical Point-referenced Spatial Models Andrew O. Finley 1, Sudipto Banerjee 2, and Bradley P. Carlin 2 1 Michigan State University, Departments
Bayesian SAE using Complex Survey Data Lecture 4A: Hierarchical Spatial Bayes Modeling
 Bayesian SAE using Complex Survey Data Lecture 4A: Hierarchical Spatial Bayes Modeling Jon Wakefield Departments of Statistics and Biostatistics University of Washington 1 / 37 Lecture Content Motivation
Hierarchical Modelling for Multivariate Spatial Data
 Hierarchical Modelling for Multivariate Spatial Data Geography 890, Hierarchical Bayesian Models for Environmental Spatial Data Analysis February 15, 2011 1 Point-referenced spatial data often come as
CASE STUDY: Bayesian Incidence Analyses from Cross-Sectional Data with Multiple Markers of Disease Severity. Outline:
 CASE STUDY: Bayesian Incidence Analyses from Cross-Sectional Data with Multiple Markers of Disease Severity Outline: 1. NIEHS Uterine Fibroid Study Design of Study Scientific Questions Difficulties 2.
STAT 425: Introduction to Bayesian Analysis
 STAT 425: Introduction to Bayesian Analysis Marina Vannucci Rice University, USA Fall 2017 Marina Vannucci (Rice University, USA) Bayesian Analysis (Part 2) Fall 2017 1 / 19 Part 2: Markov chain Monte
Bayesian Hierarchical Models
 Bayesian Hierarchical Models Gavin Shaddick, Millie Green, Matthew Thomas University of Bath 6 th - 9 th December 2016 1/ 34 APPLICATIONS OF BAYESIAN HIERARCHICAL MODELS 2/ 34 OUTLINE Spatial epidemiology
STA 216, GLM, Lecture 16. October 29, 2007
 STA 216, GLM, Lecture 16 October 29, 2007 Efficient Posterior Computation in Factor Models Underlying Normal Models Generalized Latent Trait Models Formulation Genetic Epidemiology Illustration Structural
Exploring the World of Ordinary Kriging. Dennis J. J. Walvoort. Wageningen University & Research Center Wageningen, The Netherlands
 Exploring the World of Ordinary Kriging Wageningen University & Research Center Wageningen, The Netherlands July 2004 (version 0.2) What is? What is it about? Potential Users a computer program for exploring
Introduction to Geostatistics
 Introduction to Geostatistics Abhi Datta 1, Sudipto Banerjee 2 and Andrew O. Finley 3 July 31, 2017 1 Department of Biostatistics, Bloomberg School of Public Health, Johns Hopkins University, Baltimore,
Measurement Error in Spatial Modeling of Environmental Exposures
 Measurement Error in Spatial Modeling of Environmental Exposures Chris Paciorek, Alexandros Gryparis, and Brent Coull August 9, 2005 Department of Biostatistics Harvard School of Public Health www.biostat.harvard.edu/~paciorek
Spatial Data Mining. Regression and Classification Techniques
 Spatial Data Mining Regression and Classification Techniques 1 Spatial Regression and Classisfication Discrete class labels (left) vs. continues quantities (right) measured at locations (2D for geographic
Bayesian linear regression
 Bayesian linear regression Linear regression is the basis of most statistical modeling. The model is Y i = X T i β + ε i, where Y i is the continuous response X i = (X i1,..., X ip ) T is the corresponding
Bayesian dynamic modeling for large space-time weather datasets using Gaussian predictive processes
 Bayesian dynamic modeling for large space-time weather datasets using Gaussian predictive processes Alan Gelfand 1 and Andrew O. Finley 2 1 Department of Statistical Science, Duke University, Durham, North
Local Likelihood Bayesian Cluster Modeling for small area health data. Andrew Lawson Arnold School of Public Health University of South Carolina
 Local Likelihood Bayesian Cluster Modeling for small area health data Andrew Lawson Arnold School of Public Health University of South Carolina Local Likelihood Bayesian Cluster Modelling for Small Area
Concepts and Applications of Kriging. Eric Krause
 Concepts and Applications of Kriging Eric Krause Sessions of note Tuesday ArcGIS Geostatistical Analyst - An Introduction 8:30-9:45 Room 14 A Concepts and Applications of Kriging 10:15-11:30 Room 15 A
Extended Follow-Up and Spatial Analysis of the American Cancer Society Study Linking Particulate Air Pollution and Mortality
 Extended Follow-Up and Spatial Analysis of the American Cancer Society Study Linking Particulate Air Pollution and Mortality Daniel Krewski, Michael Jerrett, Richard T Burnett, Renjun Ma, Edward Hughes,
Measurement error as missing data: the case of epidemiologic assays. Roderick J. Little
 Measurement error as missing data: the case of epidemiologic assays Roderick J. Little Outline Discuss two related calibration topics where classical methods are deficient (A) Limit of quantification methods
SAMPLING ALGORITHMS. In general. Inference in Bayesian models
 SAMPLING ALGORITHMS SAMPLING ALGORITHMS In general A sampling algorithm is an algorithm that outputs samples x 1, x 2,... from a given distribution P or density p. Sampling algorithms can for example be
Luke B Smith and Brian J Reich North Carolina State University May 21, 2013
 BSquare: An R package for Bayesian simultaneous quantile regression Luke B Smith and Brian J Reich North Carolina State University May 21, 2013 BSquare in an R package to conduct Bayesian quantile regression
Bayesian Methods in Multilevel Regression
 Bayesian Methods in Multilevel Regression Joop Hox MuLOG, 15 september 2000 mcmc What is Statistics?! Statistics is about uncertainty To err is human, to forgive divine, but to include errors in your design
Markov Chain Monte Carlo methods
 Markov Chain Monte Carlo methods By Oleg Makhnin 1 Introduction a b c M = d e f g h i 0 f(x)dx 1.1 Motivation 1.1.1 Just here Supresses numbering 1.1.2 After this 1.2 Literature 2 Method 2.1 New math As
Hierarchical Modelling for Univariate and Multivariate Spatial Data
 Hierarchical Modelling for Univariate and Multivariate Spatial Data p. 1/4 Hierarchical Modelling for Univariate and Multivariate Spatial Data Sudipto Banerjee sudiptob@biostat.umn.edu University of Minnesota
Modeling and Interpolation of Non-Gaussian Spatial Data: A Comparative Study
 Modeling and Interpolation of Non-Gaussian Spatial Data: A Comparative Study Gunter Spöck, Hannes Kazianka, Jürgen Pilz Department of Statistics, University of Klagenfurt, Austria hannes.kazianka@uni-klu.ac.at
Climate Change: the Uncertainty of Certainty
 Climate Change: the Uncertainty of Certainty Reinhard Furrer, UZH JSS, Geneva Oct. 30, 2009 Collaboration with: Stephan Sain - NCAR Reto Knutti - ETHZ Claudia Tebaldi - Climate Central Ryan Ford, Doug
On dealing with spatially correlated residuals in remote sensing and GIS
 On dealing with spatially correlated residuals in remote sensing and GIS Nicholas A. S. Hamm 1, Peter M. Atkinson and Edward J. Milton 3 School of Geography University of Southampton Southampton SO17 3AT
Partial factor modeling: predictor-dependent shrinkage for linear regression
 modeling: predictor-dependent shrinkage for linear Richard Hahn, Carlos Carvalho and Sayan Mukherjee JASA 2013 Review by Esther Salazar Duke University December, 2013 Factor framework The factor framework
Statistícal Methods for Spatial Data Analysis
 Texts in Statistícal Science Statistícal Methods for Spatial Data Analysis V- Oliver Schabenberger Carol A. Gotway PCT CHAPMAN & K Contents Preface xv 1 Introduction 1 1.1 The Need for Spatial Analysis
Copyright The McGraw-Hill Companies, Inc. Permission required for reproduction or display.
 Chapter 15. SPATIAL INTERPOLATION 15.1 Elements of Spatial Interpolation 15.1.1 Control Points 15.1.2 Type of Spatial Interpolation 15.2 Global Methods 15.2.1 Trend Surface Models Box 15.1 A Worked Example
Hierarchical Modelling for Univariate Spatial Data
 Spatial omain Hierarchical Modelling for Univariate Spatial ata Sudipto Banerjee 1 and Andrew O. Finley 2 1 Biostatistics, School of Public Health, University of Minnesota, Minneapolis, Minnesota, U.S.A.
Supplementary Appendix
 Supplementary Appendix This appendix has been provided by the authors to give readers additional information about their work. Supplement to: Downs SH, Schindler C, Liu L-JS, et al. Reduced exposure to
I don t have much to say here: data are often sampled this way but we more typically model them in continuous space, or on a graph
 Spatial analysis Huge topic! Key references Diggle (point patterns); Cressie (everything); Diggle and Ribeiro (geostatistics); Dormann et al (GLMMs for species presence/abundance); Haining; (Pinheiro and
Hastings-within-Gibbs Algorithm: Introduction and Application on Hierarchical Model
 UNIVERSITY OF TEXAS AT SAN ANTONIO Hastings-within-Gibbs Algorithm: Introduction and Application on Hierarchical Model Liang Jing April 2010 1 1 ABSTRACT In this paper, common MCMC algorithms are introduced
Bayesian Networks in Educational Assessment
 Bayesian Networks in Educational Assessment Estimating Parameters with MCMC Bayesian Inference: Expanding Our Context Roy Levy Arizona State University Roy.Levy@asu.edu 2017 Roy Levy MCMC 1 MCMC 2 Posterior
Concepts and Applications of Kriging
 Esri International User Conference San Diego, California Technical Workshops July 24, 2012 Concepts and Applications of Kriging Konstantin Krivoruchko Eric Krause Outline Intro to interpolation Exploratory
Asymptotic Multivariate Kriging Using Estimated Parameters with Bayesian Prediction Methods for Non-linear Predictands
 Asymptotic Multivariate Kriging Using Estimated Parameters with Bayesian Prediction Methods for Non-linear Predictands Elizabeth C. Mannshardt-Shamseldin Advisor: Richard L. Smith Duke University Department
Optimal rules for timing intercourse to achieve pregnancy
 Optimal rules for timing intercourse to achieve pregnancy Bruno Scarpa and David Dunson Dipartimento di Statistica ed Economia Applicate Università di Pavia Biostatistics Branch, National Institute of
Statistical and epidemiological considerations in using remote sensing data for exposure estimation
 Statistical and epidemiological considerations in using remote sensing data for exposure estimation Chris Paciorek Department of Biostatistics Harvard School of Public Health Collaborators: Yang Liu, Doug
Comparing Non-informative Priors for Estimation and Prediction in Spatial Models
 Environmentrics 00, 1 12 DOI: 10.1002/env.XXXX Comparing Non-informative Priors for Estimation and Prediction in Spatial Models Regina Wu a and Cari G. Kaufman a Summary: Fitting a Bayesian model to spatial
Gaussian processes for spatial modelling in environmental health: parameterizing for flexibility vs. computational efficiency
 Gaussian processes for spatial modelling in environmental health: parameterizing for flexibility vs. computational efficiency Chris Paciorek March 11, 2005 Department of Biostatistics Harvard School of
Bayesian methods for missing data: part 1. Key Concepts. Nicky Best and Alexina Mason. Imperial College London
 Bayesian methods for missing data: part 1 Key Concepts Nicky Best and Alexina Mason Imperial College London BAYES 2013, May 21-23, Erasmus University Rotterdam Missing Data: Part 1 BAYES2013 1 / 68 Outline
Classical and Bayesian inference
 Classical and Bayesian inference AMS 132 January 18, 2018 Claudia Wehrhahn (UCSC) Classical and Bayesian inference January 18, 2018 1 / 9 Sampling from a Bernoulli Distribution Theorem (Beta-Bernoulli
Package LBLGXE. R topics documented: July 20, Type Package
 Type Package Package LBLGXE July 20, 2015 Title Bayesian Lasso for detecting Rare (or Common) Haplotype Association and their interactions with Environmental Covariates Version 1.2 Date 2015-07-09 Author
Part 8: GLMs and Hierarchical LMs and GLMs
 Part 8: GLMs and Hierarchical LMs and GLMs 1 Example: Song sparrow reproductive success Arcese et al., (1992) provide data on a sample from a population of 52 female song sparrows studied over the course
Markov Chain Monte Carlo
 Markov Chain Monte Carlo Recall: To compute the expectation E ( h(y ) ) we use the approximation E(h(Y )) 1 n n h(y ) t=1 with Y (1),..., Y (n) h(y). Thus our aim is to sample Y (1),..., Y (n) from f(y).
Nearest Neighbor Gaussian Processes for Large Spatial Data
 Nearest Neighbor Gaussian Processes for Large Spatial Data Abhi Datta 1, Sudipto Banerjee 2 and Andrew O. Finley 3 July 31, 2017 1 Department of Biostatistics, Bloomberg School of Public Health, Johns
2 Describing Contingency Tables
 2 Describing Contingency Tables I. Probability structure of a 2-way contingency table I.1 Contingency Tables X, Y : cat. var. Y usually random (except in a case-control study), response; X can be random
Practicum : Spatial Regression
 : Alexandra M. Schmidt Instituto de Matemática UFRJ - www.dme.ufrj.br/ alex 2014 Búzios, RJ, www.dme.ufrj.br Exploratory (Spatial) Data Analysis 1. Non-spatial summaries Numerical summaries: Mean, median,
A spatial causal analysis of wildfire-contributed PM 2.5 using numerical model output. Brian Reich, NC State
 A spatial causal analysis of wildfire-contributed PM 2.5 using numerical model output Brian Reich, NC State Workshop on Causal Adjustment in the Presence of Spatial Dependence June 11-13, 2018 Brian Reich,
Bayesian Nonparametric Accelerated Failure Time Models for Analyzing Heterogeneous Treatment Effects
 Bayesian Nonparametric Accelerated Failure Time Models for Analyzing Heterogeneous Treatment Effects Nicholas C. Henderson Thomas A. Louis Gary Rosner Ravi Varadhan Johns Hopkins University September 28,
Practical considerations for survival models
 Including historical data in the analysis of clinical trials using the modified power prior Practical considerations for survival models David Dejardin 1 2, Joost van Rosmalen 3 and Emmanuel Lesaffre 1
Describing Contingency tables
 Today s topics: Describing Contingency tables 1. Probability structure for contingency tables (distributions, sensitivity/specificity, sampling schemes). 2. Comparing two proportions (relative risk, odds
Redistricting Simulation through Markov Chain Monte Carlo
 Redistricting Simulation through Markov Chain Monte Carlo Kosuke Imai Department of Government Department of Statistics Institute for Quantitative Social Science Harvard University SAMSI Quantifying Gerrymandering
Richard D Riley was supported by funding from a multivariate meta-analysis grant from
 Bayesian bivariate meta-analysis of correlated effects: impact of the prior distributions on the between-study correlation, borrowing of strength, and joint inferences Author affiliations Danielle L Burke
A robust statistically based approach to estimating the probability of contamination occurring between sampling locations
 A robust statistically based approach to estimating the probability of contamination occurring between sampling locations Peter Beck Principal Environmental Scientist Image placeholder Image placeholder
Deposited on: 07 September 2010
 Lee, D. and Shaddick, G. (2008) Modelling the effects of air pollution on health using Bayesian dynamic generalised linear models. Environmetrics, 19 (8). pp. 785-804. ISSN 1180-4009 http://eprints.gla.ac.uk/36768
Concepts and Applications of Kriging. Eric Krause Konstantin Krivoruchko
 Concepts and Applications of Kriging Eric Krause Konstantin Krivoruchko Outline Introduction to interpolation Exploratory spatial data analysis (ESDA) Using the Geostatistical Wizard Validating interpolation
Concepts and Applications of Kriging
 2013 Esri International User Conference July 8 12, 2013 San Diego, California Technical Workshop Concepts and Applications of Kriging Eric Krause Konstantin Krivoruchko Outline Intro to interpolation Exploratory
Probabilities for climate projections
 Probabilities for climate projections Claudia Tebaldi, Reinhard Furrer Linda Mearns, Doug Nychka National Center for Atmospheric Research Richard Smith - UNC-Chapel Hill Steve Sain - CU-Denver Statistical
MCMC algorithms for fitting Bayesian models
 MCMC algorithms for fitting Bayesian models p. 1/1 MCMC algorithms for fitting Bayesian models Sudipto Banerjee sudiptob@biostat.umn.edu University of Minnesota MCMC algorithms for fitting Bayesian models
Dynamically updated spatially varying parameterisations of hierarchical Bayesian models for spatially correlated data
 Dynamically updated spatially varying parameterisations of hierarchical Bayesian models for spatially correlated data Mark Bass and Sujit Sahu University of Southampton, UK June 4, 06 Abstract Fitting
Types of Spatial Data
 Spatial Data Types of Spatial Data Point pattern Point referenced geostatistical Block referenced Raster / lattice / grid Vector / polygon Point Pattern Data Interested in the location of points, not their
Bayesian Linear Regression
 Bayesian Linear Regression Sudipto Banerjee 1 Biostatistics, School of Public Health, University of Minnesota, Minneapolis, Minnesota, U.S.A. September 15, 2010 1 Linear regression models: a Bayesian perspective
Space-time data. Simple space-time analyses. PM10 in space. PM10 in time
 Space-time data Observations taken over space and over time Z(s, t): indexed by space, s, and time, t Here, consider geostatistical/time data Z(s, t) exists for all locations and all times May consider
Bayesian dynamic modeling for large space-time weather datasets using Gaussian predictive processes
 Bayesian dynamic modeling for large space-time weather datasets using Gaussian predictive processes Andrew O. Finley 1 and Sudipto Banerjee 2 1 Department of Forestry & Department of Geography, Michigan
Gridding of precipitation and air temperature observations in Belgium. Michel Journée Royal Meteorological Institute of Belgium (RMI)
") Gridding of precipitation and air temperature observations in Belgium Michel Journée Royal Meteorological Institute of Belgium (RMI) Gridding of meteorological data A variety of hydrologic, ecological,
Gridding of precipitation and air temperature observations in Belgium Michel Journée Royal Meteorological Institute of Belgium (RMI) Gridding of meteorological data A variety of hydrologic, ecological,
Model Selection in Bayesian Survival Analysis for a Multi-country Cluster Randomized Trial
 Model Selection in Bayesian Survival Analysis for a Multi-country Cluster Randomized Trial Jin Kyung Park International Vaccine Institute Min Woo Chae Seoul National University R. Leon Ochiai International
Metropolis-Hastings Algorithm
 Strength of the Gibbs sampler Metropolis-Hastings Algorithm Easy algorithm to think about. Exploits the factorization properties of the joint probability distribution. No difficult choices to be made to
Modeling conditional distributions with mixture models: Applications in finance and financial decision-making
 Modeling conditional distributions with mixture models: Applications in finance and financial decision-making John Geweke University of Iowa, USA Journal of Applied Econometrics Invited Lecture Università
Bayesian Learning. HT2015: SC4 Statistical Data Mining and Machine Learning. Maximum Likelihood Principle. The Bayesian Learning Framework
 HT5: SC4 Statistical Data Mining and Machine Learning Dino Sejdinovic Department of Statistics Oxford http://www.stats.ox.ac.uk/~sejdinov/sdmml.html Maximum Likelihood Principle A generative model for
ARIC Manuscript Proposal # PC Reviewed: _9/_25_/06 Status: A Priority: _2 SC Reviewed: _9/_25_/06 Status: A Priority: _2
 ARIC Manuscript Proposal # 1186 PC Reviewed: _9/_25_/06 Status: A Priority: _2 SC Reviewed: _9/_25_/06 Status: A Priority: _2 1.a. Full Title: Comparing Methods of Incorporating Spatial Correlation in
Bayesian dynamic modeling for large space-time weather datasets using Gaussian predictive processes
 Bayesian dynamic modeling for large space-time weather datasets using Gaussian predictive processes Andrew O. Finley Department of Forestry & Department of Geography, Michigan State University, Lansing
Statistical Models for Monitoring and Regulating Ground-level Ozone. Abstract
 Statistical Models for Monitoring and Regulating Ground-level Ozone Eric Gilleland 1 and Douglas Nychka 2 Abstract The application of statistical techniques to environmental problems often involves a tradeoff
Bayesian Inference on Joint Mixture Models for Survival-Longitudinal Data with Multiple Features. Yangxin Huang
 Bayesian Inference on Joint Mixture Models for Survival-Longitudinal Data with Multiple Features Yangxin Huang Department of Epidemiology and Biostatistics, COPH, USF, Tampa, FL yhuang@health.usf.edu January
Default Priors and Efficient Posterior Computation in Bayesian Factor Analysis
 Default Priors and Efficient Posterior Computation in Bayesian Factor Analysis Joyee Ghosh Institute of Statistics and Decision Sciences, Duke University Box 90251, Durham, NC 27708 joyee@stat.duke.edu