Existing road transport network of the National Capital Region was examined for the existing connectivity, mobility and accessibility in the study.
|
|
|
- Ariel Bradley
- 6 years ago
- Views:
Transcription
1 2 Road Network 2.1 Existing Road Network The existing transport network in National Capital Region is radial in nature. It comprises of expressways, national highways, state highways, major district and other district roads. The road network is being developed and maintained by NHAI, PWD, MCD, NDMC, Delhi Cantonment Board and DDA. Five National Highways (NH-1, 2, 8, 10 & 24) converge on Ring Road of Delhi and one National Highway (NH-58) meets NH-24 at Ghaziabad. In addition, NH-71, 71-A, 71-B, NH-91 and NH-119 also pass through the region. Apart from these national highways, some state highways also serve in strengthening the regional road network. Other than these highways, MDRs and ODRs also act as important linkages among these highways. Existing road transport network of the National Capital Region was examined for the existing connectivity, mobility and accessibility in the study. Mobility-based measurement and accessibility-based measurement are two significant approaches of measuring the transportation system performances. Mobility refers to the movement of people or goods while accessibility refers to the ability to reach opportunities like desired goods, services, activities and destinations. Accordingly, Road Network Analysis has been carried out and elaborated in subsequent paras. 2.2 Network form and spread Network form and spread has been analysed in four parts in the Study as stated below: a. Road Density b. Accessibility c. Mobility d. Connectivity (Graph Theory) a. Road Density The region and sub-region wise road density 1 in the NCR is presented in Table 2.1. Sub-region NCR Area (Sq. Kms) Table 2.1: Sub-Region Wise Road Density in NCR Km per Km per Km per Length of Length 100 sq. 100 sq. 100 sq. NH of SH km of km of km of (Km) (Km) Total Length (Km) Length of MDR (Km) Km Per 100 sq. km of Haryana* UP* Rajasthan* Total Note: 1) Excludes NCTD 2) Does not includes ODRs & VRs. Source: * Study on Integrated Transportation Plan for NCR, CES primary survey 2007 Road densities of NCR when compared with the national level shows that density of National Highways (2.84) and State Highways (9.72) in NCR is higher than the density of National Highways (1.99) and State Highways (4.19) in India. But in case of MDR, road density of NCR (3.95) is much 1 Road Density is given as length of roads per unit of land. A high road density indicates that major share of the population has some access to the road network. 4
2 less as compared to that in India (14.23). Table 2.2 presents a comparative picture of the road densities by category. Road Type Table 2.2: Comparison of Road Density by NH, SH and MDRs India Road Length (kms) Density (Km per 100 sq. km) NCR Road Length (kms) Density (Km per 100 sq. km) NH * 3.64 SH MDR Total * Includes the NH length in NCTD, Source: Study on Integrated Transportation Plan for NCR b. Accessibility Accessibility 2 measure is unit-free and has no intrinsic meaning, it provides an indication of the level of accessibility of employment / jobs for each zone; with jobs weighted more heavily the closer they are (in terms of travel time) to the zone. Accessibility Index Relative Index NCT Delhi Rural Zones All Urban All Urban excluding NCT including NCT Delhi Delhi,NCT Delhi All Zones Zonal Stratification Source: Study on Integrated Transportation Plan for NCR Figure 2.1: Accessibility Index (by Employment) Figure 2.1 presents the accessibility with respect to employment in a particular zone. It indicates that NCT Delhi has the highest accessibility of jobs in the region followed by. Rural indicate poor accessibility in the region. In Figure 2.2, an overall weighted accessibility score for a set of is calculated by considering population in addition to employment facility in that zone. The accessibility index calculated for all is given in Annexure 2.1. Weighted by population, indicates the highest accessibility, followed by all urban and NCT Delhi. Again rural indicate the poor accessibility in the region. 2 Accessibility is defined for personal travel as the ability to reach desired destinations. The accessibility measure selected is a gravity-modal-based measure known as the Hansen Modal. The accessibility measures are calculated for TAZ (traffic analysis zone). 5
3 Overall weighted Accessibiliy Index (by population) Relative Index NCT Delhi Rural All Urban excluding NCT Delhi All Urban including NCT Delhi,NCT Delhi All Zones Zonal Stratification Source: Study on Integrated Transportation Plan for NCR Figure 2.2: Weighted Accessibility Index (by population) c. Mobility Mobility Index 3 4 (MI) details presented in Annexure 2.2 gives the percentage distribution of MI from each zone to all other in the base scenario. Overall results show very low level of mobility throughout the NCR. 7.0 Average Mobility Index for Traffic Zones Average MI Zone numbers Source: Study on Integrated Transportation Plan for NCR Figure 2.3: Average Mobility Index for Traffic Zones A mobility index below 1.5 can be considered as good inter regional connectivity. In order to assess the overall mobility of a traffic zone in NCR, the MI from each traffic zone to all other traffic is averaged and presented in Figure 2.3. In NCR, average MI is greater than or equal to 1.9 for 100 percent of the traffic thereby indicating requirement for better connectivity throughout the region. 3 Mobility Index is a measure of the efficiency of the network. It is defined as the ratio of travel time (speed determined by the condition) by the physical route between an origin and destination and the travel time by the airline distance at desired speed. An ideal network is one which provides the most direct route between an origin and destination at the desired speed. 4 Network Analysis, Final Report, June 2003 prepared by Sheladia Associates, Inc.USA for Ethiopian Roads Authority. 6
4 d. Connectivity Graph Theory approach can be used to compare and evaluate various transport network options available and to select the best option. This approach can also be used to check the connectivity and accessibility level of different transport networks. Some of the significant interpretations that were concluded from the graph theory analysis are stated below: Beta index of 2.86 indicates that existing network of NCR is well connected Alpha Index of 32.6 indicates that the network is highly connected Index value of 82.7 indicates good degree of connectivity Cyclomatic number of 883 indicates that there is redundancy in the network system. 2.3 Road Network Inventory The Road Inventory Survey of the whole road network system in the NCR was carried out to assess the physical characteristics and conditions of the existing major roads in NCR and to asses the scope of potential capacity for future expansion. The existing road network for all constituent states, i.e. NCTD, States of Haryana, Uttar Pradesh and Rajasthan as shown in Map 2.1 was characterized by the design elements like Right of Way, Carriageway Width, Type of Road Surface, Presence of Service Roads, Pavement Condition, Road Side Drainage Facilities and Road Side Furniture like signage, road markings, etc. The above design characteristics for road side links in NCR were analyzed for assessing the Volume/ Capacity Ratio and for pavement condition so as to assess the need for capacity augmentation and upgradation of existing roads to meet the traffic intensity and travel demand of traffic on the basis of analysis of inventory data, salient characteristics of major roads is presented in Annexure Volume / Capacity Ratio The Volume / Capacity Ratio assessed by road links and length is presented in Table 2.3 below: 2.5 Pavement Condition Table 2.3: Distribution of Road Length by V/C Ratio V/C Road Links %Age Road Length %Age > Total Source: Study on Integrated Transportation Plan for NCR, CES primary survey 2007 Further, the condition of the pavement was analyzed by sufficiency rating using Paser Condition Rating Criteria which is described below: Pavement Condition No deficiencies such as rutting, corrugation, raveling, potholes, transverse cracks, alligator : 10 cracks, longitudinal cracks, etc. Total failure : 0 Paser Rating Good : 8,9 or 10 7
5 Pavement Condition Paser Rating Fair : 5,6 or 7 Poor : 1,2,3,4 Based on this Paser Rating, all links are classified for maintenance needs. If Paser Rating is good, then it means routine maintenance would suffice, if the rating is fair, then the road needs preventive maintenance and if the road rating is poor, then the road would need rehabilitation of existing pavement. The distribution of road length by pavement condition for NCR sub-regions is presented in Table 2.4 below: Table 2.4: Distribution of Road Length by Type of Pavement Condition Pavement Road Length (Km) %Age Road Length Condition Rajasthan U.P. Haryana Total Rajasthan U.P. Haryana Total Good Fair Poor Total Source: Study on Integrated Transportation Plan for NCR, CES primary survey Road Network Analysis - Inferences and Recommendations It was observed in the Study that the safety provisions on the highways do not match with the international standards. The road network is inadequate both in quantity and quality and therefore appropriate measures should be taken to improve the riding quality and the capacity of existing roads to meet the travel demand of goods and passenger traffic. The study proposed following improvements of road network in NCR: a. All the road-side encroachments must be cleared to enhance the capacity of the existing corridors b. The riding quality of the existing pavements must be improved to effect fuel savings and riding comfort c. Dedicated facilities must be provided for pedestrians, cyclists, and other non-motorized vehicles d. Exclusive bus lanes should be provided and other mass transport modes such as RRT System, LRT System, Metro and Mono-rails should be encouraged throughout NCR to meet inter-regional and intra-regional transport demand. e. The alternative parallel routes must be explored to divert the traffic from the congested corridors f. The construction of missing links, bridges, flyovers, underpasses, bypasses must be taken up on priority to improve the safety and efficiency of traffic to an acceptable level of service. 8
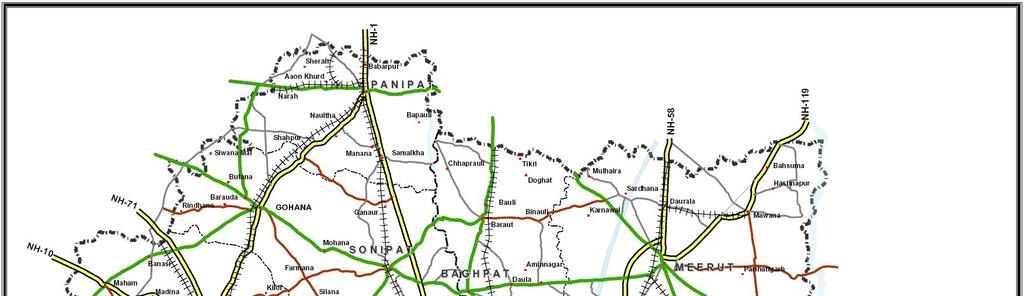
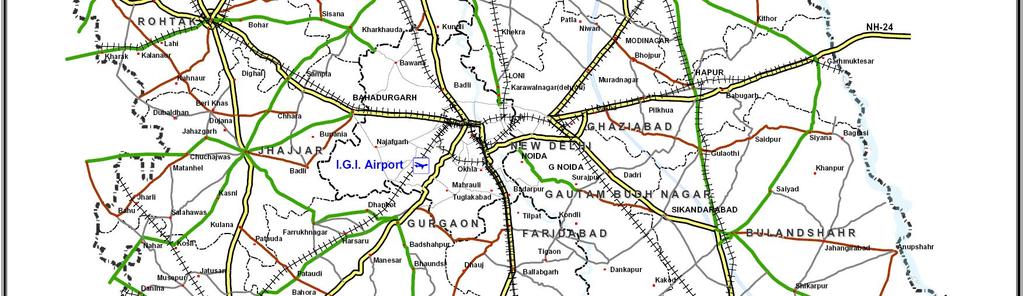
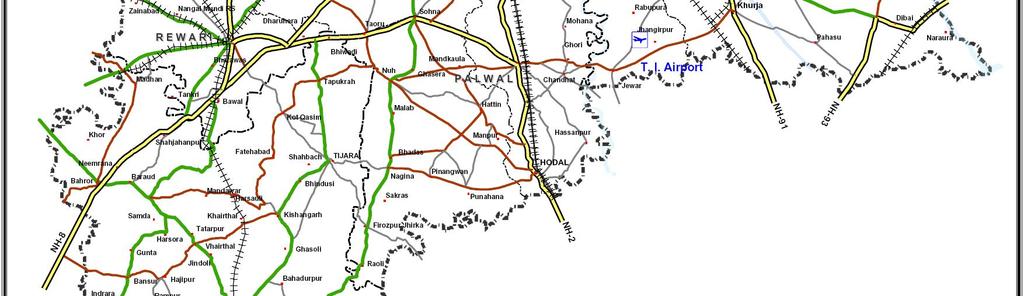
6 Map 2.1 9
Traffic Demand Forecast
 Chapter 5 Traffic Demand Forecast One of the important objectives of traffic demand forecast in a transportation master plan study is to examine the concepts and policies in proposed plans by numerically
ROAD INFORMATION SYSTEM FOR MAINTENANCE MANAGEMENT OF ROAD INFRASTRUCTURE PROJECTS
 ROAD INFORMATION SYSTEM FOR MAINTENANCE MANAGEMENT OF ROAD INFRASTRUCTURE PROJECTS Need for GIS Voluminous/ Manual Data Vs Digital Need for GIS CE - C&B (North) KPWD Secretary Office CE - C&B (South) Dispersed
Mapping Accessibility Over Time
 Journal of Maps, 2006, 76-87 Mapping Accessibility Over Time AHMED EL-GENEIDY and DAVID LEVINSON University of Minnesota, 500 Pillsbury Drive S.E., Minneapolis, MN 55455, USA; geneidy@umn.edu (Received
I. M. Schoeman North West University, South Africa. Abstract
 Urban Transport XX 607 Land use and transportation integration within the greater area of the North West University (Potchefstroom Campus), South Africa: problems, prospects and solutions I. M. Schoeman
Figure 8.2a Variation of suburban character, transit access and pedestrian accessibility by TAZ label in the study area
 Figure 8.2a Variation of suburban character, transit access and pedestrian accessibility by TAZ label in the study area Figure 8.2b Variation of suburban character, commercial residential balance and mix
DELINEATION OF NATIONAL CAPITAL REGION
 AIM To analyze the given article and understand the concept of regional delineation and its relation with planning techniques. GAURAB DAS MAHAPATRA 2015MURP010 DELINEATION OF NATIONAL CAPITAL REGION MPLN0107
Metrolinx Transit Accessibility/Connectivity Toolkit
 Metrolinx Transit Accessibility/Connectivity Toolkit Christopher Livett, MSc Transportation Planning Analyst Research and Planning Analytics Tweet about this presentation #TransitGIS OUTLINE 1. Who is
URBAN TRANSPORTATION SYSTEM (ASSIGNMENT)
") BRANCH : CIVIL ENGINEERING SEMESTER : 6th Assignment-1 CHAPTER-1 URBANIZATION 1. What is Urbanization? Explain by drawing Urbanization cycle. 2. What is urban agglomeration? 3. Explain Urban Class Groups.
BRANCH : CIVIL ENGINEERING SEMESTER : 6th Assignment-1 CHAPTER-1 URBANIZATION 1. What is Urbanization? Explain by drawing Urbanization cycle. 2. What is urban agglomeration? 3. Explain Urban Class Groups.
A Simplified Travel Demand Modeling Framework: in the Context of a Developing Country City
 A Simplified Travel Demand Modeling Framework: in the Context of a Developing Country City Samiul Hasan Ph.D. student, Department of Civil and Environmental Engineering, Massachusetts Institute of Technology,
Puerto Rico Transportation Asset Management Plan
 Puerto Rico Transportation Asset Management Plan PR-TAMP April 12, 2018 April 12, 2018 The Project Team Gordon Proctor Shobna Varma Jose Carro, P.E. Zaida Rico, P.E., Ph.D. gordon@proctorassociates.com
CIV3703 Transport Engineering. Module 2 Transport Modelling
 CIV3703 Transport Engineering Module Transport Modelling Objectives Upon successful completion of this module you should be able to: carry out trip generation calculations using linear regression and category
East Bay BRT. Planning for Bus Rapid Transit
 East Bay BRT Planning for Bus Rapid Transit Regional Vision Draper Prison The Bottleneck is a State-Level issue, Salt Lake County 2050 Population: 1.5M Draper Prison hopefully with some State-Level funding!
HORIZON 2030: Land Use & Transportation November 2005
 PROJECTS Land Use An important component of the Horizon transportation planning process involved reviewing the area s comprehensive land use plans to ensure consistency between them and the longrange transportation
ECONOMIC AND FINANCIAL ANALYSIS
 Road Rehabilitation Project (RRP KIR 44281) ECONOMIC AND FINANCIAL ANALYSIS 1. Base and project alternatives. The base case against which changes in road provider and road user costs are compared for the
Development of modal split modeling for Chennai
 IJMTES International Journal of Modern Trends in Engineering and Science ISSN: 8- Development of modal split modeling for Chennai Mr.S.Loganayagan Dr.G.Umadevi (Department of Civil Engineering, Bannari
King City URA 6D Concept Plan
 King City URA 6D Concept Plan King City s Evolution Among the fastest growing cities 2000 Census 1,949 2010 Census 3,111 60% increase 2016 Census estimate 3,817 23% increase Average annual rate 4.3% Surpassing
Typical information required from the data collection can be grouped into four categories, enumerated as below.
 Chapter 6 Data Collection 6.1 Overview The four-stage modeling, an important tool for forecasting future demand and performance of a transportation system, was developed for evaluating large-scale infrastructure
HPMS Rule on Collecting Pavement Condition Data. Roger Smith Sui Tan
 HPMS Rule on Collecting Pavement Condition Data Roger Smith Sui Tan Final Rule Issued January Affects Local agencies that have non-state NHS roads/ street For which you report HPMS data to Caltrans 2 Final
Data Collection. Lecture Notes in Transportation Systems Engineering. Prof. Tom V. Mathew. 1 Overview 1
 Data Collection Lecture Notes in Transportation Systems Engineering Prof. Tom V. Mathew Contents 1 Overview 1 2 Survey design 2 2.1 Information needed................................. 2 2.2 Study area.....................................
III. FORECASTED GROWTH
 III. FORECASTED GROWTH In order to properly identify potential improvement projects that will be required for the transportation system in Milliken, it is important to first understand the nature and volume
Presented By: Bikram Kumar Dutta and Sanhita Bandyopadhyay
 Presented By: Bikram Kumar Dutta and Sanhita Bandyopadhyay INTRODUTION NEED OF STUDY DAWN OF CITY SPATIO-TEMPORAL TEMPORAL GROWTH OF DELHI CITY GROWTH WITH DIFFERENT MASTER PLANS PULL AND PUSH FACTOR FOR
APPENDIX IV MODELLING
 APPENDIX IV MODELLING Kingston Transportation Master Plan Final Report, July 2004 Appendix IV: Modelling i TABLE OF CONTENTS Page 1.0 INTRODUCTION... 1 2.0 OBJECTIVE... 1 3.0 URBAN TRANSPORTATION MODELLING
3.0 ANALYSIS OF FUTURE TRANSPORTATION NEEDS
 3.0 ANALYSIS OF FUTURE TRANSPORTATION NEEDS In order to better determine future roadway expansion and connectivity needs, future population growth and land development patterns were analyzed as part of
California Urban Infill Trip Generation Study. Jim Daisa, P.E.
 California Urban Infill Trip Generation Study Jim Daisa, P.E. What We Did in the Study Develop trip generation rates for land uses in urban areas of California Establish a California urban land use trip
About the Author: Abstract: Contact No:
 TRANSPORTATION NETWORK MODEL AND NETWORK ANALYSIS OF ROAD NETWORKS Aman Arora 1, Manish Kumar Pandey 2 Geographical Analyst, Lepton Software Export & Research Private Limited, Gurgaon, Haryana, India.
The trends and patterns of urbanization in the NCT of Delhi during
 International Journal of Interdisciplinary and Multidisciplinary Studies (IJIMS), 2015, Vol 2, No.4, 27-39. 27 Available online at http://www.ijims.com ISSN: 2348 0343 The trends and patterns of urbanization
ECONOMIC AND FINANCIAL ANALYSIS
 Additional Financing of Road Rehabilitation Project (RRP KIR 44281-014) ECONOMIC AND FINANCIAL ANALYSIS 1. Base and project scenarios. Without urgent rehabilitation works, it is expected that sections
Regional Snapshot Series: Transportation and Transit. Commuting and Places of Work in the Fraser Valley Regional District
 Regional Snapshot Series: Transportation and Transit Commuting and Places of Work in the Fraser Valley Regional District TABLE OF CONTENTS Complete Communities Daily Trips Live/Work Ratio Commuting Local
3. THE TRANSPORTATION AND TRANSIT MASTER PLAN
 The Master Plan Report Page 3-1 3. THE TRANSPORTATION AND TRANSIT MASTER PLAN 3.1 The Strategy Through the technical and consultation processes "A Balanced Road and Transit System" has been defined as
The World Bank China Wuhan Second Urban Transport (P112838)
") EAST ASIA AND PACIFIC China Transport Global Practice IBRD/IDA Specific Investment Loan FY 2010 Seq No: 7 ARCHIVED on 28-Jun-2015 ISR18605 Implementing Agencies: Wuhan Urban Construction Utilization of
EAST ASIA AND PACIFIC China Transport Global Practice IBRD/IDA Specific Investment Loan FY 2010 Seq No: 7 ARCHIVED on 28-Jun-2015 ISR18605 Implementing Agencies: Wuhan Urban Construction Utilization of
Assessing the Employment Agglomeration and Social Accessibility Impacts of High Speed Rail in Eastern Australia: Sydney-Canberra-Melbourne Corridor
 Assessing the Employment Agglomeration and Social Accessibility Impacts of High Speed Rail in Eastern Australia: Sydney-Canberra-Melbourne Corridor Professor David A. Hensher FASSA Founding Director Institute
Changes in the Spatial Distribution of Mobile Source Emissions due to the Interactions between Land-use and Regional Transportation Systems
 Changes in the Spatial Distribution of Mobile Source Emissions due to the Interactions between Land-use and Regional Transportation Systems A Framework for Analysis Urban Transportation Center University
Road Network Impedance Factor Modelling Based on Slope and Curvature of the Road
 Cloud Publications International Journal of Advanced Remote Sensing and GIS 2017, Volume 6, Issue 1, pp. 2274-2280 ISSN 2320 0243, Crossref: 10.23953/cloud.ijarsg.289 Methodology Article Road Network Impedance
StanCOG Transportation Model Program. General Summary
 StanCOG Transportation Model Program Adopted By the StanCOG Policy Board March 17, 2010 What are Transportation Models? General Summary Transportation Models are technical planning and decision support
Transit Time Shed Analyzing Accessibility to Employment and Services
 Transit Time Shed Analyzing Accessibility to Employment and Services presented by Ammar Naji, Liz Thompson and Abdulnaser Arafat Shimberg Center for Housing Studies at the University of Florida www.shimberg.ufl.edu
Note on Transportation and Urban Spatial Structure
 Note on Transportation and Urban Spatial Structure 1 By Alain Bertaud, Washington, ABCDE conference, April 2002 Email: duatreb@msn.com Web site: http://alain-bertaud.com/ http://alainbertaud.com/ The physical
Area Classification of Surrounding Parking Facility Based on Land Use Functionality
 Open Journal of Applied Sciences, 0,, 80-85 Published Online July 0 in SciRes. http://www.scirp.org/journal/ojapps http://dx.doi.org/0.4/ojapps.0.709 Area Classification of Surrounding Parking Facility
TRIP GENERATION MODEL FOR THE CORE AREA OF THIRUVANANTHAPURAM CITY
 ISSN (Online) : 2319-8753 ISSN (Print) : 2347-6710 International Journal of Innovative Research in Science, Engineering and Technology An ISO 3297: 2007 Certified Organization, Volume 2, Special Issue
Regional Performance Measures
 G Performance Measures Regional Performance Measures Introduction This appendix highlights the performance of the MTP/SCS for 2035. The performance of the Revenue Constrained network also is compared to
GIS Analysis of Crenshaw/LAX Line
 PDD 631 Geographic Information Systems for Public Policy, Planning & Development GIS Analysis of Crenshaw/LAX Line Biying Zhao 6679361256 Professor Barry Waite and Bonnie Shrewsbury May 12 th, 2015 Introduction
Where Are We and Where Do We Need to Go? A Summary of the Interstate Condition Project
 Pavement Condition Reporting and Target Setting in the TAMP Where Are We and Where Do We Need to Go? A Summary of the Interstate Condition Project July 11, 2016 Jonathan Groeger, MBA Gonzalo R. Rada, Ph.D.,
Technical Memorandum #2 Future Conditions
 Technical Memorandum #2 Future Conditions To: Dan Farnsworth Transportation Planner Fargo-Moorhead Metro Council of Governments From: Rick Gunderson, PE Josh Hinds PE, PTOE Houston Engineering, Inc. Subject:
Appendixx C Travel Demand Model Development and Forecasting Lubbock Outer Route Study June 2014
 Appendix C Travel Demand Model Development and Forecasting Lubbock Outer Route Study June 2014 CONTENTS List of Figures-... 3 List of Tables... 4 Introduction... 1 Application of the Lubbock Travel Demand
Snow and Ice Control POLICY NO. P-01/2015. CITY OF AIRDRIE Snow and Ice Control Policy
 Page 1 CITY OF AIRDRIE Snow and Ice Control Effective Date: Approved By: Approved On: March 17, 2015 City Council March 16, 2015 Revision Date: Resolution #: ------ PURPOSE: The City of Airdrie is responsible
2040 MTP and CTP Socioeconomic Data
 SE Data 6-1 24 MTP and CTP Socioeconomic Data Purpose of Socioeconomic Data The socioeconomic data (SE Data) shows the location of the population and employment, median household income and other demographic
Taming the Modeling Monster
 Taming the Modeling Monster Starring: Ellen Greenberg Scott McCarey Jim Charlier Audience Poll, part 1 Elected Officials Board Members Public Staff Consultants Journalists Other Audience Poll, part 2 Modeling
2014 UTP Public Meeting July 18, 2013
 2014 UTP Public Meeting July 18, 2013 What is the Unified Transportation Program (UTP)? 3 UTP is Updated Annually by August 31st Spring - Summer 2013 UTP 2014 UTP UTP Development Process 4 UTP Connects
South Bristol Link Forecasting Report
 South Bristol Link April 2013 Atkins 5098941 AVTM Forecasting v2 PI (Draft 120331) Draft 31 March 2012 1 Notice This document and its contents have been prepared and are intended solely for West of England
Appendix B. Traffic Analysis Report
 Appendix B Traffic Analysis Report Report No. 14369/TR/WN02 August 2007 SALLINS BYPASS BYPASS OPTIONEERING ANALYSIS - TRAFFIC REPORT Kildare County Council Áras Chill Dara, Devoy Park, Naas, Co Kildare
Estimating Transportation Demand, Part 2
 Transportation Decision-making Principles of Project Evaluation and Programming Estimating Transportation Demand, Part 2 K. C. Sinha and S. Labi Purdue University School of Civil Engineering 1 Estimating
Trip Distribution Analysis of Vadodara City
 GRD Journals Global Research and Development Journal for Engineering Recent Advances in Civil Engineering for Global Sustainability March 2016 e-issn: 2455-5703 Trip Distribution Analysis of Vadodara City
Transit Modeling Update. Trip Distribution Review and Recommended Model Development Guidance
 Transit Modeling Update Trip Distribution Review and Recommended Model Development Guidance Contents 1 Introduction... 2 2 FSUTMS Trip Distribution Review... 2 3 Proposed Trip Distribution Approach...
GEOSYNTHETICS ENGINEERING: IN THEORY AND PRACTICE
 GEOSYNTHETICS ENGINEERING: IN THEORY AND PRACTICE Prof. J. N. Mandal Department of civil engineering, IIT Bombay, Powai, Mumbai 400076, India. Tel.022-25767328 email: cejnm@civil.iitb.ac.in Module-5 LECTURE-
Program- Traffic decongestion and fluidization in Satu Mare municipality
 Program- Traffic decongestion and fluidization in Satu Mare municipality Portfolio: Mayor Dr. Coica Costel Dorel Description of the program Decongestion and fluidization of traffic in Satu Mare municipality
Rural Road Network Planning by using GIS Methodology
 Rural Road Network Planning by using GIS Methodology Javedali M Jalegar a a Assistance Professor, Department of Civil Engineering AVNIET, Ibrahimpatnam, Hyderabad, Ch. Shaheen Begum b b Post Graduate Student,
Forecasts from the Strategy Planning Model
 Forecasts from the Strategy Planning Model Appendix A A12.1 As reported in Chapter 4, we used the Greater Manchester Strategy Planning Model (SPM) to test our long-term transport strategy. A12.2 The origins
A/Prof. Mark Zuidgeest ACCESSIBILITY EFFECTS OF RELOCATION AND HOUSING PROJECT FOR THE URBAN POOR IN AHMEDABAD, INDIA
 A/Prof. Mark Zuidgeest ACCESSIBILITY EFFECTS OF RELOCATION AND HOUSING PROJECT FOR THE URBAN POOR IN AHMEDABAD, INDIA South African Cities Network/University of Pretoria, 09 April 2018 MOBILITY Ability
Transport Planning in Large Scale Housing Developments. David Knight
 Transport Planning in Large Scale Housing Developments David Knight Large Scale Housing Developments No longer creating great urban spaces in the UK (Hall 2014) Transport Planning Transport planning processes
6 th Line Municipal Class Environmental Assessment
 6 th Line Municipal Class Environmental Assessment County Road 27 to St John s Road Town of Innisfil, ON September 6, 2016 APPENDIX L: TRAVEL DEMAND FORECASTING MEMORANDUM Accessible formats are available
CREATING LIVEABLE & SAFE CITIES FOR ALL
 CREATING LIVEABLE & SAFE CITIES FOR ALL Taking Transit to people s door steps PRERNA V. MEHTA, MANAGER, WRI INDIA RAJEEV G. MALAGI, SR. PROJECT ASSOCIATE, WRI INDIA A product of WRI Ross Center for Sustainable
The CRP stresses a number of factors that point to both our changing demographics and our future opportunities with recommendations for:
 Plan Overview The CRP represents the first broad planning initiative covering Lake, Porter and LaPorte counties. Unlike previous plans released by NIRPC, which focused primarily on transportation, the
transportation research in policy making for addressing mobility problems, infrastructure and functionality issues in urban areas. This study explored
 ABSTRACT: Demand supply system are the three core clusters of transportation research in policy making for addressing mobility problems, infrastructure and functionality issues in urban areas. This study
Accessibility as an Instrument in Planning Practice. Derek Halden DHC 2 Dean Path, Edinburgh EH4 3BA
 Accessibility as an Instrument in Planning Practice Derek Halden DHC 2 Dean Path, Edinburgh EH4 3BA derek.halden@dhc1.co.uk www.dhc1.co.uk Theory to practice a starting point Shared goals for access to
NORTH HOUSTON HIGHWAY IMPROVEMENT PROJECT (NHHIP)
") NORTH HOUSTON HIGHWAY IMPROVEMENT PROJECT (NHHIP) Project Overview Briefing Packet September 2015 RECOMMENDED ALTERNATIVES Environmental Impact Statement (EIS) Project Divided into 3 Segments Segment 1:
NORTH HOUSTON HIGHWAY IMPROVEMENT PROJECT (NHHIP) Project Overview Briefing Packet September 2015 RECOMMENDED ALTERNATIVES Environmental Impact Statement (EIS) Project Divided into 3 Segments Segment 1:
Committee Meeting November 6, 2018
 Committee Meeting November 6, 2018 Agenda Where we are in the process Land Use Plan Transportation Element Housing & Neighborhoods Elements Next Steps Schedule November 6: Plan Elements December: Plan
03 August 2016 l Public Meeting LONG-RANGE VISIONING STUDY
 03 August 2016 l Public Meeting LONG-RANGE VISIONING STUDY 1 2 3 ESTABLISH OUTLINE THE ADDRESS PLAN TO PROBLEM SOLUTIONS IMPLEMENT 02 Aug 2016 ASSESSMENT STUDY + LONG-RANGE VISIONING GCPS FACILITIES ASSESSMENT
Regional Performance Measures
 G Performance Measures Regional Performance Measures Introduction This appendix highlights the performance of the MTP/SCS for 2035. The performance of the Revenue Constrained network also is compared to
Department of Transportation and Public Works Customer Satisfaction Survey Provincial Highway System. Highlights Report
 Department of Transportation and Public Works )))))))))))))))))))))))))))) Provincial Highway System Highlights Report The - Provincial Highway System was conducted by the Marketing Research Centre for
NORTH HOUSTON HIGHWAY IMPROVEMENT PROJECT (NHHIP)
") NORTH HOUSTON HIGHWAY IMPROVEMENT PROJECT (NHHIP) Planning for a Mega Project in a Metropolitan Area TxDOT Short Course October 13, 2015 RECOMMENDED ALTERNATIVES Environmental Impact Statement (EIS) Project
NORTH HOUSTON HIGHWAY IMPROVEMENT PROJECT (NHHIP) Planning for a Mega Project in a Metropolitan Area TxDOT Short Course October 13, 2015 RECOMMENDED ALTERNATIVES Environmental Impact Statement (EIS) Project
Estimation of Travel demand from the city commuter region of Muvattupuzha municipal area Mini.M.I 1 Dr.Soosan George.T 2 Rema Devi.M.
 Estimation of Travel demand from the city commuter region of Muvattupuzha municipal area Mini.M.I 1 Dr.Soosan George.T 2 Rema Devi.M. 3 Professor, Department of Civil Engg., M.A.College of Engg, Kothamangalam,
CVS Derwood. Local Area Transportation Review
 CVS Derwood Montgomery County, Maryland May 27, 2016 Local Area Transportation Review Prepared for: JC Bar Properties, Inc. Steve Fleming, PE 415 Fallowfield Road, Suite 301 Camp Hill, Pennsylvania 17011
Commuter s Modal Choice: A Case Study of Savar Pourashava
 Journal of Bangladesh Institute of Planners ISSN 2075-9363 Vol. 2, December 2009, pp. 78-97, Bangladesh Institute of Planners Commuter s Modal Choice: A Case Study of Savar Pourashava Md. Lutfur Rahman
Hillsborough County MPO Transit Study. Technical Team August 23, 2007
 Hillsborough County MPO Transit Study Technical Team August 23, 2007 Meeting Agenda Technology Choices Needs and Opportunities Transit Concepts Comparative Land Use Analysis Measures of Effectiveness System
ACCESSIBILITY OF INTERMODAL CENTERS STUDY
 ACCESSIBILITY OF INTERMODAL CENTERS STUDY Presentation for VDOT Forum - Coordinating Transportation Planning and Land Use Wednesday, April 2, 2014 Vlad Gavrilovic, AICP - Renaissance Planning Group Tasks
Traffic Generation Model For Delhi Urban Area Using Artificial Neural Network
 BIJIT - BVICAM s International Journal of Information Technology Bharati Vidyapeeth s Institute of Computer Applications and Management (BVICAM), New Delhi Traffic Generation Model For Delhi Urban Area
Behavioural Analysis of Out Going Trip Makers of Sabarkantha Region, Gujarat, India
 Behavioural Analysis of Out Going Trip Makers of Sabarkantha Region, Gujarat, India C. P. Prajapati M.E.Student Civil Engineering Department Tatva Institute of Technological Studies Modasa, Gujarat, India
The Sunland Park flyover ramp is set to close the week of March 19 until early summer
 March 2, 2018 The Sunland Park flyover ramp is set to close the week of March 19 until early summer GO 10 is targeting the week of March 19 to close the Sunland Park Drive flyover entrance ramp to I 10
2. Evaluation of Pavement Condition Index (PCI)
") Journal of Engineering Sciences, Assiut University, Vol. 41 No1 pp. - January 2013 DETERIORATION OF EGYPTIAN DESERT ROADS IN AL-MINEA DISTRICT Afaf Mahmoud 1, Hassan Y. Ahmed 2, Ayman M. Othman 3 1 Civil
Journal of Engineering Sciences, Assiut University, Vol. 41 No1 pp. - January 2013 DETERIORATION OF EGYPTIAN DESERT ROADS IN AL-MINEA DISTRICT Afaf Mahmoud 1, Hassan Y. Ahmed 2, Ayman M. Othman 3 1 Civil
STILLORGAN QBC LEVEL OF SERVICE ANALYSIS
 4-5th September, STILLORGAN QBC LEVEL OF SERVICE ANALYSIS Mr David O Connor Lecturer Dublin Institute of Technology Mr Philip Kavanagh Graduate Planner Dublin Institute of Technology Abstract Previous
March 31, diversity. density. 4 D Model Development. submitted to: design. submitted by: destination
 March 31, 2010 diversity density 4 D Model Development submitted to: design submitted by: destination 4 D Model Development Team SANDAG: Mike Calandra Rick Curry Rob Rundle Parsons Brinckerhoff: Bill Davidson
TRAFFIC FORECAST METHODOLOGY
 CHAPTER 5 TRAFFIC FORECAST METHODOLOGY Introduction Need for County-Level Traffic Forecasting 2030 HC-TSP Model Methodology Model Calibration Future Traffic Forecasts Hennepin County Transportation Systems
Mapping a Nation in 3D Singapore s Journey. Bryan Chew Registrar of Titles Assistant Chief Executive Singapore Land Authority
 Mapping a Nation in 3D Singapore s Journey Bryan Chew Registrar of Titles Assistant Chief Executive Singapore Land Authority Singapore Size - 719 sq km Population - 5.5 million Density 7,600/sq km Singapore
Emergency Traffic Management In the Case of Severe Winter Conditioins
 Emergency Traffic Management In the Case of Severe Winter Conditioins Presentation on the Project Workshop Organizing Emergency Management Strategies for the Transport Sector with the Use of innovative
The ATU Decision Support System (DSS)
") The ATU Decision Support System (DSS) The ATU Decision Support System (DSS) A decision support system to proactively manage streetworks Streetworks Issues Street works are second highest concern of residents
The ATU Decision Support System (DSS) The ATU Decision Support System (DSS) A decision support system to proactively manage streetworks Streetworks Issues Street works are second highest concern of residents
Simulating Mobility in Cities: A System Dynamics Approach to Explore Feedback Structures in Transportation Modelling
 Simulating Mobility in Cities: A System Dynamics Approach to Explore Feedback Structures in Transportation Modelling Dipl.-Ing. Alexander Moser [amoser@student.tugraz.at] IVT Tagung 2013 - Kloster Kappel
Public Open House Meeting Thursday, February 22, Broken Arrow to Tulsa Mass Transit Feasibility Study
 Public Open House Meeting Thursday, February 22, 2007 Broken Arrow to Tulsa Mass Transit Feasibility Study Meeting Agenda Welcome Where we Are What we ve Learned Corridor Study Map Stations (Commuter Rail
Foreword. Vision and Strategy
 GREATER MANCHESTER SPATIAL FRAMEWORK Friends of Walkden Station Consultation Response January 2017 Foreword Friends of Walkden Station are a group of dedicated volunteers seeking to raise the status and
1 Summary Monetary Component Public Purpose Land Provision Introduction Document Structure...
 1 Summary... 1 1.1 Monetary Component... 1 1.2 Public Purpose Land Provision... 1 2 Introduction... 5 2.1 Document Structure... 5 2.2 Planning & Environment Act 1987... 5 2.3 Strategic Planning & Justification...
Beyond Mobility - Understanding and comparing urban accessibility in European Cities. Guy Hitchcock, Knowledge Leader
 Beyond Mobility - Understanding and comparing urban accessibility in European Cities Guy Hitchcock, Knowledge Leader 2 Study on improving the understanding of urban accessibility and road congestion in
TRAVEL TIME RELIABILITY ON EXPRESSWAY NETWORK UNDER UNCERTAIN ENVIRONMENT OF SNOWFALL AND TRAFFIC REGULATION
 TRAVEL TIME RELIABILITY ON EXPRESSWAY NETWORK UNDER UNCERTAIN ENVIRONMENT OF SNOWFALL AND TRAFFIC REGULATION Hiroshi Wakabayashi Faculty of Urban Science, Meijo University, 4-3-3, Nijigaoka, Kani-City,
Frequently Asked Questions
 What is the Regional Transit Engagement Series? As one of the fastest growing regions in the country, there is recognition that long-term transit planning efforts should be accelerated if we are to remain
VHD Daily Totals. Population 14.5% change. VMT Daily Totals Suffolk 24-hour VMT. 49.3% change. 14.4% change VMT
 6.9 Suffolk 6-54 VMT Population and Travel Characteristics Population 14.5% change 2014 1,529,202 VHD Daily Totals 2014 251,060 49.3% change 2040 1,788,175 2040 374,850 VMT Daily Totals 2014 39,731,990
Alternatives Analysis
 Alternatives Analysis Prepared for: Metropolitan Atlanta Rapid Transit Authority Prepared by: AECOM/Jacobs-JJG Joint Venture Atlanta, GA November 2012 Page Left Intentionally Blank ii TABLE OF CONTENTS
Network Equilibrium Models: Varied and Ambitious
 Network Equilibrium Models: Varied and Ambitious Michael Florian Center for Research on Transportation University of Montreal INFORMS, November 2005 1 The applications of network equilibrium models are
Land Use and Zoning Page 1 of 10 LAND USE AND ZONING
 LAND USE AND ZONING Land Use and Zoning Page 1 of 10 BACKGROUND The Clifton-Fruitvale planning area is about 3,962 acres (6.2 sq. miles) with a population of 14,000 residents. The density of the area is
Applications of Modern Geospatial Technologies for Roads and Highways
 Applications of Modern Geospatial Technologies for Roads and Highways Theme: Advances in Construction Technology Mukesh Varma B Sr. Manager BD IIC Technologies Ltd 19 th January 2018 Our Background Established
MINNESOTA SIDE Draft TRANSPORTATION IMPROVEMENT PROGRAM
 MINNESOTA SIDE Draft TRANSPORTATION IMPROVEMENT PROGRAM 2018-2021 April, 2017 FISCAL YEARS 2018-2021 MINNESOTA SIDE Draft TRANSPORTATION IMPROVEMENT PROGRAM FOR THE GRAND FORKS - EAST GRAND FORKS METROPOLITAN
The effects of impact fees on urban form and congestion in Florida
 The effects of impact fees on urban form and congestion in Florida Principal Investigators: Andres G. Blanco Ruth Steiner Presenters: Hyungchul Chung Jeongseob Kim Urban and Regional Planning Contents
Modeling evacuation plan problems
 Chapter 7 Modeling evacuation plan problems In Section 3.1 we reviewed the recommendations that the UNESCO presented in [30] to develop volcanic emergency plans. In [18] is presented the state of art of
CERTIFIED RESOLUTION. introduction: and dated May 29, 2017, as attached, as appropriate
 15322 Buena Vista Avenue, White Rock BC, Canada V4B 1Y6 www.whiterockcity.ca City of White Rock P: 604.541.22121 F: 604.541.9348 /2tC% City Clerk s Office IT E ROC K June 13,2017 Stephanie Lam, Deputy