Chapter 3 METHODS. The primary goal of this section is to explore different methods in which populations of
|
|
|
- Tyler Lynch
- 5 years ago
- Views:
Transcription
1 Chapter 3 METHODS 3.0 Data 3.1 Overview and Goals The primary goal of this section is to explore different methods in which populations of urban spaces can be visualized in new ways at various scales. The historical growth of Chicago has created a landscape in which a system of boundaries exists that is commonly used in cartographic representations of the city. This boundary system limits the understanding into the complexity of the urban space and the micro-processes of human settlement in Chicago. Traditional choropleth and dot density techniques rely on the established boundary units and represent Chicago s population in a simplified and typically uninformative way. With experimentation in the methodological approach to the problem of urban population distribution, maps and visualizations can be made to better characterize the phenomenon of people in space. The following methods are investigated in the remainder of this chapter to construct different visualizations from the available data: 1. Section 3.2 will explore the vertical residential environment of Chicago and create a new measurement to describe the living spaces of Chicago- the measurement of personal space. 2. Section 3.3 will look at the rationale for and the methodological of comparing demographic profiles as a measure to better understand the significance of the personal space measurement.
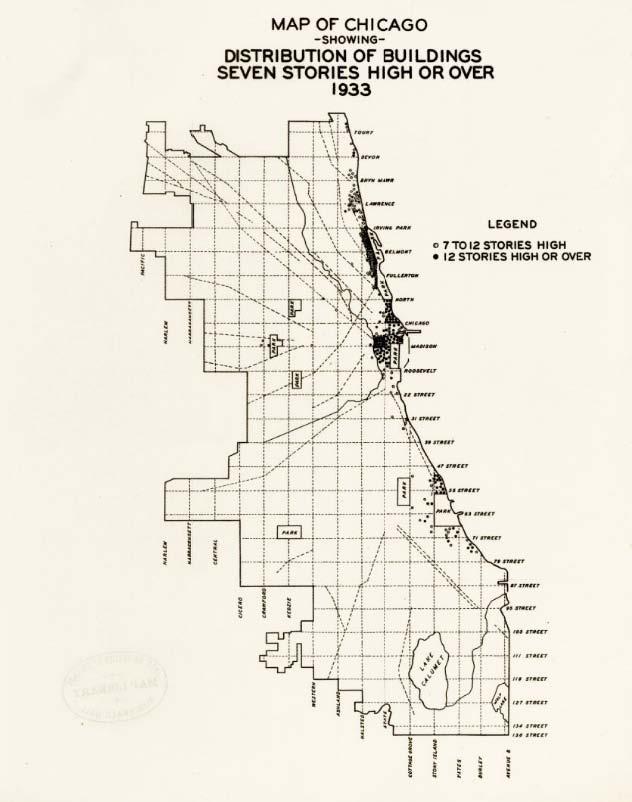
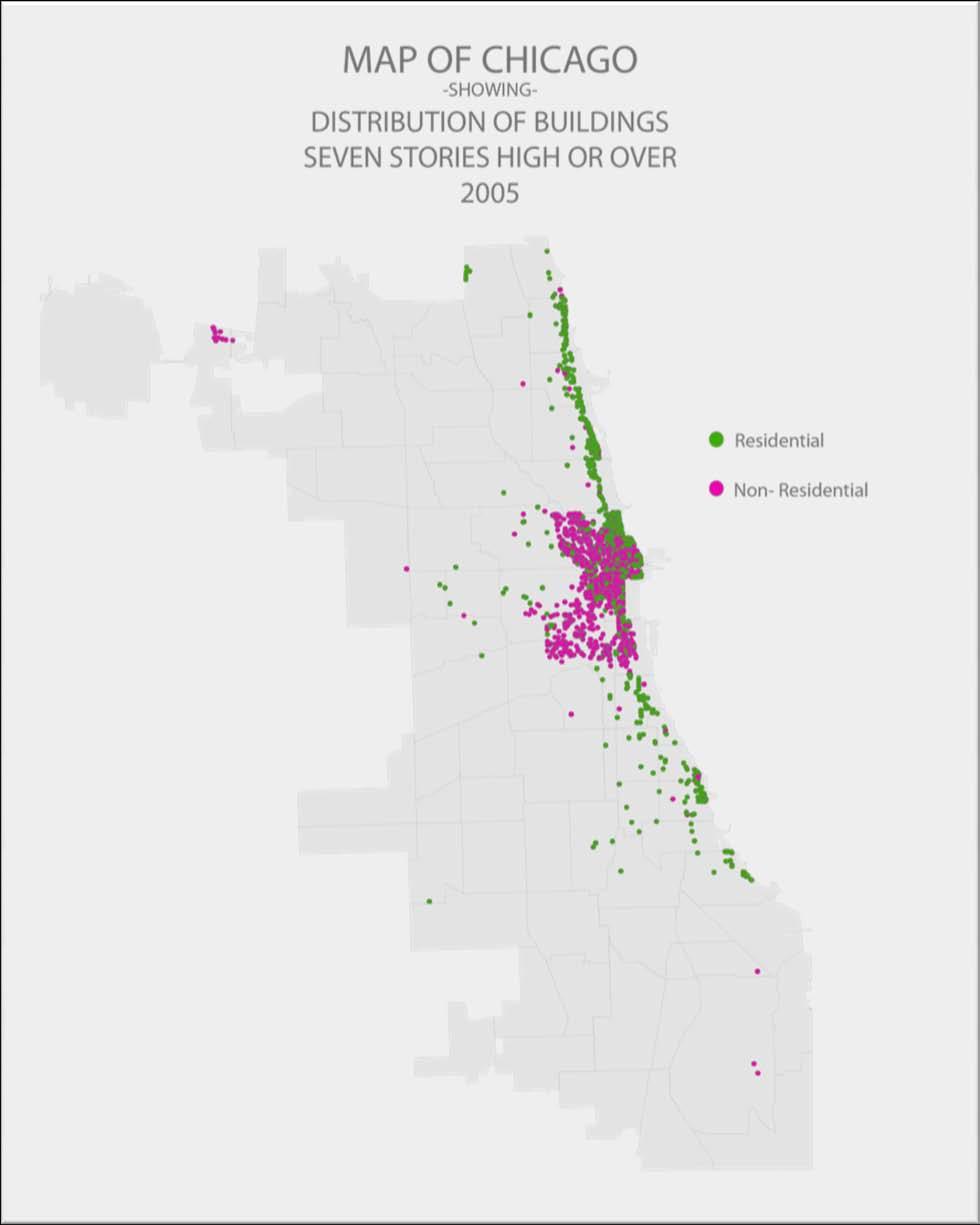
2 3. Section 3.4 will consider different exploratory spatial statistic models to describe the geographic distribution of different classifications of living space across the city of Chicago. 4. Section 3.5 will construct a method to visualize the individual person in the landscape of the urban environment. 5. Section 3.6 will investigate an alternative approach to visualize the intensity of people and spaces without the use of traditional boundary units. 3.2 Personal Space Model Vertical Space Problem The origin for the following methods is derived from the second research question of this thesis- in what ways does the vertical extent of neighborhoods obscure our understanding of spaciousness and crowdedness for urban residents. Chicago is considered the to be the birthplace of the skyscraper and boast the tallest building in the United States, the Willis Tower- a 110 story, 1454 foot structure in the Loop (Fountain, 2001). The history of skyscrapers in the redevelopment of post fire Chicago began in 1885 with the completion of the Home Insurance Building, the first steel-framed skyscraper in the world. Originally constructed with a height of 138 feet, the building was later expanded to a height of 180 feet before being demolished in Historically, Chicago has played a prominent role in the development of the skyscraper and at various times in the history of skyscraper development has boasted the world s tallest building (Daniel & Grant, 2005). Louis Sullivan, an urban designer and architect in Chicago recognized that the skyscraper would represent a new form of architecture in the post fire landscape of Chicago (Kaufman,
3 1969). Sullivan discarded conventions and designed buildings that emphasized their vertical nature before adequate technology existed to construct the design. Materials and technologies were invented in order to realize the Sullivan vision for the new urban space. This new form of architecture, with an emphasis on the vertical space, became known as the Chicago School of Design (Kaufman, 1969). Through the 20 th century, Chicago went through two distinct phases of highrise construction- a first boom, from the early 1920s to the mid-1930s, and a second boom from the early 1960s until the present. The spatial distribution of the high rise buildings are mostly concentrated in the Loop and along the Magnificent Mile in Chicago's Near North Side community area (Kaufman, 1969). There are 2,265 high-rises (over 150 feet) structures in the city of Chicago and 903, about 40%, are zoned for residential use. With the amount of vertical residential space in Chicago available, the traditional representations of spaciousness and crowdedness within the boundary units of community area or census block as characterized by population density are inadequate measurements. The measurement of population density will not account for the vertical structure of modern urban residential patterns and could confuse places of high density and places of crowded living conditions. The aim of this method is to create a new measurement which can account for the vertical spaces within buildings and reconstruct the idea of population density into one of personal space.
4
5
6 3.2.2 Model of Vertical Space The first step in the personal space model is a binary dasymetric approach is used to separate residential and non-residential structures throughout the city. This method will take the building footprints for every building in Chicago and eliminates the non-residential structures based on urban zoning codes attached to each building. The binary approach in this context deems single-family and multi-family residential structures as suitable for living and places of business, industry, and other buildings as unsuitable, filtering or masking out the areas deemed unsuitable (Maantay et al., 2007). A complication with this approach is mix use buildings where commercial and residential reside in the same structure. Structures such as these are common in the recently gentrified areas of the city, along major artillery roads, and along natural features such as parks and waterfronts (Grant, 2002). Mixed-use development is the zoning of a building or a set of buildings to have more than more than a singular purpose- not solely residential or commercial space- rather a mixture of many uses. Mix use developments are created to spatially cluster employment, housing, commercial, and recreational activities together in a centralized urban space (Duaney, 2002). Mix use buildings and New Urbanism communities are developed to help eliminate some of the strain on the local transportation network. A collection of similar mixed buildings, or a New Urban District, is preferably spatially close to a public transit node (Grant, 2002). Mix use buildings are often the result of gentrified post industrial urban areas or as part of a planned town center. In specific zoning terms, mix use development refers to some combination of residential, industrial, office, commercial, and institutional land uses (Duaney, 2002). In the mix use building pictured below, small-scale commercial uses fill the street level and residential the

7 upper two floors. This type of structure is common in the redeveloped spaces of Chicago and adds a level of uncertainty to the personal space model. Figure 10-Mix Use Building, Lincoln Park Chicago This binary dasymetric approach will begin to counteract the generalizations and arbitrary boundaries of neighborhoods and census zones by assigning only specific buildings as suitable for living. Mix use buildings, in this step, are considered as suitable for inhabitance by residents. Later in the model mix use buildings will be divided so that 40% of the space will be assigned to non residential and 60% to residential. A limitation of the binary approach is that it assumes homogenous residential space in the buildings distributed across Chicago, and the model will assign a singular value to the space. This method will only deem a building as suitable to be included in the residential density formula, and does not account for variation
8 within buildings. This variable, whether the building is suitable or unsuitable for residential, is named residential buildings. Following this, an areal interpolation approach is used to allow for the transformation of a source data set into a target data set (Mennis 2003). This method is used to aggregate population values from the different zones to the target layers. In this case, the target layer is the summation of residential floor space within the lowest level of census measurement, the census block. This method takes the data within the specified zones from the source data- population data summarized- and aggregates this into the appropriate zones of the target data set. Specifically, this method will assign the population of each census block into the buildings deemed residential in the binary method. The summation of the livable area for each building is calculated with the product of the residential buildings classification, the area of the building footprint, and the number of stories for that building. A total livable space is calculated for each building, represented with a variable livable space. In the case of mix use buildings, 40% of the livable space will be assigned to non residential and 60% to residential, following the model used in development simulation experiments (Waddell, 2003). The population of the census block is assigned to the building based on what percentage of the cumulative livable space within the census block is the livable space of that building. For example, if one building accounted for 25% of the cumulative livable space of a census block, 25% of that blocks raw population numbers would be allocated to that specific building. Areal weighting is a simple interpolation method which will allocate the summarized population data according to the proportional area of the zones in the target data (Langford, 2003).
9 Each person within the block will be allocated a percentage of the total residential floor space within the boundary of the population data. The areal interpolation will again rely on the assumption that population is distributed uniformly within the target zones (Maantay, 2007), that the residential patterns within the building are homogenous. Obviously this is not true, but the level of measurement is constrained by the census data- in other words, the lowest level of census information, the census block, controls the scale of the project. The buildings can be mapped as a percentage of the total but individual building variation within the block cannot be achieved with this approach. This research is concerned with creating the most accurate and precise representation the population of the urban environment possible with census data- a detailed illustration of where and how people live. While having the before mentioned limitations, the use of a dasymetric technique will expose the limitations of the cartographic technique of choropleth mapping and the conceptual limitations of urban population density mapping. Moving beyond population density in the traditional sense, the amount of residential living square footage allotted to each person is calculated with this a measurement that can be described as personal space. The personal space measurement will show not how many people live in an area, but how people live within that area, how populations are distributed across the built environment of the modern urban space. A bivariate choropleth design will allow for the spaces in the city where density and crowdedness are confused to be illustrated.
10 3.2.3 Bivariate Legend The bivariate legend allows for spatial comparisons and for the emergence of spatial patterns in the differences between the traditional population density measurement and the personal space measurement at the city scale. Using a bivariate map illustrates the correlation between the traditional measurement and the new measurement, revealing areas of Chicago that are misrepresented by the traditional population density measurement. This legend is created by plotting the population density of every census block aggregated to every building within that census block on the x-axis and dividing that range into three quantiles. This will give each of the three classifications the same number of observations, essentially creating a high population density, medium population density, and low population density classification. The range of personal space is plotted on the y-axis and also divided into three quantiles. This creates a high personal space, medium personal space, and low personal space classification. The two classifications are combined together on a three by three grid and symbolized using diverging color schemes. The diverging color scheme in the bivariate legend of personal space and population density is applied to every building in Chicago and begin to illustrate where there is an interesting interaction between the two measurements.

11 The critical areas of this legend are the four corners- the green, purple, orange, and pink classifications. The green classification symbolizes places that have a high density and a high amount of personal space. A high population density suggests that there are many people living on the planar surface within the boundary unit of the census block. High personal space would suggest that the people living within this boundary unit are living in residential spaces that are above average in terms of amount of space per person. The green classification of buildings suggests that the traditional measurement of population density is insufficient in characterizing the lived experience of crowdedness or spaciousness in the living space of the built environment. Likewise, the pink classification illustrates buildings in low population density blocks where the amount of personal space is below average. Again, this classification illustrates a space where

12 the traditional measurement has failed to characterize the experience of crowdedness or spaciousness in the living space of the built environment. The purple classification shows areas where the population density is high and personal space is low. The orange classifications show areas where population density is low and personal space is high. The muted colors that form the cross in the middle signify the spaces in the city that are average in population density or personal space. The design of the bivariate legend is done so to illustrate the spaces where the traditional measurement of population density either adequately captures or fails to characterize the living spaces of Chicago in terms of the experience of crowdedness or spaciousness of personal residential space. The personal space metric and population density of the surrounding census block can be measured in each building in the city. Moving from the building level to the scale of the entire city, the representation of the bivariate space metric at each building becomes
13 obsolete. Rather, the most appropriate measure is to summarize the average amount of personal space per census block and, combined with the census block population density, display the bivariate choropleth map for the extent of Chicago. This method will essentially break down the census data to allocate the amount of residential space per person and then reconstructs it at the census block level for representation. The bivariate metric can be utilized all the way out to the community area level for a very broad overview of the spatial structure of this interaction. The allocation of this data to the community level, however, will rely on the boundaries that the measure itself is attempting to deconstruct and ultimately provides little insight. 3.3 Demographic Profiles of Chicago A primary purpose of the personal space measurement to is to evaluate the residential spaces in Chicago and gain a better understanding of how people are distributed across different spatial environments. In order to better understand this distinction and to explore the implications of the new measure, this section will examine how demographic distributions change when the definition of the space is changed. Demographic profiles of neighborhoods or classifications of neighborhoods are commonly used measures to evaluate the social environment of a space. The evaluation of the members of a contained micro-environment, such as a bounded neighborhood, allows for the conceptualization of the socio-economic influences and the socio-cultural features of a space (Wen et al, 2003). The use of census data to show that a certain percentage of a space is of one group and another percentage, a different group, is an essential element of the organizational framework of population analysis. This section will explore this concept and show the differences in racial classifications when the measurement population density is changed to personal space
14 Obtaining racial data would seem to be a straightforward process: the census asks a question; statisticians, demographers, and other properly trained professionals tabulate the responses (Nobles, 2000). This process however is not as basic as it would initially appear. In the Census form, respondents are given the choice to select multiple racial categories from the following list of options: White, Black or African American, American Indian or Alaska Native, Asian, Native Hawaiian or Other Pacific Islander, and Other (US Census Bureau, 2011). The Census forms list two ethnicities, Hispanic or Latino and Non-Hispanic or Latino. The Census Bureau defines Hispanic or Latino as "a person of Cuban, Mexican, Puerto Rican, South or Central American or other Spanish culture or origin regardless of race (US Census Bureau, 2011). For this research, I have divided the racial or ethnic self identification into five categories for analysis and representation: White, Black, Hispanic, Asian, and Other. To illustrate the differences in the changes in demographics as the value of personal space is changed; the comparison of high density spaces will be made with the high density, high space classification- green- and the high density, low space classification- purple. Similarly, the low density spaces will be contrasted with the low density, high space areas- the orange classification- and the low density, low space areas- pink. The comparison of the different spaces will show both percent of total population for the different classifications as well as raw population numbers. The demographic profiles are collected from the census block measurement. 3.4 Spatial Structure of Chicago Spatial Statistics Goals and Overview
15 The goal of this section is to employ spatial statistic tools and concepts in an exploratory manner to investigate the distribution of different classified census blocks on the bivariate map of Chicago. This section is exploratory in nature in that, rather than using spatial statistics to make concrete or absolute claims about the urban space and the people that inhabit them, the techniques are being used a tool to begin to understand how different classified areas operate in space and where would be the most apt place to focus qualitative and quantitative analysis will be in the future. The dataset for this section is a point pattern dataset from the city of Chicago that has 16,885 point features representing the centroids of each census block in the city of Chicago. The points are classified into nine classes based on a bivariate legend explained above- traditional population density measurement on the y axis and personal space measurement on the x axis. The main areas of interest in the analysis are the points that are classified in the four corners of the legend, the areas that represent the combinations of highs and lows in the classification- in this case the green, pink, purple, and orange classifications. The green represents areas of high population density and high amounts of personal space. The purple is low population density and high personal space. The orange classification is high density, low space and the pink low in both categories. The 16,885 point dataset for the entire city of Chicago required sampling for the nearest neighbor analysis. Nearest neighbor analysis works well up to 3,000 points; beyond 3,000 the measurement starts to break down and does not return consistent variables (Bailey & Gartrell, 1995) CSR Model
16 The first test will be testing whether each of the four corners of the bivariate classification, the four areas of interest, differ in their distribution across the city space from complete spatial randomness. This will indicate whether the spaces of interest from the bivariate model show a pattern of clustering beyond what would be expected from a random point pattern. The first step in this process is to calculate the nearest neighbor calculation on each of the four areas of interest. The null hypothesis for this experiment is that the spatial distribution of the classified census blocks is not clustered and is completely spatially random in location within the city boundary of Chicago. The next step is to simulate a completely spatially random dataset of 3000 points within the city of Chicago with n=39 simulations and calculate the nearest neighbor of each simulated point for each simulation. This is done to create a distribution of nearest neighbor results equaling a 95% confidence intervals (Bailey & Gartrell, 1995). This allows for a distribution for what a complete spatially random pattern would look like which can be compared to the each classification in an fhat-h plot. This will allow for the comparison of the different classified point patterns to determine if they are spatially not randomly across the space of Chicago Thomas Model After determining whether or not the dataset is completely spatially random, the next logical step is to formally test whether the four point patterns compare to a cluster model. Using the Thomas cluster model, this test will determine if certain areas of interest are significantly more clustered than the background population of Chicago census blocks. The purpose of this experiment is to determine if any of the point patterns are significantly more clustered than a fairly strong simulated cluster model using a Thomas cluster model with the size and intensity of
17 the cluster based on a sampling of all the blocks in the city. This approach this will illustrate the areas that are especially clustered while at the same time taking into account that the point pattern is derived from census blocks and an artifact of the census structure will be a gridded pattern. The null hypothesis is that there will be no clustering above what is expected from the background distribution of census blocks. By using the Thomas cluster model with a radius and intensity of cluster simulations based on the structure and natural clustering of census blocks, the gridded structure of the city can be accounted for and classifications that exceed expected clustering can be observed. The first step is to simulate a Thomas model dataset of 3000 points within the city of Chicago with n=39 simulations and calculate the nearest neighbor of each simulated point for each simulation. The intensity of the cluster is calculated using the rate of clustering from all the census blocks in a community area. This represents the natural clustering of the city s census block structure. The radius of the cluster is average length of a community area centroid to its boundary. The cluster model with the intensity and radius of the cluster set at this level is designed to replicate the underlying population of census blocks in Chicago. The model creates 39 simulations to create a distribution of nearest neighbor results at 95% confidence intervals Interaction Model The next test is an interaction model on all the area of interest point patterns against the other area of interest point patterns to determine if certain classifications attract or repeal other classifications. This analysis is performed multi-directionally to determine if one point pattern holds more weight in the repulsion or attraction interaction. This test will be performed specifically on the green, pink, purple, and orange classifications against each other in both
18 directions. Not all of the sets of points have the same number of observations. The following list shows the number of points each classification has: Green-1,238, Pink- 1,211, Orange- 2,826, and Purple-2,853. To alleviate any problems that may arise from different size samples, each classification has been randomly sampled to equal 1,211 observations. The interactions of point patterns will explain whether one event, the green classification for example, has a direct impact on the spatial structure a second event, the purple classification for instance. Both events occur in the same space, the city boundary area of Chicago, but it is unclear whether or not there is an association between the two. The null hypothesis is that all couplets of events will be independent of each other and not show significant signs of attraction or repulsion. For this test, there are two variables, event I and event J. The interaction method will test to see if the probability that the distance from a randomly selected object in event I is closer to which of the two point patterns. This is repeated for every point in the target event. For example, if testing the interaction of the green classification to the purple classification, each point in green is selected and a nearest neighbor analysis run to determine if the nearest point is of the green or the purple classification. This will determine whether the spatial distribution of the purple classification has a direct influence on the spatial distribution of the green classification. With the use of exploratory data analysis- the complete spatial randomness model, the Thomas cluster model, and the interaction model- the spatial structure of how the different classifications are distributed across Chicago can begin the be explored. Exploratory spatial statistics are a starting point for beginning to think about what types of social and historical processes in Chicago are driving the spatial interaction of different lived experiences in different built environments.
19 3.5 Dot Density Methods There are four main considerations when making a dot density map that must be considered in order to intelligently design the map with implying a misleading spatial distribution of the phenomena. One must consider the aggregated boundary units, the size of the dots, the observations per dot, and the location of the dots (Slocum et al, 2009). To understand as precisely as possible the residential patterns in the urban space, these considerations need to be narrowed in scope as much as possible. Dots should be placed in the smallest areal unit, the residential building, to increase the precession of the placement of the individual. Each dot should represent one person to increase the accuracy of the representation of the individual. To observe the most accurate map of how people occupy the urban space, the boundaries need to removed and the individuals represented in space alone. When making a dot density map, the smaller the polygon the dots are randomly placed within the more accurate their location will be to the location of the entity being mapped (Slocum et al, 2009). Ancillary information, in this case, the buildings zoned residential and the vertical extent of those buildings are used to as the target layer which dots will be placed in. The population of each individual building is determined by using a Poisson distribution based on the expected population of each building. The expected population for each building is derived by calculating the expected amount of space per person from the total population of the census block into the amount of cumulative personal space measured in the census block. The personal space measurement will create a measurement that quantifies the amount of residential space in each building per person, the inverse of that will be the amount of expected people per building. From the expected intensity, the Poisson distribution allocates individuals into the building to be
20 represented in a dot density map. This is done under the assumption that all buildings in the census block are not homogenous both in terms of numbers and in terms of racial breakdown. The Poisson method, in this case, will account for variation within the buildings and not give every building in the census block individuals based on the common value of average personal space. The dot density method for this series of maps will represent each individual in the city with a singular dot confined to the building the Poisson distribution estimates that individual to live. The dots will use a symbology in which the hue of the dot will represent one of the five census race categories- White, Black, Hispanic, Asian, or Other. The use of chorodots will allow for the representation of different attributes while maintaining similar size and spatial locations across all observations (MacEachren, 1990). The chorodot technique will allow for the representation of different groups of individual people filling the space, both the planar and the vertical spaces, of the built environment around them. The infrastructure of the urban space provides a spatial structure of individual residential behavior that operates not on the boundaries of neighborhoods or census blocks, but rather on the functionality of the residential environment. The representation of this phenomenon, individuals of different races confined to the buildings the model predicts them to live in will provide valuable insight into the settlement patterns across Chicago. 3.6 Intensity Methods The final methods are designed to use the distribution of people allocated to specific buildings to create two new maps that show the intensity of people and the intensity of space without the use of any administrative boundaries. Both maps are made with a kernel density
21 function to create, first a representation of the population of Chicago with the boundary units removed, and second, a representation of the degree of crowdedness in Chicago. This map is designed to model these two population features without relying on boundaries or arbitrary geographies to determine the areas of classification. The population intensity map shows the distribution of people across the planar surface of the city. While this method does not account for the vertical space of buildings, it does use the personal space measurement as a derivative to create the estimation of how many people live in each building. The kernel intensity method is designed so that the estimated population value for each residential structure in the city is accounted for. The kernel radius is a function of that intensity of the population in each building. The assumption behind this is that the more people in each building, the more communal space they will occupy and draw resources from when outside the residential structure. The kernel size function is designed so the population of the building does not have a huge impact of the kernel size, but does alter it slightly to account for this allocation of communal space- an indication of the perceived experience of crowdedness of the space surrounding residential structure. The kernel size is designed so that a single family home with few residents will have an impact of intensity to match that of roughly a size of a yard while the most populated structure in the city will have a kernel size of about half a city block. By having the size of the kernel as a function of building population, the population of each residential structure will have an impact on the micro-scale population intensity in the immediate area around the building, but the intensity of the total building population will be the driving force behind the population intensity map. This map shows the areas of high and low intensity of populations without the use of any administrative boundaries, but fails to account for the amount
22 of space each person has. This map is represented using a traditional heat map index with colors ranging from blue for low intensity to red for high intensity. The second map, the space intensity map, also employs a kernel density method with a constant kernel size of 100 feet in diameter. The range of personal space is normalized on a scale of 0-1 so that the density function will show the distribution of the personal spaces and not the larger numbers of square feet per person. This method is designed not to calculate the intensity of the number of people each building has, but to calculate the intensity of the space each person has. The space intensity map is representing the relative crowdedness or spaciousness of each building in the city without relying on administrative boundary enumerations. This map is represented using a heat map index with colors ranging from blue for low intensity of crowdedness to red for high intensity of crowdedness. Both the population intensity map and the space intensity map are exported into the Google Earth interface for seamless viewing and interactivity at multiple scales. By using the format of an interactive virtual globe, it is immediately noticeable how the intensity of population and space change based on the built environment and vertical dimension of buildings. Another useful feature of the Google Earth interactive display is the addition of a three dimensional model to show the vertical extent of the built environment. In a map of population or crowdedness with boundaries, the spaces that are non-residential would have the same value as those places where people live. There is no population that lives on a golf course. A park is not a spacious or crowded living space. Using this method shows a clear difference in how the spatial structure of the city changes the intensity of people and spaces without generalizations and the use of boundaries.
23 3.7 Summary The methods section of this thesis employs a variety of techniques in attempts to better describe and represent the phenomenon of modern urban residential life. The main focus with this method is working towards the deconstruction of the employment of boundaries in cartographic representations of urban space. The vertical space is a feature of urban residential structure that has not been accounted for with the traditional measurements of density and the representations of density with standard choropleth and dot density approaches. The personal space index and the bivariate legend are methods to model this vertical space as an active residential environment. The exploratory spatial statistic models are attempts to discover patterns across the space of Chicago of the personal space classifications. A fine scale dot density approach to allocate individuals and demographic characteristics of the individuals to the building level at a level of representation where each dot equals one person was performed to explore the microstructure of the built environment in Chicago. A kernel density approach was taken to represent the intensity of population and the intensity of crowdedness at various scales across the city without the use of boundaries. The maps created with the methods illustrated in this section have been placed in the virtual globe environment of Google Earth for seamless user interaction. The virtual globe environment allows for results to be observed at various scales set against the context of areal imagery of the city.
Neighborhood Locations and Amenities
 University of Maryland School of Architecture, Planning and Preservation Fall, 2014 Neighborhood Locations and Amenities Authors: Cole Greene Jacob Johnson Maha Tariq Under the Supervision of: Dr. Chao
Introducing GIS analysis
 1 Introducing GIS analysis GIS analysis lets you see patterns and relationships in your geographic data. The results of your analysis will give you insight into a place, help you focus your actions, or
Neighborhood social characteristics and chronic disease outcomes: does the geographic scale of neighborhood matter? Malia Jones
 Neighborhood social characteristics and chronic disease outcomes: does the geographic scale of neighborhood matter? Malia Jones Prepared for consideration for PAA 2013 Short Abstract Empirical research
c. What is the most distinctive above ground result of high land costs and intensive land use? i. Describe the vertical geography of a skyscraper?
 AP Human Geography Unit 7b Guided Reading: Urban Patterns and Social Issues Mr. Stepek Key Issue #1: Why Do Services Cluster Downtown? (Rubenstein p 404 410) 1. What is the CBD? What does it contain and
USING DOWNSCALED POPULATION IN LOCAL DATA GENERATION
 USING DOWNSCALED POPULATION IN LOCAL DATA GENERATION A COUNTRY-LEVEL EXAMINATION CONTENT Research Context and Approach. This part outlines the background to and methodology of the examination of downscaled
Globally Estimating the Population Characteristics of Small Geographic Areas. Tom Fitzwater
 Globally Estimating the Population Characteristics of Small Geographic Areas Tom Fitzwater U.S. Census Bureau Population Division What we know 2 Where do people live? Difficult to measure and quantify.
The Choropleth Map Slide #2: Choropleth mapping enumeration units
 The Choropleth Map Slide #2: Choropleth mapping is a common technique for representing enumeration data These are maps where enumeration units, such as states or countries, are shaded a particular color
US Census Bureau Geographic Entities and Concepts. Geography Division
 US Census Bureau Geographic Entities and Concepts Geography Division Geographic Concepts Addresses vs. Geographic features and entities Legal/Administrative vs. Statistical Nesting relationships (or the
from
 8Map Generalization and Classification Our human and natural environments are complex and full of detail. Maps work by strategically reducing detail and grouping phenomena together. Driven by your intent,
Understanding and Measuring Urban Expansion
 VOLUME 1: AREAS AND DENSITIES 21 CHAPTER 3 Understanding and Measuring Urban Expansion THE CLASSIFICATION OF SATELLITE IMAGERY The maps of the urban extent of cities in the global sample were created using
Looking at Communities: Comparing Urban and Rural Neighborhoods
 Looking at Communities: Comparing Urban and Rural Neighborhoods OVERVIEW & OBJECTIVES Our urban areas have become so dominant that frequently the children we teach have no connection with and very few
NEW YORK DEPARTMENT OF SANITATION. Spatial Analysis of Complaints
 NEW YORK DEPARTMENT OF SANITATION Spatial Analysis of Complaints Spatial Information Design Lab Columbia University Graduate School of Architecture, Planning and Preservation November 2007 Title New York
Space Informatics Lab - University of Cincinnati
 Space Informatics Lab - University of Cincinnati USER GUIDE SocScape V 1.0 September 2014 1. Introduction SocScape (Social Landscape) is a GeoWeb-based tool for exploration of patterns in high resolution
An Introduction to the South Carolina Atlas
 An Introduction to the South Carolina Atlas Daniel E. Stone Pinewood Preparatory School dstone@pinewoodprep.com Overview This lesson is designed to serve as an introduction to the new South Carolina Atlas.
Merging statistics and geospatial information
 Merging statistics and geospatial information Demography / Commuting / Spatial planning / Registers Mirosław Migacz Chief GIS Specialist Janusz Dygaszewicz Director Central Statistical Office of Poland
Local Economic Activity Around Rapid Transit Stations
 Local Economic Activity Around Rapid Transit Stations The Case of Chicago s Orange Line Julie Cooper, MPP 2014 Harris School of Public Policy Transport Chicago June 6, 2014 Motivation Impacts of transit
KENTUCKY HAZARD MITIGATION PLAN RISK ASSESSMENT
 KENTUCKY HAZARD MITIGATION PLAN RISK ASSESSMENT Presentation Outline Development of the 2013 State Hazard Mitigation Plan Risk Assessment Determining risk assessment scale Census Data Aggregation Levels
Environmental Justice Analysis FOR THE MINNESOTA STATEWIDE FREIGHT SYSTEM PLAN
 Environmental Justice Analysis FOR THE MINNESOTA STATEWIDE FREIGHT SYSTEM PLAN Presentation Overview Minnesota Freight Plan Summary Environmental Justice (EJ) Background Freight Plan EJ Analysis Methodology
Lecture 5. Symbolization and Classification MAP DESIGN: PART I. A picture is worth a thousand words
 Lecture 5 MAP DESIGN: PART I Symbolization and Classification A picture is worth a thousand words Outline Symbolization Types of Maps Classifying Features Visualization Considerations Symbolization Symbolization
SOUTH COAST COASTAL RECREATION METHODS
 SOUTH COAST COASTAL RECREATION METHODS A customized, web-based survey instrument, which utilizes Point 97 s Viewpoint survey and mapping technology, was used to collect spatially explicit data on coastal
A Socioeconomic Analysis of the Spatial Distribution of Fire Hydrants. History of Portland Fire Hydrants
 A Socioeconomic Analysis of the Spatial Distribution of Fire Hydrants By Dylan Carmody Robert Chappell Jana Tracy Allan McMillian 2003 History of Portland Fire Hydrants The first fire hydrant was installed
Environmental Analysis, Chapter 4 Consequences, and Mitigation
 Environmental Analysis, Chapter 4 4.17 Environmental Justice This section summarizes the potential impacts described in Chapter 3, Transportation Impacts and Mitigation, and other sections of Chapter 4,
Defining Statistically Significant Spatial Clusters of a Target Population using a Patient-Centered Approach within a GIS
 Defining Statistically Significant Spatial Clusters of a Target Population using a Patient-Centered Approach within a GIS Efforts to Improve Quality of Care Stephen Jones, PhD Bio-statistical Research
Forecasts for the Reston/Dulles Rail Corridor and Route 28 Corridor 2010 to 2050
 George Mason University Center for Regional Analysis Forecasts for the Reston/Dulles Rail Corridor and Route 28 Corridor 21 to 25 Prepared for the Fairfax County Department of Planning and Zoning Lisa
Understanding China Census Data with GIS By Shuming Bao and Susan Haynie China Data Center, University of Michigan
 Understanding China Census Data with GIS By Shuming Bao and Susan Haynie China Data Center, University of Michigan The Census data for China provides comprehensive demographic and business information
Road Network Analysis as a Means of Socio-spatial Investigation the CoMStaR 1 Project
 Road Network Analysis as a Means of Socio-spatial Investigation the CoMStaR 1 Project F. Anders 1, R. König 1 1 Bauhaus-University Weimar, Faculty of Architecture, Chair Computer Science in Architecture,
High resolution population grid for the entire United States
 High resolution population grid for the entire United States A. Dmowska, T. F. Stepinski Space Informatics Lab, Department of Geography, University of Cincinnati, Cincinnati, OH 45221-0131, USA Telephone:
MULTIPLE CHOICE. Choose the one alternative that best completes the statement or answers the question.
 AP Test 13 Review Name MULTIPLE CHOICE. Choose the one alternative that best completes the statement or answers the question. 1) Compared to the United States, poor families in European cities are more
CLAREMONT MASTER PLAN 2017: LAND USE COMMUNITY INPUT
 Planning and Development Department 14 North Street Claremont, New Hampshire 03743 Ph: (603) 542-7008 Fax: (603) 542-7033 Email: cityplanner@claremontnh.com www.claremontnh.com CLAREMONT MASTER PLAN 2017:
The Building Blocks of the City: Points, Lines and Polygons
 The Building Blocks of the City: Points, Lines and Polygons Andrew Crooks Centre For Advanced Spatial Analysis andrew.crooks@ucl.ac.uk www.gisagents.blogspot.com Introduction Why use ABM for Residential
GOVERNMENT MAPPING WORKSHOP RECOVER Edmonton s Urban Wellness Plan Mapping Workshop December 4, 2017
 GOVERNMENT MAPPING WORKSHOP 12.4.17 RECOVER Edmonton s Urban Wellness Plan Mapping Workshop December 4, 2017 In July of 2017, City Council directed administration to develop RECOVER, Edmonton s Urban Wellness
wildlife spatial analysis lab PEOPLE & PLACE: Dasymetric Mapping Using Arc/Info
 PEOPLE & PLACE: Dasymetric Mapping Using Arc/Info by Steven R Holloway James Schumacher Roland L Redmond Summer 1997 in press: Cartographic Design Using ArcView and ARC/INFO High Mountain Press, NM wildlife
Module 10 Summative Assessment
 Module 10 Summative Assessment Activity In this activity you will use the three dimensions of vulnerability that you learned about in this module exposure, sensitivity, and adaptive capacity to assess
Local Area Key Issues Paper No. 13: Southern Hinterland townships growth opportunities
 Draft Sunshine Coast Planning Scheme Review of Submissions Local Area Key Issues Paper No. 13: Southern Hinterland townships growth opportunities Key Issue: Growth opportunities for Southern Hinterland
Typical information required from the data collection can be grouped into four categories, enumerated as below.
 Chapter 6 Data Collection 6.1 Overview The four-stage modeling, an important tool for forecasting future demand and performance of a transportation system, was developed for evaluating large-scale infrastructure
Exercise on Using Census Data UCSB, July 2006
 Exercise on Using Census Data UCSB, July 2006 Purpose The purpose of this lab is to become familiar with Census Bureau data. Second, we will learn how to join tables which allows you to add data to the
The Journal of Database Marketing, Vol. 6, No. 3, 1999, pp Retail Trade Area Analysis: Concepts and New Approaches
 Retail Trade Area Analysis: Concepts and New Approaches By Donald B. Segal Spatial Insights, Inc. 4938 Hampden Lane, PMB 338 Bethesda, MD 20814 Abstract: The process of estimating or measuring store trade
The Data Set. The Tool CMSC 734 INFORMATION VISUALIZATION APPLICATION PROJECT REPORT MARYLAND CENSUS INFORMATION ( )
") The Data Set CMSC 734 INFORMATION VISUALIZATION APPLICATION PROJECT REPORT MARYLAND CENSUS INFORMATION (2000 2010) Sameh Khamis Department of Computer Science University of Maryland sameh@cs.umd.edu Marcelo
The Data Set CMSC 734 INFORMATION VISUALIZATION APPLICATION PROJECT REPORT MARYLAND CENSUS INFORMATION (2000 2010) Sameh Khamis Department of Computer Science University of Maryland sameh@cs.umd.edu Marcelo
GSP 270 Final Project: Tibet in Transition
 GSP 270 Final Project: Tibet in Transition by Jesse Vad 12th of December, 2014 Introduction Over the summer of 2014 I traveled to Tibet on my senior research field expedition through Humboldt State University.
Data Collection. Lecture Notes in Transportation Systems Engineering. Prof. Tom V. Mathew. 1 Overview 1
 Data Collection Lecture Notes in Transportation Systems Engineering Prof. Tom V. Mathew Contents 1 Overview 1 2 Survey design 2 2.1 Information needed................................. 2 2.2 Study area.....................................
Orbital Insight Energy: Oil Storage v5.1 Methodologies & Data Documentation
 Orbital Insight Energy: Oil Storage v5.1 Methodologies & Data Documentation Overview and Summary Orbital Insight Global Oil Storage leverages commercial satellite imagery, proprietary computer vision algorithms,
Chapter 6 Spatial Analysis
 6.1 Introduction Chapter 6 Spatial Analysis Spatial analysis, in a narrow sense, is a set of mathematical (and usually statistical) tools used to find order and patterns in spatial phenomena. Spatial patterns
GIS Lecture 5: Spatial Data
 GIS Lecture 5: Spatial Data GIS 1 Outline Vector Data Formats Raster Data Formats Map Projections Coordinate Systems US Census geographic files US Census data files GIS Data Sources GIS 2 Vector Data Formats
Regression Analysis. A statistical procedure used to find relations among a set of variables.
 Regression Analysis A statistical procedure used to find relations among a set of variables. Understanding relations Mapping data enables us to examine (describe) where things occur (e.g., areas where
Enrollment at a Glance Fall 2015
 1. Number of Students Enrolled at Tenth Day of Fall Term 2011 2012 2013 2014 2015 3,705 ( 100.0% ) 3,626 ( 100.0% ) 3,706 ( 100.0% ) 3,746 ( 100.0% ) 3,891 ( 100.0% ) New 1 1,051 ( 28.4% ) 1,063 ( 29.3%
Working with Census 2000 Data from MassGIS
 Tufts University GIS Tutorial Working with Census 2000 Data from MassGIS Revised September 26, 2007 Overview In this tutorial, you will use pre-processed census data from Massachusetts to create maps of
MEASURING RACIAL RESIDENTIAL SEGREGATION
 MEASURING RACIAL RESIDENTIAL SEGREGATION Race Relations Institute Fisk University 1000 Seventeenth Ave. North Nashville, Tennessee 37208 615/329-8575 WHERE WE LIVE: THE COLOR LINE The color line is carved
Morphology, Sustainable Evolution of Inner-urban Neighborhoods in San Francisco
 Morphology, Sustainable Evolution of Inner-urban Neighborhoods in San Francisco Associate Professor, Department of Environmental Engineering and Architecture, Graduate School of Environmental Studies University
GIS for the Non-Expert
 GIS for the Non-Expert Ann Forsyth University of Minnesota February 2006 GIS for the Non-Expert 1. Definitions and problems 2. Measures being tested in Twin Cities Walking Study Basic approach, data, variables
Areal Interpolation Methods using Land Cover and Street Data. Jeff Bourdier GIS Master s s Project Summer 2006
 Areal Interpolation Methods using Land Cover and Street Data Jeff Bourdier GIS Master s s Project Summer 2006 Objective The areal interpolation problem Some variable (here, population) is known in a given
GED 554 IT & GIS. Lecture 6 Exercise 5. May 10, 2013
 GED 554 IT & GIS Lecture 6 Exercise 5 May 10, 2013 Free GIS data sources ******************* Mapping numerical data & Symbolization ******************* Exercise: Making maps for presentation GIS DATA SOFTWARE
Urban Transportation Planning Prof. Dr.V.Thamizh Arasan Department of Civil Engineering Indian Institute of Technology Madras
 Urban Transportation Planning Prof. Dr.V.Thamizh Arasan Department of Civil Engineering Indian Institute of Technology Madras Module #03 Lecture #12 Trip Generation Analysis Contd. This is lecture 12 on
ANALYZING CITIES & POPULATION: POPULATION GEOGRAPHY
 ANALYZING CITIES & POPULATION: POPULATION GEOGRAPHY Population Geography Population Geography study of the number, contribution, and distribution of human populations Demography the study of the characteristics
A Shift to the Sunbelt
 Adam Giladi 4/1/13 A Shift to the Sunbelt The changing global economy has lead to an increased interconnection between nations and the mass movement of individuals from one area to another. This movement
PALS: Neighborhood Identification, City of Frederick, Maryland. David Boston Razia Choudhry Chris Davis Under the supervision of Chao Liu
 PALS: Neighborhood Identification, City of Frederick, Maryland David Boston Razia Choudhry Chris Davis Under the supervision of Chao Liu University of Maryland School of Architecture, Planning & Preservation
Geog183: Cartographic Design and Geovisualization Spring Quarter 2018 Lecture 11: Dasymetric and isarithmic mapping
 Geog183: Cartographic Design and Geovisualization Spring Quarter 2018 Lecture 11: Dasymetric and isarithmic mapping Discrete vs. continuous revisited Choropleth suited to discrete areal, but suffers from
Representation of Geographic Data
 GIS 5210 Week 2 The Nature of Spatial Variation Three principles of the nature of spatial variation: proximity effects are key to understanding spatial variation issues of geographic scale and level of
Lecture 10 Mapping Quantities: Dot Density Maps
 Lecture 10 Mapping Quantities: Dot Density Maps Introduction Creating maps of features based on quantity are some of the most common and important types of maps. In order to create maps that show quantity
INSIDE. Metric Descriptions by Topic Area. Data Sources and Methodology by Topic Area. Technical Appendix
 As part of the Chicago Neighborhoods 2015 (CN2015) project, the Institute for Housing Studies at DePaul University collected data and built metrics to help The Chicago Community Trust and the City of Chicago
Assessing Social Vulnerability to Biophysical Hazards. Dr. Jasmine Waddell
 Assessing Social Vulnerability to Biophysical Hazards Dr. Jasmine Waddell About the Project Built on a need to understand: The pre-disposition of the populations in the SE to adverse impacts from disaster
Physical Geography Lab Activity #15
 Physical Geography Lab Activity #15 Due date Name Choropleth Maps COR Objective 1 & 7, SLOs 1 & 3 15.1. Introduction Up until this point we have used maps to find locations on the Earth. While they are
Geographic Systems and Analysis
 Geographic Systems and Analysis New York University Robert F. Wagner Graduate School of Public Service Instructor Stephanie Rosoff Contact: stephanie.rosoff@nyu.edu Office hours: Mondays by appointment
EXPLORING THE FUTURE WATER INFRASTRUCTURE OF CITIES
 EXPLORING THE FUTURE WATER INFRASTRUCTURE OF CITIES Eng. Arlex Sanchez Torres PhD. R.K. Price PhD. Z. Vojinovic Jan 24 th - 2011 The future of urban water: Solutions for livable and resilient cities SWITCH
Interactive Visualization Tool (InViTo)
") Interactive Visualization Tool (InViTo) Stefano Pensa To cite this report: Stefano Pensa (2012) Interactive Visualization Tool (InViTo), in Angela Hull, Cecília Silva and Luca Bertolini (Eds.) Accessibility
Interactive Visualization Tool (InViTo) Stefano Pensa To cite this report: Stefano Pensa (2012) Interactive Visualization Tool (InViTo), in Angela Hull, Cecília Silva and Luca Bertolini (Eds.) Accessibility
Using American Factfinder
 Using American Factfinder What is American Factfinder? American Factfinder is a search engine that provides access to the population, housing and economic data collected by the U.S. Census Bureau. It can
Massachusetts Institute of Technology Department of Urban Studies and Planning
 Massachusetts Institute of Technology Department of Urban Studies and Planning 11.204: Planning, Communications & Digital Media Fall 2002 Lecture 6: Tools for Transforming Data to Action Lorlene Hoyt October
Geog183: Cartographic Design and Geovisualization Winter Quarter 2017 Lecture 6: Map types and Data types
 Geog183: Cartographic Design and Geovisualization Winter Quarter 2017 Lecture 6: Map types and Data types Data types Data dimension: Point, Line, Area, Volume (Text) Data continuity: Discrete, Point, Polygon:
Council Workshop on Neighbourhoods Thursday, October 4 th, :00 to 4:00 p.m. Burlington Performing Arts Centre
 Council Workshop on Neighbourhoods Thursday, October 4 th, 2012 1:00 to 4:00 p.m. Burlington Performing Arts Centre Agenda Introductions Warm-Up Exercise Presentation Exercise Neighbourhood Planning Break
LOUISIANA STUDENT STANDARDS FOR SOCIAL STUDIES THAT CORRELATE WITH A FIELD TRIP TO DESTREHAN PLANTATION KINDERGARTEN
 LOUISIANA STUDENT STANDARDS FOR SOCIAL STUDIES THAT CORRELATE WITH A FIELD TRIP TO DESTREHAN PLANTATION KINDERGARTEN Standard 2 Historical Thinking Skills Students distinguish between events, people, and
Letting reality speak. How the Chicago School Sociology teaches scholars to speak with our findings.
 Letting reality speak. How the Chicago School Sociology teaches scholars to speak with our findings. By Nanke Verloo n.verloo@uva.nl Assistant professor in Urban Planning, University of Amsterdam. Think
Cartography and Geovisualization. Chapters 12 and 13 of your textbook
 Cartography and Geovisualization Chapters 12 and 13 of your textbook Why cartography? Maps are the principle means of displaying spatial data Exploration: visualization, leading to conceptualization of
Riocan Centre Study Area Frontenac Mall Study Area Kingston Centre Study Area
 OVERVIEW the biggest challenge of the next century (Dunham Jones, 2011). New books are continually adding methods and case studies to a growing body of literature focused on tackling this massive task.
Content Area: Social Studies Standard: 1. History Prepared Graduates: Develop an understanding of how people view, construct, and interpret history
 Standard: 1. History Develop an understanding of how people view, construct, and interpret history 1. Organize and sequence events to understand the concepts of chronology and cause and effect in the history
Rural Pennsylvania: Where Is It Anyway? A Compendium of the Definitions of Rural and Rationale for Their Use
 Rural Pennsylvania: Where Is It Anyway? A Compendium of the Definitions of Rural and Rationale for Their Use Pennsylvania Office of Rural Health 310 Nursing Sciences Building University Park, PA 16802
Developing Spatial Awareness :-
 Developing Spatial Awareness :- We begin to exercise our geographic skill by examining he types of objects and features we encounter. Four different spatial objects in the real world: Point, Line, Areas
Links between socio-economic and ethnic segregation at different spatial scales: a comparison between The Netherlands and Belgium
 Links between socio-economic and ethnic segregation at different spatial scales: a comparison between The Netherlands and Belgium Bart Sleutjes₁ & Rafael Costa₂ ₁ Netherlands Interdisciplinary Demographic
Chapter 9: Urban Geography
 Chapter 9: Urban Geography The Five Steps to Chapter Success Step 1: Read the Chapter Summary below, preview the Key Questions, and Geographic Concepts. Step 2: Complete the Pre-Reading Activity (PRA)
Frontier and Remote (FAR) Area Codes: A Preliminary View of Upcoming Changes John Cromartie Economic Research Service, USDA
 Area Codes: A Preliminary View of Upcoming Changes John Cromartie Economic Research Service, USDA") National Center for Frontier Communities webinar, January 27, 2015 Frontier and Remote (FAR) Area Codes: A Preliminary View of Upcoming Changes John Cromartie Economic Research Service, USDA The views
National Center for Frontier Communities webinar, January 27, 2015 Frontier and Remote (FAR) Area Codes: A Preliminary View of Upcoming Changes John Cromartie Economic Research Service, USDA The views
Spatial Disparities in the Distribution of Parks and Green Spaces in the United States
 March 11 th, 2012 Active Living Research Conference Spatial Disparities in the Distribution of Parks and Green Spaces in the United States Ming Wen, Ph.D., University of Utah Xingyou Zhang, Ph.D., CDC
A BASE SYSTEM FOR MICRO TRAFFIC SIMULATION USING THE GEOGRAPHICAL INFORMATION DATABASE
 A BASE SYSTEM FOR MICRO TRAFFIC SIMULATION USING THE GEOGRAPHICAL INFORMATION DATABASE Yan LI Ritsumeikan Asia Pacific University E-mail: yanli@apu.ac.jp 1 INTRODUCTION In the recent years, with the rapid
The History Behind Census Geography
 The History Behind Census Geography Michael Ratcliffe Geography Division US Census Bureau Kentucky State Data Center Affiliate Meeting August 5, 2016 Today s Presentation A brief look at the history behind
Preparing the GEOGRAPHY for the 2011 Population Census of South Africa
 Preparing the GEOGRAPHY for the 2011 Population Census of South Africa Sharthi Laldaparsad Statistics South Africa; E-mail: sharthil@statssa.gov.za Abstract: Statistics South Africa (Stats SA) s Geography
CRP 608 Winter 10 Class presentation February 04, Senior Research Associate Kirwan Institute for the Study of Race and Ethnicity
 CRP 608 Winter 10 Class presentation February 04, 2010 SAMIR GAMBHIR SAMIR GAMBHIR Senior Research Associate Kirwan Institute for the Study of Race and Ethnicity Background Kirwan Institute Our work Using
Points. Luc Anselin. Copyright 2017 by Luc Anselin, All Rights Reserved
 Points Luc Anselin http://spatial.uchicago.edu 1 classic point pattern analysis spatial randomness intensity distance-based statistics points on networks 2 Classic Point Pattern Analysis 3 Classic Examples
Unit 1, Lesson 3 What Tools and Technologies Do Geographers Use?
 Unit 1, Lesson 3 What Tools and Technologies Do Geographers Use? Geographers use a variety of tools and technologies in investigating geographic questions. Maps and globes both represent the earth, but
Abstract of Dissertation
 Abstract of Dissertation A Study on Place Identity of Urbanized Agriculture based Settleme nt Process of Change and Transformation in Urban Village in Hanoi The world is in the midst of the phase of globalization,
In this exercise we will learn how to use the analysis tools in ArcGIS with vector and raster data to further examine potential building sites.
 GIS Level 2 In the Introduction to GIS workshop we filtered data and visually examined it to determine where to potentially build a new mixed use facility. In order to get a low interest loan, the building
DATA DISAGGREGATION BY GEOGRAPHIC
 PROGRAM CYCLE ADS 201 Additional Help DATA DISAGGREGATION BY GEOGRAPHIC LOCATION Introduction This document provides supplemental guidance to ADS 201.3.5.7.G Indicator Disaggregation, and discusses concepts
Hennepin GIS. Tree Planting Priority Areas - Analysis Methodology. GIS Services April 2018 GOAL:
 Hennepin GIS GIS Services April 2018 Tree Planting Priority Areas - Analysis Methodology GOAL: To create a GIS data layer that will aid Hennepin County Environment & Energy staff in determining where to
Geovisualization of Attribute Uncertainty
 Geovisualization of Attribute Uncertainty Hyeongmo Koo 1, Yongwan Chun 2, Daniel A. Griffith 3 University of Texas at Dallas, 800 W. Campbell Road, Richardson, Texas 75080, 1 Email: hxk134230@utdallas.edu
The History Behind Census Geography
 The History Behind Census Geography Michael Ratcliffe Geography Division US Census Bureau Tennessee State Data Center August 8, 2017 Today s Presentation A brief look at the history behind some of the
GIS-Based Analysis of the Commuting Behavior and the Relationship between Commuting and Urban Form
 GIS-Based Analysis of the Commuting Behavior and the Relationship between Commuting and Urban Form 1. Abstract A prevailing view in the commuting is that commuting would reconstruct the urban form. By
INDIANA ACADEMIC STANDARDS FOR SOCIAL STUDIES, WORLD GEOGRAPHY. PAGE(S) WHERE TAUGHT (If submission is not a book, cite appropriate location(s))
 WHERE TAUGHT (If submission is not a book, cite appropriate location(s))") Prentice Hall: The Cultural Landscape, An Introduction to Human Geography 2002 Indiana Academic Standards for Social Studies, World Geography (Grades 9-12) STANDARD 1: THE WORLD IN SPATIAL TERMS Students
Prentice Hall: The Cultural Landscape, An Introduction to Human Geography 2002 Indiana Academic Standards for Social Studies, World Geography (Grades 9-12) STANDARD 1: THE WORLD IN SPATIAL TERMS Students
King Fahd University of Petroleum & Minerals College of Engineering Sciences Civil Engineering Department. Geographical Information Systems(GIS)
") King Fahd University of Petroleum & Minerals College of Engineering Sciences Civil Engineering Department Geographical Information Systems(GIS) Term Project Titled Delineating Potential Area for Locating
King Fahd University of Petroleum & Minerals College of Engineering Sciences Civil Engineering Department Geographical Information Systems(GIS) Term Project Titled Delineating Potential Area for Locating
ASIA GEOSPATIAL FORUM 2011 Eco-Friendly Walk Score Calculator Choosing a Place to Live with GIS
 ASIA GEOSPATIAL FORUM 2011 Eco-Friendly Walk Score Calculator Choosing a Place to Live with GIS Ko Ko Lwin and Yuji Murayama Division of Spatial Information Science Graduate School of Life and Environmental
2011 Built-up Areas - Methodology and Guidance
 2011 Built-up Areas - Methodology and Guidance June 2013 Version: 2013 v1 Office for National Statistics 2013 Contents 1. Introduction... 3 2. Methodology... 3 2.1 Identifying built-up areas for the 2011
Geographical knowledge and understanding scope and sequence: Foundation to Year 10
 Geographical knowledge and understanding scope and sequence: Foundation to Year 10 Foundation Year 1 Year 2 Year 3 Year 4 Year 5 Year 6 Year level focus People live in places Places have distinctive features
Dublin City Schools Social Studies Graded Course of Study Grade 5 K-12 Social Studies Vision
 K-12 Social Studies Vision The Dublin City Schools K-12 Social Studies Education will provide many learning opportunities that will help students to: develop thinking as educated citizens who seek to understand
DATA COLLECTION & SAMPLING
 DATA COLLECTION & SAMPLING The Local Landscape Spring 2015 Preparing for data collection Increase background knowledge Research Plan Field Recon Test field methods Field reconnaissance Visit geographic
Geography 360 Principles of Cartography. April 17, 2006
 Geography 360 Principles of Cartography April 17, 2006 Outlines Cartographic design principles Enhancing visual hierarchies on maps Kinds of numerical data and color scheme What is proportional symbol