Extremes and Atmospheric Data
|
|
|
- Kristopher Newton
- 5 years ago
- Views:
Transcription


1 Extremes and Atmospheric Data Eric Gilleland Research Applications Laboratory National Center for Atmospheric Research Program on Risk Analysis, Extreme Events and Decision Theory, opening workshop September, North Carolina
2 Extremes Interest in making inferences about large, rare, extreme phenomena. Given certain properties (e.g., independence), extremes follow EVD. Tricky because atmospheric data are often spatially (and temporally) correlated, even in their extreme values.
3 Atmospheric Data Point Data Air Quality Monitoring (e.g., Ozone concentrations) METARs stations (ground-based weather observations) Radiosondes (weather balloons, airplanes)... Gridded Data Global NCAR/NCEP Reanalysis All available observational data are synthesized with a static data assimilation process. Remote sensing (e.g., satellite) Model Output (e.g., Weather/Climate models)
4 Software R: statistical programming language Free software environment for statistical computing and graphics. Compiles and runs on a wide variety of UNIX platforms, Windows and MacOS.

5 Software extremes: Weather and Climate Applications of Extreme Value Statistics
6 Software spatial extension to R package extremes (in dev) Many other extreme-value software packages (e.g., Stephenson and Gilleland, 2005) Many spatial statistics package too (e.g., in R: fields, sp,...)
7 Questions Air Quality Standards High values of a spatial process (e.g.,... if the threeyear average of the fourth-highest maximum daily 8- hour ozone concentration exceeds 80 ppb... ) What is the coverage at an unobserved location? Severe Weather and Climate Change Will the frequency and intensity of severe weather increase in the future?
8 Daily Ozone Concentrations Number of years: 5 ozone seasons ( ) Ozone season : 184 days (April - October) Daily values: Maximum of 8-hr block averages (ppb) Distribution: Continuous, Normal Spatial Locations: 72 stations centered on North Carolina
 of an ozone season (184 days). Compliance is met when the FHDA over a three year (season) period is below 84 ppb.")
9 NAAQS for Ground-level Ozone In 1997, the U.S. EPA changed the NAAQS for regulating ground-level ozone levels to one based on the fourth-highest daily maximum 8-hr. averages (FHDA) of an ozone season (184 days). Compliance is met when the FHDA over a three year (season) period is below 84 ppb.


10 1997 FHDA Observed Data North Carolina Three sites
11 Goal Spatial Inference for the Standard What can be deduced about FHDA at unobserved locations? Characterize a spatial field of fourth-highest order statistics Distribution: Is it Gaussian (extreme value)? What does the covariance structure look like?
12 Some Strategies Strategies Using Spatial Extension of extremes Spatial and Space-Time Approaches (e.g., Gilleland and Nychka, 2005) Daily Model Approach Seasonal Model Approach (and simple thin plate spline) Comparison of Daily and Seasonal Models Spatial Extreme Value Model (e.g., Gilleland et al, 2006) Other approaches Alter loss function: (e.g., Craigmile et al., 2006a) EVD using Bayesian hierarchical model: (e.g., Cooley et al, in press, 2006a) Madograms: (e.g., Cooley et al, 2006b)
13 Space-Time Approach: Daily Model Space-Time model One strategy is to model daily ozone using a space-time model (spatial AR(1)) to determine the distribution of the standard. Simulation Use Monte Carlo simulations to generate samples of the standard using the space-time model. That is, simulate a season of ozone data using the space-time model and take the fourth-highest of them. Do this several times to obtain a sample from the FHDA distribution.
14 Space-Time Approach: Daily Model The Daily Model Let Y (x, t) denote the daily 8-hr max ozone for m sites over n time points. Consider, Y (x, t) = µ(x, t) + σ(x)u(x, t), where u(x, t) is a de-seasonalized zero mean, unit variance space-time process. Explicitly modeling daily observations spatially in order to obtain simulated samples of FHDA
 model over time for u(x, t).")
15 Space-Time Approach: Daily Model Space-Time Process After de-seasonalizing/standardizing, for each spatial site, x, fit an AR(1) model over time for u(x, t). u(x, t) = ρ(x)u(x, t 1) + ε(x, t)
16 Space-Time Approach: Daily Model Leads to the spatio-temporal covariance Cov(u(x, t), u(x, t τ)) = for τ 0. (ρ(x)) 1 τ ρ 2 (x) 1 ρ 2 (x ) 1 ρ(x)ρ(x ) ψ(d(x, x )), If ρ(x) = ρ, then Cov(u(x, t), u(x, t τ)) simplifies to ρ τ ψ(d(x, x ))
 shocks, ˆε(x,")
17 Space-Time Approach: Daily Model Correlogram of AR(1) shocks, ˆε(x, t)
18 Space-Time Approach: Daily Model Space-Time Process: Correlogram of AR(1) shocks Correlogram plots for spatial shocks suggest a mixture of exponentials covariance model is appropriate. Let h = d(x, x ), ψ(h) = αe h/θ 1 + (1 α)e h/θ 2 Fitted values are ˆα 0.13 (±0.02), ˆθ 1 11 miles (±3.37 miles) and ˆθ miles (±16.89 miles).
19 Space-Time Approach: Daily Model The Goal Spatial inference for the NAAQS for ground-level ozone. That is, what can be deduced about FHDA at unobserved locations? Want to sample from [FHDA daily data].

20 Space-Time Approach: Daily Model Algorithm to predict FHDA at unobserved location, x Simulate data for an entire ozone season
21 Space-Time Approach: Daily Model Algorithm to predict FHDA at unobserved location, x Simulate data for an entire ozone season (a) Interpolate spatially from u(x, 1) to get û(x 0, 1). (b) Also interpolate spatially to get ˆρ(x 0 ), ˆµ(x 0, ) and ˆσ(x 0 ). (c) Sample shocks at time t from [ε(x 0, t) ε(x, t)]. (d) Propagate AR(1) model. (e) Back transform Ŷ (x 0, t) = û(x 0, t)ˆσ(x 0 ) + ˆµ(x 0, t)
22 Space-Time Approach: Daily Model Algorithm to predict FHDA at unobserved location, x Simulate data for an entire ozone season. 2. Take fourth-highest value from Step Repeat Steps 1 and 2 many times to get a sample of FHDA at unobserved location.
23 Space-Time Approach: Daily Model Distribution for the AR(1) shocks [ε(x 0, t) ε(x, t)] (Step 1c) given by Gau(M, Σ) with and M = k (x 0, x)k 1 (x, x)ε(x, t) Σ = k (x 0, x 0 ) k (x 0, x)k 1 (x, x)k(x, x 0 ), where k(x, y) = [ψ(x i, y j )] the covariance matrix for two sets of spatial locations.

24 Space-Time Approach: Daily Model Results of predicting FHDA spatially with daily model (1997)

25 Comparing the Daily and Seasonal models
26 Comparing the Daily and Seasonal models Simplicity of the seasonal model approach is desirable. Daily model yields consistently lower MSE from leave-oneout cross validation. Daily model can account for complicated spatial features without resorting to non-standard techniques. Daily MPSE is consistently too optimistic.
27 Another Approach: Spatial Extremes Given a spatial process, Z(x), what can be said about Pr{Z(x) > z} when z is large?
28 Spatial Extremes Given a spatial process, Z(x), what can be said about when z is large? Pr{Z(x) > z} Note: This is not about dependence between Z(x) and Z(x ) this is another topic!
29 Spatial Extremes Given a spatial process, Z(x), what can be said about when z is large? Pr{Z(x) > z} Note: This is not about dependence between Z(x) and Z(x ) this is another topic! Spatial structure on parameters of distribution (not FHDA).
] 1/ξ")
30 Extreme Value Distributions: GPD For a (large) threshold u, the GPD is given by Pr{X > x X > u} [1 + ξ (x u)] 1/ξ σ
31 A Hierarchical Spatial Model Observation Model: y(x, t) surface ozone at location x and time t Spatial Process Model: Prior for hyperparameters: [y(x, t) σ(x), ξ(x), u, y(x, t) > u] [σ(x), ξ(x), u θ] [θ]
32 A Hierarchical Spatial Model Assume extreme observations to be conditionally independent so that the joint pdf for the data and parameters is i,t [y(x i, t) σ(x), ξ(x), u, y(x i, t) > u] [σ(x), ξ(x), u θ] [θ] t indexes time and i stations.
33 Shortcuts and Assumptions Assume threshold, u, fixed. ξ(x) = ξ (i.e., shape is constant over space). Justified by univariate fits. Assume σ(x) is a Gaussian process with isotropic Matérn covariance function. Fix Matérn smoothness parameter at ν = 2, and let the range be very large leaving only λ (ratio of variances of nugget and sill).
34 More on σ(x) σ(x) = P (x) + e(x) + η(x) with P a linear function of space, e a smooth spatial process, and η white noise (nugget). λ is the only hyper-parameter As λ, the posterior surface tends toward just the linear function. As λ 0, the posterior surface will fit the data more closely.
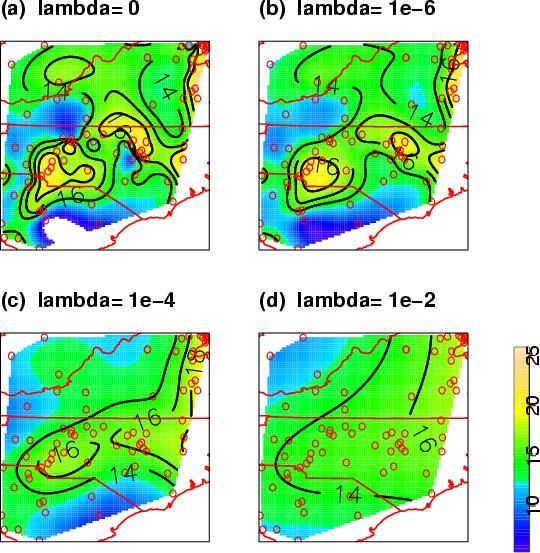
35
36 log of joint distribution n i=1 l GPD (y(x i, t), σ(x i ), ξ) λ(σ Xβ) T K 1 (σ Xβ)/2 log( λk ) + C K is the covariance for the prior on σ at the observations. This is a penalized likelihood: The penalty on σ results from the covariance and smoothing parameter λ.

37 Spatial extension for extremes
38 Spatial extension for extremes [1] "NCozmax8 fit to Generalised Pareto Distribution (GPD) at individual locations (grid points)." scale shape N mean Std.Dev min Q median Q max missing values

39 Probability of exceeding the standard
40 Conclusions for Ozone NAAQS Simplicity of the seasonal model approach is desirable. Daily model yields consistently lower MSE from leave-oneout cross validation. Daily model can account for complicated spatial features without resorting to non-standard techniques. Daily MPSE is consistently too optimistic. Extreme value models good alternative to modelling the tail of distributions. Two very different approaches yield similar results


41 Large-scale Indicators for Severe Weather Severe weather typically on fine scales Historical records limited Weak relationship with larger-scale phenomena CAPE (J/kg) shear (m/s) found to be indicative of conducive environments for severe weather (e.g., Brooks et al, 2003; Pocernic et al, in prep)
42 Global NCAR/NCEP Reanalysis Data All available observational data are synthesized with a static data assimilation process. Resolution o longitude by o latitude grid point locations ( grid) Temporal spacing every 6 hours 1958 through 1999 (42 years) Convective available potential energy (CAPE, J/kg) Magnitude of vector difference between surface and 6-km wind (shear, m/s) Both CAPE and shear 0 (Lots of zeros!)


43 Global NCAR/NCEP Reanalysis Data Upper quartiles for (42-yr) annual maximum CAPE (J/kg) shear (m/s)

44 Preliminary Analysis Extreme-value theory Bivariate extremes difficult because CAPE and shear tend not to be large together Nonstationary spatial structure Initial analysis: Fit GEV to individual grid points without worrying about spatial structure.
45 Generalized Extreme-Value (GEV) distribution The generalized Extreme Value Distribution (GEV) F GEV (z) = exp{ (1 + ξ (z µ)) 1/ξ + σ } Parameters: Location (µ), Scale (σ) and Shape (ξ). Notes about the GEV ξ < 0, Weibull, upper end-point at µ σ ξ ξ > 0, Fréchet, lower end-point at µ σ ξ (heavy tail) ξ = 0, Gumbel (light tail) Pr{max{X 1,..., X n } < z} F GEV (z)

46 Preliminary Analysis: Location Parameter

47 Preliminary Analysis: Scale Parameter

48 Preliminary Analysis: Shape Parameter
49 Preliminary Analysis Trend in location parameter: µ(year) = µ 0 + µ 1 year
 = µ 0 +")
50 Preliminary Analysis Trend in location parameter: µ(year) = µ 0 + µ 1 year

51 Preliminary Results Fig. from Pocernich et al (in prep)

52 Preliminary Results Significance? Significant + Not Significant Significant
53 Preliminary Results Likelihood-ratio tests for linear trend quadratic trend µ(year) = µ 0 + µ 1 (year) µ(year) = µ 0 + µ 1 year + µ 2 year 2


54 Preliminary Results 20-year return level differences { for linear/quadratic trend µ0 + µ 1 year µ(year) = µ 0 + µ 1 year + µ 2 year 2 z 1975 z 1962 z 1989 z 1962
55 Uncertainty Likelihood-ratio test Model fit Also want to know about uncertainty for return level differences δ method (shorter return periods) profile likelihood (longer return periods) not realistic for so many grid points Bootstrap Bayesian hierarchical model
56 Tanke wol! Developmental version of the spatial extension of extremes available at: Ozone data available at: ucar.edu
57 References Brooks HE, JW Lee, and JP Craven, 2003: The spatial distribution of severe thunderstorm and tornado environments from global reanalysis data. Atmos. Res., 67-8: Cooley D, D Nychka, P Naveau. (in press). Bayesian Spatial Modeling of Extreme Precipitation Return Levels. JASA. Cooley D, P Naveau, V Jomelli, A Rabatel, D Grancher, 2006a. A Bayesian hierarchical extreme value model for lichenometry. Environmetrics, 17(6): Cooley D, P Naveau, P Poncet, 2006b. Variograms for max-stable random fields. In Statistics for Dependent Data: Springer Lecture Notes in Statistics No Craigmile PF, N Cressie, TJ Santner, and Y Rao, A Loss function approach to identifying environmental exceedances. Extremes, 8(3): Gilleland E, D Nychka, and U Schneider, Spatial models for the distribution of extremes, Computational Statistics: Hierarchical Bayes and MCMC Methods in the Environmental Sciences, Edited by J.S. Clark and A. Gelfand. Oxford University Press. Gilleland E and D Nychka, Statistical models for monitoring and regulating ground-level ozone. Environmetrics 16: doi: /env.720 Pocernich M, E Gilleland, HE Brooks, and BG Brown, in prep. Identifying patterns and trends in severe storm environments using Re-analysis Data. Manuscript in Preparation Stephenson A and E Gilleland, Software for the Analysis of Extreme Events: The Current State and Future Directions, Extremes 8:
STATISTICAL MODELS FOR QUANTIFYING THE SPATIAL DISTRIBUTION OF SEASONALLY DERIVED OZONE STANDARDS
 STATISTICAL MODELS FOR QUANTIFYING THE SPATIAL DISTRIBUTION OF SEASONALLY DERIVED OZONE STANDARDS Eric Gilleland Douglas Nychka Geophysical Statistics Project National Center for Atmospheric Research Supported
Spatial Extremes in Atmospheric Problems
 Spatial Extremes in Atmospheric Problems Eric Gilleland Research Applications Laboratory (RAL) National Center for Atmospheric Research (NCAR), Boulder, Colorado, U.S.A. http://www.ral.ucar.edu/staff/ericg
Statistical Models for Monitoring and Regulating Ground-level Ozone. Abstract
 Statistical Models for Monitoring and Regulating Ground-level Ozone Eric Gilleland 1 and Douglas Nychka 2 Abstract The application of statistical techniques to environmental problems often involves a tradeoff
Extreme Value Analysis and Spatial Extremes
 Extreme Value Analysis and Department of Statistics Purdue University 11/07/2013 Outline Motivation 1 Motivation 2 Extreme Value Theorem and 3 Bayesian Hierarchical Models Copula Models Max-stable Models
Richard L. Smith Department of Statistics and Operations Research University of North Carolina Chapel Hill, NC
 EXTREME VALUE THEORY Richard L. Smith Department of Statistics and Operations Research University of North Carolina Chapel Hill, NC 27599-3260 rls@email.unc.edu AMS Committee on Probability and Statistics
Large-scale Indicators for Severe Weather
 Large-scale Indicators for Severe Weather Eric Gilleland Matthew Pocernich Harold E. Brooks Barbara G. Brown Patrick Marsh Abstract Trends in extreme values of a large-scale indicator for severe weather
Bayesian spatial quantile regression
 Brian J. Reich and Montserrat Fuentes North Carolina State University and David B. Dunson Duke University E-mail:reich@stat.ncsu.edu Tropospheric ozone Tropospheric ozone has been linked with several adverse
Statistics for extreme & sparse data
 Statistics for extreme & sparse data University of Bath December 6, 2018 Plan 1 2 3 4 5 6 The Problem Climate Change = Bad! 4 key problems Volcanic eruptions/catastrophic event prediction. Windstorms
Lecture 2 APPLICATION OF EXREME VALUE THEORY TO CLIMATE CHANGE. Rick Katz
 1 Lecture 2 APPLICATION OF EXREME VALUE THEORY TO CLIMATE CHANGE Rick Katz Institute for Study of Society and Environment National Center for Atmospheric Research Boulder, CO USA email: rwk@ucar.edu Home
SEVERE WEATHER UNDER A CHANGING CLIMATE: LARGE-SCALE INDICATORS OF EXTREME EVENTS
 SEVERE WEATHER UNDER A CHANGING CLIMATE: LARGE-SCALE INDICATORS OF EXTREME EVENTS Matthew Heaton 1, Matthias Katzfuß 2, Yi Li 3, Kathryn Pedings 4, Shahla Ramachandar 5 Problem Presenter: Dr. Eric Gilleland
Models for Spatial Extremes. Dan Cooley Department of Statistics Colorado State University. Work supported in part by NSF-DMS
 Models for Spatial Extremes Dan Cooley Department of Statistics Colorado State University Work supported in part by NSF-DMS 0905315 Outline 1. Introduction Statistics for Extremes Climate and Weather 2.
RISK AND EXTREMES: ASSESSING THE PROBABILITIES OF VERY RARE EVENTS
 RISK AND EXTREMES: ASSESSING THE PROBABILITIES OF VERY RARE EVENTS Richard L. Smith Department of Statistics and Operations Research University of North Carolina Chapel Hill, NC 27599-3260 rls@email.unc.edu
A short introduction to INLA and R-INLA
 A short introduction to INLA and R-INLA Integrated Nested Laplace Approximation Thomas Opitz, BioSP, INRA Avignon Workshop: Theory and practice of INLA and SPDE November 7, 2018 2/21 Plan for this talk
HIERARCHICAL MODELS IN EXTREME VALUE THEORY
 HIERARCHICAL MODELS IN EXTREME VALUE THEORY Richard L. Smith Department of Statistics and Operations Research, University of North Carolina, Chapel Hill and Statistical and Applied Mathematical Sciences
Extreme Precipitation: An Application Modeling N-Year Return Levels at the Station Level
 Extreme Precipitation: An Application Modeling N-Year Return Levels at the Station Level Presented by: Elizabeth Shamseldin Joint work with: Richard Smith, Doug Nychka, Steve Sain, Dan Cooley Statistics
Zwiers FW and Kharin VV Changes in the extremes of the climate simulated by CCC GCM2 under CO 2 doubling. J. Climate 11:
 Statistical Analysis of EXTREMES in GEOPHYSICS Zwiers FW and Kharin VV. 1998. Changes in the extremes of the climate simulated by CCC GCM2 under CO 2 doubling. J. Climate 11:2200 2222. http://www.ral.ucar.edu/staff/ericg/readinggroup.html
North American Weather and Climate Extremes
 North American Weather and Climate Extremes Question V. What do we understand about future changes? L. O. Mearns, NCAR Aspen Global Change Institute July 17, 2005 Question 5 Subtopics How do models simulate
Bayesian data analysis in practice: Three simple examples
 Bayesian data analysis in practice: Three simple examples Martin P. Tingley Introduction These notes cover three examples I presented at Climatea on 5 October 0. Matlab code is available by request to
ASSESMENT OF THE SEVERE WEATHER ENVIROMENT IN NORTH AMERICA SIMULATED BY A GLOBAL CLIMATE MODEL
 JP2.9 ASSESMENT OF THE SEVERE WEATHER ENVIROMENT IN NORTH AMERICA SIMULATED BY A GLOBAL CLIMATE MODEL Patrick T. Marsh* and David J. Karoly School of Meteorology, University of Oklahoma, Norman OK and
RISK ANALYSIS AND EXTREMES
 RISK ANALYSIS AND EXTREMES Richard L. Smith Department of Statistics and Operations Research University of North Carolina Chapel Hill, NC 27599-3260 rls@email.unc.edu Opening Workshop SAMSI program on
Bayesian hierarchical modelling for data assimilation of past observations and numerical model forecasts
 Bayesian hierarchical modelling for data assimilation of past observations and numerical model forecasts Stan Yip Exeter Climate Systems, University of Exeter c.y.yip@ex.ac.uk Joint work with Sujit Sahu
9 th International Extreme Value Analysis Conference Ann Arbor, Michigan. 15 June 2015
 Severe Storm Environments and Extreme Value Analysis Eric Gilleland Research Applications Laboratory Weather and Climate Impacts Assessment Science Project http://www.assessment.ucar.edu/ 9 th International
EXTREMAL MODELS AND ENVIRONMENTAL APPLICATIONS. Rick Katz
 1 EXTREMAL MODELS AND ENVIRONMENTAL APPLICATIONS Rick Katz Institute for Study of Society and Environment National Center for Atmospheric Research Boulder, CO USA email: rwk@ucar.edu Home page: www.isse.ucar.edu/hp_rick/
ESTIMATING THE MEAN LEVEL OF FINE PARTICULATE MATTER: AN APPLICATION OF SPATIAL STATISTICS
 ESTIMATING THE MEAN LEVEL OF FINE PARTICULATE MATTER: AN APPLICATION OF SPATIAL STATISTICS Richard L. Smith Department of Statistics and Operations Research University of North Carolina Chapel Hill, N.C.,
FORECAST VERIFICATION OF EXTREMES: USE OF EXTREME VALUE THEORY
 1 FORECAST VERIFICATION OF EXTREMES: USE OF EXTREME VALUE THEORY Rick Katz Institute for Study of Society and Environment National Center for Atmospheric Research Boulder, CO USA Email: rwk@ucar.edu Web
A Framework for Daily Spatio-Temporal Stochastic Weather Simulation
 A Framework for Daily Spatio-Temporal Stochastic Weather Simulation, Rick Katz, Balaji Rajagopalan Geophysical Statistics Project Institute for Mathematics Applied to Geosciences National Center for Atmospheric
Parameter Estimation in the Spatio-Temporal Mixed Effects Model Analysis of Massive Spatio-Temporal Data Sets
 Parameter Estimation in the Spatio-Temporal Mixed Effects Model Analysis of Massive Spatio-Temporal Data Sets Matthias Katzfuß Advisor: Dr. Noel Cressie Department of Statistics The Ohio State University
Two practical tools for rainfall weather generators
 Two practical tools for rainfall weather generators Philippe Naveau naveau@lsce.ipsl.fr Laboratoire des Sciences du Climat et l Environnement (LSCE) Gif-sur-Yvette, France FP7-ACQWA, GIS-PEPER, MIRACLE
Climate Change: the Uncertainty of Certainty
 Climate Change: the Uncertainty of Certainty Reinhard Furrer, UZH JSS, Geneva Oct. 30, 2009 Collaboration with: Stephan Sain - NCAR Reto Knutti - ETHZ Claudia Tebaldi - Climate Central Ryan Ford, Doug
Threshold estimation in marginal modelling of spatially-dependent non-stationary extremes
 Threshold estimation in marginal modelling of spatially-dependent non-stationary extremes Philip Jonathan Shell Technology Centre Thornton, Chester philip.jonathan@shell.com Paul Northrop University College
NCAR Initiative on Weather and Climate Impact Assessment Science Extreme Events
 NCAR Initiative on Weather and Climate Impact Assessment Science Extreme Events Linda O. Mearns NCAR/ICTP MICE Poznan, January 2004 Elements of the Assessment Initiative www.esig.ucar.edu/assessment Characterizing
Modelling trends in the ocean wave climate for dimensioning of ships
 Modelling trends in the ocean wave climate for dimensioning of ships STK1100 lecture, University of Oslo Erik Vanem Motivation and background 2 Ocean waves and maritime safety Ships and other marine structures
Overview of Extreme Value Analysis (EVA)
") Overview of Extreme Value Analysis (EVA) Brian Reich North Carolina State University July 26, 2016 Rossbypalooza Chicago, IL Brian Reich Overview of Extreme Value Analysis (EVA) 1 / 24 Importance of extremes
Overview of Extreme Value Analysis (EVA) Brian Reich North Carolina State University July 26, 2016 Rossbypalooza Chicago, IL Brian Reich Overview of Extreme Value Analysis (EVA) 1 / 24 Importance of extremes
Spatial Statistics with Image Analysis. Outline. A Statistical Approach. Johan Lindström 1. Lund October 6, 2016
 Spatial Statistics Spatial Examples More Spatial Statistics with Image Analysis Johan Lindström 1 1 Mathematical Statistics Centre for Mathematical Sciences Lund University Lund October 6, 2016 Johan Lindström
Bayesian spatial hierarchical modeling for temperature extremes
 Bayesian spatial hierarchical modeling for temperature extremes Indriati Bisono Dr. Andrew Robinson Dr. Aloke Phatak Mathematics and Statistics Department The University of Melbourne Maths, Informatics
ANALYZING SEASONAL TO INTERANNUAL EXTREME WEATHER AND CLIMATE VARIABILITY WITH THE EXTREMES TOOLKIT. Eric Gilleland and Richard W.
 P2.15 ANALYZING SEASONAL TO INTERANNUAL EXTREME WEATHER AND CLIMATE VARIABILITY WITH THE EXTREMES TOOLKIT Eric Gilleland and Richard W. Katz Research Applications Laboratory, National Center for Atmospheric
Spatio-temporal modelling of daily air temperature in Catalonia
 Spatio-temporal modelling of daily air temperature in Catalonia M. Saez 1,, M.A. Barceló 1,, A. Tobias 3, D. Varga 1,4 and R. Ocaña-Riola 5 1 Research Group on Statistics, Applied Economics and Health
Bayesian dynamic modeling for large space-time weather datasets using Gaussian predictive processes
 Bayesian dynamic modeling for large space-time weather datasets using Gaussian predictive processes Alan Gelfand 1 and Andrew O. Finley 2 1 Department of Statistical Science, Duke University, Durham, North
Approximate Bayesian computation for spatial extremes via open-faced sandwich adjustment
 Approximate Bayesian computation for spatial extremes via open-faced sandwich adjustment Ben Shaby SAMSI August 3, 2010 Ben Shaby (SAMSI) OFS adjustment August 3, 2010 1 / 29 Outline 1 Introduction 2 Spatial
Gaussian Processes. Le Song. Machine Learning II: Advanced Topics CSE 8803ML, Spring 2012
 Gaussian Processes Le Song Machine Learning II: Advanced Topics CSE 8803ML, Spring 01 Pictorial view of embedding distribution Transform the entire distribution to expected features Feature space Feature
Lecture 25: Review. Statistics 104. April 23, Colin Rundel
 Lecture 25: Review Statistics 104 Colin Rundel April 23, 2012 Joint CDF F (x, y) = P [X x, Y y] = P [(X, Y ) lies south-west of the point (x, y)] Y (x,y) X Statistics 104 (Colin Rundel) Lecture 25 April
CLIMATE EXTREMES AND GLOBAL WARMING: A STATISTICIAN S PERSPECTIVE
 CLIMATE EXTREMES AND GLOBAL WARMING: A STATISTICIAN S PERSPECTIVE Richard L. Smith Department of Statistics and Operations Research University of North Carolina, Chapel Hill rls@email.unc.edu Statistics
Extremes of Severe Storm Environments under a Changing Climate
 American Journal of Climate Change, 2013, 2, 47-61 http://dx.doi.org/10.4236/ajcc.2013.23a005 Published Online September 2013 (http://www.scirp.org/journal/ajcc) Extremes of Severe Storm Environments under
Physician Performance Assessment / Spatial Inference of Pollutant Concentrations
 Physician Performance Assessment / Spatial Inference of Pollutant Concentrations Dawn Woodard Operations Research & Information Engineering Cornell University Johns Hopkins Dept. of Biostatistics, April
A Gaussian state-space model for wind fields in the North-East Atlantic
 A Gaussian state-space model for wind fields in the North-East Atlantic Julie BESSAC - Université de Rennes 1 with Pierre AILLIOT and Valï 1 rie MONBET 2 Juillet 2013 Plan Motivations 1 Motivations 2 Context
Bayesian covariate models in extreme value analysis
 Bayesian covariate models in extreme value analysis David Randell, Philip Jonathan, Kathryn Turnbull, Mathew Jones EVA 2015 Ann Arbor Copyright 2015 Shell Global Solutions (UK) EVA 2015 Ann Arbor June
Gaussian processes for spatial modelling in environmental health: parameterizing for flexibility vs. computational efficiency
 Gaussian processes for spatial modelling in environmental health: parameterizing for flexibility vs. computational efficiency Chris Paciorek March 11, 2005 Department of Biostatistics Harvard School of
A Spatio-Temporal Downscaler for Output From Numerical Models
 Supplementary materials for this article are available at 10.1007/s13253-009-0004-z. A Spatio-Temporal Downscaler for Output From Numerical Models Veronica J. BERROCAL,AlanE.GELFAND, and David M. HOLLAND
Non-gaussian spatiotemporal modeling
 Dec, 2008 1/ 37 Non-gaussian spatiotemporal modeling Thais C O da Fonseca Joint work with Prof Mark F J Steel Department of Statistics University of Warwick Dec, 2008 Dec, 2008 2/ 37 1 Introduction Motivation
A spatio-temporal model for extreme precipitation simulated by a climate model
 A spatio-temporal model for extreme precipitation simulated by a climate model Jonathan Jalbert Postdoctoral fellow at McGill University, Montréal Anne-Catherine Favre, Claude Bélisle and Jean-François
Sharp statistical tools Statistics for extremes
 Sharp statistical tools Statistics for extremes Georg Lindgren Lund University October 18, 2012 SARMA Background Motivation We want to predict outside the range of observations Sums, averages and proportions
STATISTICAL METHODS FOR RELATING TEMPERATURE EXTREMES TO LARGE-SCALE METEOROLOGICAL PATTERNS. Rick Katz
 1 STATISTICAL METHODS FOR RELATING TEMPERATURE EXTREMES TO LARGE-SCALE METEOROLOGICAL PATTERNS Rick Katz Institute for Mathematics Applied to Geosciences National Center for Atmospheric Research Boulder,
Bayesian dynamic modeling for large space-time weather datasets using Gaussian predictive processes
 Bayesian dynamic modeling for large space-time weather datasets using Gaussian predictive processes Andrew O. Finley 1 and Sudipto Banerjee 2 1 Department of Forestry & Department of Geography, Michigan
Bruno Sansó. Department of Applied Mathematics and Statistics University of California Santa Cruz bruno
 Bruno Sansó Department of Applied Mathematics and Statistics University of California Santa Cruz http://www.ams.ucsc.edu/ bruno Climate Models Climate Models use the equations of motion to simulate changes
Generalized additive modelling of hydrological sample extremes
 Generalized additive modelling of hydrological sample extremes Valérie Chavez-Demoulin 1 Joint work with A.C. Davison (EPFL) and Marius Hofert (ETHZ) 1 Faculty of Business and Economics, University of
Extreme Values on Spatial Fields p. 1/1
 Extreme Values on Spatial Fields Daniel Cooley Department of Applied Mathematics, University of Colorado at Boulder Geophysical Statistics Project, National Center for Atmospheric Research Philippe Naveau
Spatial Inference of Nitrate Concentrations in Groundwater
 Spatial Inference of Nitrate Concentrations in Groundwater Dawn Woodard Operations Research & Information Engineering Cornell University joint work with Robert Wolpert, Duke Univ. Dept. of Statistical
Models for spatial data (cont d) Types of spatial data. Types of spatial data (cont d) Hierarchical models for spatial data
 Types of spatial data. Types of spatial data (cont d) Hierarchical models for spatial data") Hierarchical models for spatial data Based on the book by Banerjee, Carlin and Gelfand Hierarchical Modeling and Analysis for Spatial Data, 2004. We focus on Chapters 1, 2 and 5. Geo-referenced data arise
Hierarchical models for spatial data Based on the book by Banerjee, Carlin and Gelfand Hierarchical Modeling and Analysis for Spatial Data, 2004. We focus on Chapters 1, 2 and 5. Geo-referenced data arise
Bayesian dynamic modeling for large space-time weather datasets using Gaussian predictive processes
 Bayesian dynamic modeling for large space-time weather datasets using Gaussian predictive processes Andrew O. Finley Department of Forestry & Department of Geography, Michigan State University, Lansing
Bayesian dynamic modeling for large space-time weather datasets using Gaussian predictive processes
 Bayesian dynamic modeling for large space-time weather datasets using Gaussian predictive processes Sudipto Banerjee 1 and Andrew O. Finley 2 1 Biostatistics, School of Public Health, University of Minnesota,
Probabilistic Graphical Models Lecture 20: Gaussian Processes
 Probabilistic Graphical Models Lecture 20: Gaussian Processes Andrew Gordon Wilson www.cs.cmu.edu/~andrewgw Carnegie Mellon University March 30, 2015 1 / 53 What is Machine Learning? Machine learning algorithms
MFM Practitioner Module: Quantitiative Risk Management. John Dodson. October 14, 2015
 MFM Practitioner Module: Quantitiative Risk Management October 14, 2015 The n-block maxima 1 is a random variable defined as M n max (X 1,..., X n ) for i.i.d. random variables X i with distribution function
A full scale, non stationary approach for the kriging of large spatio(-temporal) datasets
 datasets") A full scale, non stationary approach for the kriging of large spatio(-temporal) datasets Thomas Romary, Nicolas Desassis & Francky Fouedjio Mines ParisTech Centre de Géosciences, Equipe Géostatistique
A full scale, non stationary approach for the kriging of large spatio(-temporal) datasets Thomas Romary, Nicolas Desassis & Francky Fouedjio Mines ParisTech Centre de Géosciences, Equipe Géostatistique
Bayesian Point Process Modeling for Extreme Value Analysis, with an Application to Systemic Risk Assessment in Correlated Financial Markets
 Bayesian Point Process Modeling for Extreme Value Analysis, with an Application to Systemic Risk Assessment in Correlated Financial Markets Athanasios Kottas Department of Applied Mathematics and Statistics,
MULTIDIMENSIONAL COVARIATE EFFECTS IN SPATIAL AND JOINT EXTREMES
 MULTIDIMENSIONAL COVARIATE EFFECTS IN SPATIAL AND JOINT EXTREMES Philip Jonathan, Kevin Ewans, David Randell, Yanyun Wu philip.jonathan@shell.com www.lancs.ac.uk/ jonathan Wave Hindcasting & Forecasting
Comparing Non-informative Priors for Estimation and Prediction in Spatial Models
 Environmentrics 00, 1 12 DOI: 10.1002/env.XXXX Comparing Non-informative Priors for Estimation and Prediction in Spatial Models Regina Wu a and Cari G. Kaufman a Summary: Fitting a Bayesian model to spatial
Introduction to Bayesian Inference
 University of Pennsylvania EABCN Training School May 10, 2016 Bayesian Inference Ingredients of Bayesian Analysis: Likelihood function p(y φ) Prior density p(φ) Marginal data density p(y ) = p(y φ)p(φ)dφ
Introduction to Spatial Data and Models
 Introduction to Spatial Data and Models Sudipto Banerjee 1 and Andrew O. Finley 2 1 Biostatistics, School of Public Health, University of Minnesota, Minneapolis, Minnesota, U.S.A. 2 Department of Forestry
Spatial statistics, addition to Part I. Parameter estimation and kriging for Gaussian random fields
 Spatial statistics, addition to Part I. Parameter estimation and kriging for Gaussian random fields 1 Introduction Jo Eidsvik Department of Mathematical Sciences, NTNU, Norway. (joeid@math.ntnu.no) February
Financial Econometrics and Volatility Models Extreme Value Theory
 Financial Econometrics and Volatility Models Extreme Value Theory Eric Zivot May 3, 2010 1 Lecture Outline Modeling Maxima and Worst Cases The Generalized Extreme Value Distribution Modeling Extremes Over
Simple example of analysis on spatial-temporal data set
 Simple example of analysis on spatial-temporal data set I used the ground level ozone data in North Carolina (from Suhasini Subba Rao s website) The original data consists of 920 days of data over 72 locations
Chapter 4 - Fundamentals of spatial processes Lecture notes
 Chapter 4 - Fundamentals of spatial processes Lecture notes Geir Storvik January 21, 2013 STK4150 - Intro 2 Spatial processes Typically correlation between nearby sites Mostly positive correlation Negative
Lecture 13 Fundamentals of Bayesian Inference
 Lecture 13 Fundamentals of Bayesian Inference Dennis Sun Stats 253 August 11, 2014 Outline of Lecture 1 Bayesian Models 2 Modeling Correlations Using Bayes 3 The Universal Algorithm 4 BUGS 5 Wrapping Up
REGIONAL VARIABILITY OF CAPE AND DEEP SHEAR FROM THE NCEP/NCAR REANALYSIS ABSTRACT
 REGIONAL VARIABILITY OF CAPE AND DEEP SHEAR FROM THE NCEP/NCAR REANALYSIS VITTORIO A. GENSINI National Weather Center REU Program, Norman, Oklahoma Northern Illinois University, DeKalb, Illinois ABSTRACT
Generating gridded fields of extreme precipitation for large domains with a Bayesian hierarchical model
 Generating gridded fields of extreme precipitation for large domains with a Bayesian hierarchical model Cameron Bracken Department of Civil, Environmental and Architectural Engineering University of Colorado
Uncertainty and regional climate experiments
 Uncertainty and regional climate experiments Stephan R. Sain Geophysical Statistics Project Institute for Mathematics Applied to Geosciences National Center for Atmospheric Research Boulder, CO Linda Mearns,
Emma Simpson. 6 September 2013
 6 September 2013 Test What is? Beijing during periods of low and high air pollution Air pollution is composed of sulphur oxides, nitrogen oxides, carbon monoxide and particulates. Particulates are small
False Discovery Control in Spatial Multiple Testing
 False Discovery Control in Spatial Multiple Testing WSun 1,BReich 2,TCai 3, M Guindani 4, and A. Schwartzman 2 WNAR, June, 2012 1 University of Southern California 2 North Carolina State University 3 University
A STATISTICAL TECHNIQUE FOR MODELLING NON-STATIONARY SPATIAL PROCESSES
 A STATISTICAL TECHNIQUE FOR MODELLING NON-STATIONARY SPATIAL PROCESSES JOHN STEPHENSON 1, CHRIS HOLMES, KERRY GALLAGHER 1 and ALEXANDRE PINTORE 1 Dept. Earth Science and Engineering, Imperial College,
Bayesian Modelling of Extreme Rainfall Data
 Bayesian Modelling of Extreme Rainfall Data Elizabeth Smith A thesis submitted for the degree of Doctor of Philosophy at the University of Newcastle upon Tyne September 2005 UNIVERSITY OF NEWCASTLE Bayesian
Bayesian nonparametrics for multivariate extremes including censored data. EVT 2013, Vimeiro. Anne Sabourin. September 10, 2013
 Bayesian nonparametrics for multivariate extremes including censored data Anne Sabourin PhD advisors: Anne-Laure Fougères (Lyon 1), Philippe Naveau (LSCE, Saclay). Joint work with Benjamin Renard, IRSTEA,
Max-stable processes: Theory and Inference
 1/39 Max-stable processes: Theory and Inference Mathieu Ribatet Institute of Mathematics, EPFL Laboratory of Environmental Fluid Mechanics, EPFL joint work with Anthony Davison and Simone Padoan 2/39 Outline
Gaussian Process Regression
 Gaussian Process Regression 4F1 Pattern Recognition, 21 Carl Edward Rasmussen Department of Engineering, University of Cambridge November 11th - 16th, 21 Rasmussen (Engineering, Cambridge) Gaussian Process
Max-stable processes and annual maximum snow depth
 Max-stable processes and annual maximum snow depth Juliette Blanchet blanchet@slf.ch 6th International Conference on Extreme Value Analysis June 23-26, 2009 Outline Motivation Max-stable process - Schlather
Disease mapping with Gaussian processes
 EUROHEIS2 Kuopio, Finland 17-18 August 2010 Aki Vehtari (former Helsinki University of Technology) Department of Biomedical Engineering and Computational Science (BECS) Acknowledgments Researchers - Jarno
GENERALIZED LINEAR MODELING APPROACH TO STOCHASTIC WEATHER GENERATORS
 GENERALIZED LINEAR MODELING APPROACH TO STOCHASTIC WEATHER GENERATORS Rick Katz Institute for Study of Society and Environment National Center for Atmospheric Research Boulder, CO USA Joint work with Eva
IT S TIME FOR AN UPDATE EXTREME WAVES AND DIRECTIONAL DISTRIBUTIONS ALONG THE NEW SOUTH WALES COASTLINE
 IT S TIME FOR AN UPDATE EXTREME WAVES AND DIRECTIONAL DISTRIBUTIONS ALONG THE NEW SOUTH WALES COASTLINE M Glatz 1, M Fitzhenry 2, M Kulmar 1 1 Manly Hydraulics Laboratory, Department of Finance, Services
Reliability Monitoring Using Log Gaussian Process Regression
 COPYRIGHT 013, M. Modarres Reliability Monitoring Using Log Gaussian Process Regression Martin Wayne Mohammad Modarres PSA 013 Center for Risk and Reliability University of Maryland Department of Mechanical
NRCSE. Misalignment and use of deterministic models
 NRCSE Misalignment and use of deterministic models Work with Veronica Berrocal Peter Craigmile Wendy Meiring Paul Sampson Gregory Nikulin The choice of spatial scale some questions 1. Which spatial scale
Lecture: Gaussian Process Regression. STAT 6474 Instructor: Hongxiao Zhu
 Lecture: Gaussian Process Regression STAT 6474 Instructor: Hongxiao Zhu Motivation Reference: Marc Deisenroth s tutorial on Robot Learning. 2 Fast Learning for Autonomous Robots with Gaussian Processes
Introduction to Spatial Data and Models
 Introduction to Spatial Data and Models Sudipto Banerjee 1 and Andrew O. Finley 2 1 Department of Forestry & Department of Geography, Michigan State University, Lansing Michigan, U.S.A. 2 Biostatistics,
Models for models. Douglas Nychka Geophysical Statistics Project National Center for Atmospheric Research
 Models for models Douglas Nychka Geophysical Statistics Project National Center for Atmospheric Research Outline Statistical models and tools Spatial fields (Wavelets) Climate regimes (Regression and clustering)
A STATISTICAL APPROACH TO OPERATIONAL ATTRIBUTION
 A STATISTICAL APPROACH TO OPERATIONAL ATTRIBUTION Richard L. Smith Department of Statistics and Operations Research University of North Carolina Chapel Hill, NC 27599-3260, USA rls@email.unc.edu IDAG Meeting
Efficient adaptive covariate modelling for extremes
 Efficient adaptive covariate modelling for extremes Slides at www.lancs.ac.uk/ jonathan Matthew Jones, David Randell, Emma Ross, Elena Zanini, Philip Jonathan Copyright of Shell December 218 1 / 23 Structural
Wrapped Gaussian processes: a short review and some new results
 Wrapped Gaussian processes: a short review and some new results Giovanna Jona Lasinio 1, Gianluca Mastrantonio 2 and Alan Gelfand 3 1-Università Sapienza di Roma 2- Università RomaTRE 3- Duke University
Spatial smoothing using Gaussian processes
 Spatial smoothing using Gaussian processes Chris Paciorek paciorek@hsph.harvard.edu August 5, 2004 1 OUTLINE Spatial smoothing and Gaussian processes Covariance modelling Nonstationary covariance modelling
Modeling Real Estate Data using Quantile Regression
 Modeling Real Estate Data using Semiparametric Quantile Regression Department of Statistics University of Innsbruck September 9th, 2011 Overview 1 Application: 2 3 4 Hedonic regression data for house prices
Practical Bayesian Optimization of Machine Learning. Learning Algorithms
 Practical Bayesian Optimization of Machine Learning Algorithms CS 294 University of California, Berkeley Tuesday, April 20, 2016 Motivation Machine Learning Algorithms (MLA s) have hyperparameters that
An introduction to Bayesian statistics and model calibration and a host of related topics
 An introduction to Bayesian statistics and model calibration and a host of related topics Derek Bingham Statistics and Actuarial Science Simon Fraser University Cast of thousands have participated in the
Prediction for Max-Stable Processes via an Approximated Conditional Density
 Prediction for Max-Stable Processes via an Approximated Conditional Density Daniel Cooley 1 Richard A. Davis 2 Philippe Naveau 3 1 Department of Statistics Colorado State University, Fort Collins, CO USA