Spatial Extremes in Atmospheric Problems
|
|
|
- Victor Scott
- 5 years ago
- Views:
Transcription
, Boulder, Colorado, U.S.A. http://www.ral.ucar.")
1 Spatial Extremes in Atmospheric Problems Eric Gilleland Research Applications Laboratory (RAL) National Center for Atmospheric Research (NCAR), Boulder, Colorado, U.S.A. The 19th TIES Conference, Kelowna, BC Canada, 12 June 2008
2 Brief Overview of Spatial Extremes Methods Multivariate Extremes and max-stable processes Copulas (e.g., Renard and Lang, 2006; Mikosch, 2006, and ensuing discussions). Regional Frequency Analysis (RFA) Loss function approach (IWQSEL), e.g. Craigmile et al. (2006) Upcrossings (e.g., Åberg and Guttorp, 2008, and references therein) Bayesian (e.g., Casson and Coles, 1999; Cooley et al., 2007) Spatio-temporal Models (e.g., Davis and Mikosch, 2006; Wikle and Cressie, 1999) EVD with Spatial Model on Parameters
3 Brief Overview: Multivariate Extremes Coles (2001, chapter 8) Schlather and Tawn (2003) Max-stable processes Smith (1990, and references therein) Schlather (2002, and references therein) Cooley et al. (2006) Conditional approach Heffernan and Tawn (2004, and ensuing discussions), see also Mendes and Pericchi (2008)
4 Brief Overview: Regional Frequency Analysis (RFA) Hosking and Wallis (1997) Flood maps Daly et al. (2002) Daly et al. (1994) Sveinsson et al. (2002) Precipitation Schaefer (1990) Fowler et al. (2005) Fowler and Kilsby (2003)


5 North Carolina Three sites FHDA Fourth Highest Daily maximum 8-hr Average ozone
6 Spatial AR(1) Monte Carlo (Gilleland and Nychka, 2005) GPD with spatial model on scale parameter (Gilleland et al., 2006) Pr {FHDA 1997 > 80}
7 Spatial AR(1) Monte Carlo y(s; t) = σ(s)u(s; t) + µ(s; t) u(s; t) = ρ(s)u(s; t 1) + ε(s; t) ε( ; t) Gau (0, Σ)
8 Spatial AR(1) Monte Carlo Σ = [cov(s i, s j )], cov(s i, s j ) = ψ(h) (Stationary).
9 Spatial AR(1) Monte Carlo cov (u(s; t), u(s ; t τ)) = (ρ(s))τ 1 ρ 2 (s) 1 ρ 2 (s ) ψ(h), 1 ρ(s)ρ(s ) for τ 0. If ρ(s) = ρ, then cov (u(s; t), u(s ; t τ)) = ρ τ ψ(h).
10 Spatial AR(1) Monte Carlo
11 Spatial AR(1) Monte Carlo ψ(h) = α exp ) ) ( hθ1 +(1 α) exp ( hθ2
12 Spatial AR(1) Monte Carlo ) ψ(h) = α exp ( hθ1 ) + (1 α) exp ( hθ2 Here: ˆα 0.13 (±0.02), ˆθ 1 11 miles (±3.37 miles) and ˆθ miles (±16.89 miles). Uncertainty via parametric bootstrap.
13 Spatial AR(1) Monte Carlo Algorithm to predict FHDA at unobserved location(s), s Simulate u(s 0 ; t) for an entire ozone season (a) Interpolate spatially from u(s, 1) to get û(s 0, 1). (b) Also interpolate spatially to get ˆρ(s 0 ), ˆµ(s 0, ) and ˆσ(s 0 ). (c) Sample shocks at time t from [ε(s 0, t) ε(s, t)]. (d) Propagate AR(1) model.
14 Spatial AR(1) Monte Carlo Algorithm to predict FHDA at unobserved location, s Simulate u(s 0 ; t) for an entire ozone season. 2. Back transform ŷ(s 0, t) = û(s 0, t)ˆσ(s 0 ) + ˆµ(s 0, t) 3. Take fourth-highest value from Step Repeat Steps 1 through 3 many times to get a sample of FHDA at unobserved location(s).
15 Spatial AR(1) Monte Carlo Distribution for the AR(1) shocks [ε(s 0, t) ε(s, t)] (Step 1c) given by with and Gau(M, Σ) M = k (s 0, s)k 1 (s, s)ε(s, t) Σ = k (s 0, s 0 ) k (s 0, s)k 1 (s, s)k(s, s 0 ), where k(x, y) = [ψ(x i, y j )] the covariance matrix for two sets of spatial locations.

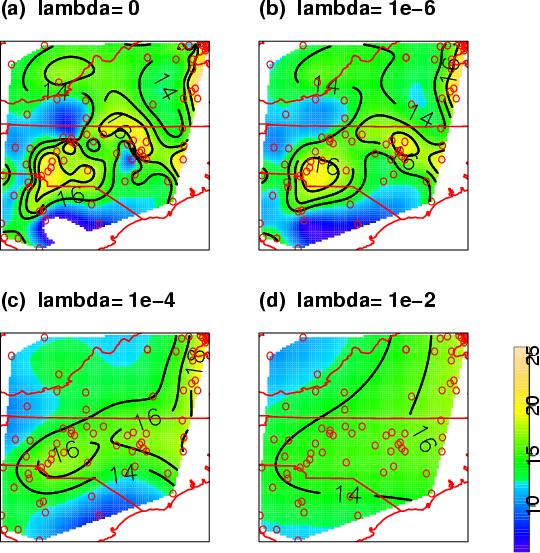
16 Spatial AR(1) Monte Carlo Results of predicting FHDA spatially with daily model (1997)
 Monte")
17 Spatial AR(1) Monte Carlo
18 GPD with spatial model on scale parameter Given a spatial process, Z(s), what can be said about when z is large? Pr{Z(s) > z}
19 GPD with spatial model on scale parameter Given a spatial process, Z(s), what can be said about when z is large? Pr{Z(s) > z} Note: This is not about dependence between Z(s) and Z(s ) this is another topic!
20 GPD with spatial model on scale parameter Given a spatial process, Z(s), what can be said about when z is large? Pr{Z(s) > z} Note: This is not about dependence between Z(s) and Z(s ) this is another topic! Spatial structure on parameters of distribution (not FHDA).

21 GPD with spatial model on scale parameter For a (large) threshold u, the GPD is given by Pr{X > x X > u} [1 + ξ (x u)] 1/ξ σ
22 GPD with spatial model on scale parameter Observation Model: y(s, t) surface ozone at location s and time t Spatial Process Model: Prior for hyperparameters: [y(s, t) σ(s), ξ(s), u, y(s, t) > u] [σ(s), ξ(s), u θ] [θ]
23 GPD with spatial model on scale parameter A Hierarchical Spatial Model Assume extreme observations to be conditionally independent so that the joint pdf for the data and parameters is [y(s i, t) σ(s), ξ(s), u, y(s i, t) > u] [σ(s), ξ(s), u θ] [θ] i,t t indexes time and i stations.
24 GPD with spatial model on scale parameter Shortcuts and Assumptions Assume threshold, u, fixed. ξ(s) = ξ (i.e., shape is constant over space). Justified by univariate fits. Assume σ(s) is a Gaussian process with isotropic Matérn covariance function. Fix Matérn smoothness parameter at ν = 2, and let the range be very large leaving only λ (ratio of variances of nugget and sill).
25 GPD with spatial model on scale parameter More on σ(s) σ(s) = P (s) + e(s) + η(s) with P a linear function of space, e a smooth spatial process, and η white noise (nugget). λ is the only hyper-parameter As λ, the posterior surface tends toward just the linear function. As λ 0, the posterior surface will fit the data more closely.
26
27 GPD with spatial model on scale parameter log of joint distribution n l GPD (y(s i, t), σ(s i ), ξ) i=1 λ(σ Xβ) T K 1 (σ Xβ)/2 log( λk ) + C K is the covariance for the prior on σ at the observations. This is a penalized likelihood: The penalty on σ results from the covariance and smoothing parameter λ.
28 Probability of exceeding the standard
29 Conclusions and Possible Extensions Spatial AR(1) Monte Carlo Each part simple, but can model relatively complex processes Lower CV than naïve approach assuming FHDA Gau(M, V ) Computationally intensive Prediction standard errors too optimistic? Let u(s; t) = ρ(s)u(s; t 1) + βε 1 (s; t) + (1 β)ε 2 (s; t) Allow ψ to be nonstationary for larger domains Incorporate meteorological covariates
30 Conclusions and Possible Extensions GPD with spatial model on scale parameter Simple extension to independent fits at each spatial location Compares relatively well with spatial AR(1) Monte Carlo approach Direct use of EVA More difficult if region is not homogeneous Does not model the underlying process spatially Apply spatial model to the return levels instead of the parameters Incorporate meteorological covariates
31 That s it... References will be posted on my web page at Questions/Comments
32 References Åberg, S. and P. Guttorp, 2008: Distribution of the maximum in air pollution fields. Environmetrics, 19, , doi: /env.866. Casson, E. and S. Coles, 1999: Spatial regression models for extremes. Extremes, 1, Coles, S., 2001: An introduction to statistical modeling of extreme values. Springer-Verlag, London, UK, 208 pp. Cooley, D., P. Naveau, and P. Poncet, 2006: Variograms for spatial max-stable random fields. In Dependence in Probability and Statistics. Ed. Bertail, P. and Doukhan, P. and Soulier, P. Springer Lecture Notes in Statistics no Cooley, D., D. Nychka, and P. Naveau, 2007: Bayesian spatial modeling of extreme precipitation return levels. J. Amer. Stat. Assoc., 102, Craigmile, P., N. Cressie, T. Santner, and Y. Rao, 2006: A loss function approach to identifying environmental exceedances. Extremes, 8, , doi: /s y. Daly, C., W. Gibson, G. Taylor, and P. Pasteris, 2002: A knowledge-based approach to the statistical mapping of climate. Climate Research, 23, Daly, C., R. Neilson, and D. Phillips, 1994: A statistical topographic model for mapping climatological precipitation in mountainous terrain. J. Appl. Meteorol., 33, Davis, R. and T. Mikosch, 2006: Extreme value theory for space-time processes with heavy-tailed distributions. Submitted (Available at: Fowler, H., M. Eskstrom, C. Kilsby, and P. Jones, 2005: New estimates of future changes in extreme rainfall across the uk using regional climate model integrations, part 1: Assessment of control climate. J. Hydrology, 300, Fowler, H. and C. Kilsby, 2003: A regional frequency analysis of united kingdom extreme rainfall from 1961 to International J. Climatol., 23, Gilleland, E. and D. Nychka, 2005: Statistical models for monitoring and regulating ground-level ozone. Environmetrics, 16, Gilleland, E., D. Nychka, and U. Schneider, 2006: Hierarchical modelling for the Environmental Sciences: statistical methods and applications, Eds. JS Clark and A Gelfand. Oxford University Press, New York, chapter Spatial models for the distribution of extremes Heffernan, J. and J. Tawn, 2004: A conditional approach for multivariate extreme values. J.R. Statist. Soc. B, 66, Hosking, J. and J. Wallis, 1997: Regional frequency analysis: An approach based on L-moments. Cambridge University Press, Cambridge, UK, 240 pp. Mendes, B. and L. Pericchi, 2008: Assessing conditional extremal risk of flooding in puerto rico. Stoch. Environ. Res. Risk. Assess., doi: /s z. Mikosch, T., 2006: Copulas: Tales and facts. Extremes, 9, 3 20, doi: /s x. Renard, B. and M. Lang, 2006: Use of a gaussian copula for multivariate extreme value analysis: Some case studies in hydrology. Advances in Water Resources, 30, , doi: /j.advwatres Schaefer, M., 1990: Regional analysis of precipitation annual maxima in washington state. Water Resources Research, 26, Schlather, M., 2002: Models for stationary max-stable random fields. Extremes, 5, Schlather, M. and J. Tawn, 2003: A dependence measure for multivariate and spatial extreme values: Properties and inference. Biometrika, 90, Smith, R., 1990: Max-stable processes and spatial extremes. Unpublished Manuscript (available at: Sveinsson, O., J. Salas, and D. Boes, 2002: Regional frequency analysis of extreme precipitation in northeastern colorado and fort collins flood of J. Hydrologic Engineering, 7,
33 Brief Overview: Multivariate Extremes General Formulation ( [ Mn1 (x 1 ) b n1 lim Pr n a n1 x 1,..., M nd(x d ) b n1 a n1 G(x 1,..., x d ), x d ]) = where x i = (x 1i,..., x ni ) are iid d dimensional random vectors, M ni (x i ) = max (x ji), a n1,..., a nd > 0 and b n1,..., b nd are j=1,...,n normalizing constants, and G is a non-degenerate d dimensional cdf.
34 Brief Overview: Multivariate Extremes General Formulation Simplify by assuming each x i has a standard Fréchet marginal cdf. Then, G(x 1,..., x d ) = exp{ V (x 1,..., x d )}, where V (x 1,..., x d ) = { } wj max dh(w 1,..., w d ) j=1,...,d x j
35 Brief Overview: Multivariate Extremes General Formulation Extremal coefficient measures dependence in the tails. θ = max w jdh(w 1,..., w d ) j=1,...,d
36 Brief Overview: Copulas General Formulation X = (X 1,..., X d ) a d dimensional random vector with cdf F (x 1,..., x d ) = Pr (X 1 x 1,..., X d x d ). A copula is a function, c, s.t. c : [0, 1] d [0, 1] and F (x 1,..., x d ) = c(f 1 (x 1 ),..., F d (x d ))
37 Brief Overview: Copulas Assuming the marginal distributions F i, then c exists, and if the F i s are continuous, then c is unique. The dependence structure of X can be reconstructed from the copula and the F i s.
38 Brief Overview: Regional Frequency Analysis (RFA) General Formulation Multiple-step procedure: 1. Determine relatively homogeneous regions. 2. Normalize annual maxima series by an index (flood) measure. 3. Fit a distribution (e.g., GEV) to pooled dimensionless sample. 4. Scale distribution from 3 by indexes from 2 to get local distributions.
39 Brief Overview: Regional Frequency Analysis (RFA) L-moments used for parameter estimation. Criteria based on L-moments are suggested for selecting homogeneous regions and for choosing a probability distribution. Uncertainty obtained via bootstrap methods.
Extremes and Atmospheric Data
 Extremes and Atmospheric Data Eric Gilleland Research Applications Laboratory National Center for Atmospheric Research 2007-08 Program on Risk Analysis, Extreme Events and Decision Theory, opening workshop
STATISTICAL MODELS FOR QUANTIFYING THE SPATIAL DISTRIBUTION OF SEASONALLY DERIVED OZONE STANDARDS
 STATISTICAL MODELS FOR QUANTIFYING THE SPATIAL DISTRIBUTION OF SEASONALLY DERIVED OZONE STANDARDS Eric Gilleland Douglas Nychka Geophysical Statistics Project National Center for Atmospheric Research Supported
Extreme Value Analysis and Spatial Extremes
 Extreme Value Analysis and Department of Statistics Purdue University 11/07/2013 Outline Motivation 1 Motivation 2 Extreme Value Theorem and 3 Bayesian Hierarchical Models Copula Models Max-stable Models
Statistical Models for Monitoring and Regulating Ground-level Ozone. Abstract
 Statistical Models for Monitoring and Regulating Ground-level Ozone Eric Gilleland 1 and Douglas Nychka 2 Abstract The application of statistical techniques to environmental problems often involves a tradeoff
A Conditional Approach to Modeling Multivariate Extremes
 A Approach to ing Multivariate Extremes By Heffernan & Tawn Department of Statistics Purdue University s April 30, 2014 Outline s s Multivariate Extremes s A central aim of multivariate extremes is trying
Richard L. Smith Department of Statistics and Operations Research University of North Carolina Chapel Hill, NC
 EXTREME VALUE THEORY Richard L. Smith Department of Statistics and Operations Research University of North Carolina Chapel Hill, NC 27599-3260 rls@email.unc.edu AMS Committee on Probability and Statistics
Zwiers FW and Kharin VV Changes in the extremes of the climate simulated by CCC GCM2 under CO 2 doubling. J. Climate 11:
 Statistical Analysis of EXTREMES in GEOPHYSICS Zwiers FW and Kharin VV. 1998. Changes in the extremes of the climate simulated by CCC GCM2 under CO 2 doubling. J. Climate 11:2200 2222. http://www.ral.ucar.edu/staff/ericg/readinggroup.html
Overview of Extreme Value Theory. Dr. Sawsan Hilal space
 Overview of Extreme Value Theory Dr. Sawsan Hilal space Maths Department - University of Bahrain space November 2010 Outline Part-1: Univariate Extremes Motivation Threshold Exceedances Part-2: Bivariate
Models for Spatial Extremes. Dan Cooley Department of Statistics Colorado State University. Work supported in part by NSF-DMS
 Models for Spatial Extremes Dan Cooley Department of Statistics Colorado State University Work supported in part by NSF-DMS 0905315 Outline 1. Introduction Statistics for Extremes Climate and Weather 2.
Bayesian Spatial Modeling of Extreme Precipitation Return Levels
 Bayesian Spatial Modeling of Extreme Precipitation Return Levels Daniel Cooley 1,2 Doug Nychka 2 Philippe Naveau 3,4 1 Department of Statistics Colorado State University, Fort Collins, CO 2 Geophysical
HIERARCHICAL MODELS IN EXTREME VALUE THEORY
 HIERARCHICAL MODELS IN EXTREME VALUE THEORY Richard L. Smith Department of Statistics and Operations Research, University of North Carolina, Chapel Hill and Statistical and Applied Mathematical Sciences
Generating gridded fields of extreme precipitation for large domains with a Bayesian hierarchical model
 Generating gridded fields of extreme precipitation for large domains with a Bayesian hierarchical model Cameron Bracken Department of Civil, Environmental and Architectural Engineering University of Colorado
Spatial Statistics with Image Analysis. Lecture L02. Computer exercise 0 Daily Temperature. Lecture 2. Johan Lindström.
 C Stochastic fields Covariance Spatial Statistics with Image Analysis Lecture 2 Johan Lindström November 4, 26 Lecture L2 Johan Lindström - johanl@maths.lth.se FMSN2/MASM2 L /2 C Stochastic fields Covariance
RISK AND EXTREMES: ASSESSING THE PROBABILITIES OF VERY RARE EVENTS
 RISK AND EXTREMES: ASSESSING THE PROBABILITIES OF VERY RARE EVENTS Richard L. Smith Department of Statistics and Operations Research University of North Carolina Chapel Hill, NC 27599-3260 rls@email.unc.edu
Bayesian Inference for Clustered Extremes
 Newcastle University, Newcastle-upon-Tyne, U.K. lee.fawcett@ncl.ac.uk 20th TIES Conference: Bologna, Italy, July 2009 Structure of this talk 1. Motivation and background 2. Review of existing methods Limitations/difficulties
RISK ANALYSIS AND EXTREMES
 RISK ANALYSIS AND EXTREMES Richard L. Smith Department of Statistics and Operations Research University of North Carolina Chapel Hill, NC 27599-3260 rls@email.unc.edu Opening Workshop SAMSI program on
Extreme Precipitation: An Application Modeling N-Year Return Levels at the Station Level
 Extreme Precipitation: An Application Modeling N-Year Return Levels at the Station Level Presented by: Elizabeth Shamseldin Joint work with: Richard Smith, Doug Nychka, Steve Sain, Dan Cooley Statistics
Bayesian Modelling of Extreme Rainfall Data
 Bayesian Modelling of Extreme Rainfall Data Elizabeth Smith A thesis submitted for the degree of Doctor of Philosophy at the University of Newcastle upon Tyne September 2005 UNIVERSITY OF NEWCASTLE Bayesian
Models for spatial data (cont d) Types of spatial data. Types of spatial data (cont d) Hierarchical models for spatial data
 Types of spatial data. Types of spatial data (cont d) Hierarchical models for spatial data") Hierarchical models for spatial data Based on the book by Banerjee, Carlin and Gelfand Hierarchical Modeling and Analysis for Spatial Data, 2004. We focus on Chapters 1, 2 and 5. Geo-referenced data arise
Hierarchical models for spatial data Based on the book by Banerjee, Carlin and Gelfand Hierarchical Modeling and Analysis for Spatial Data, 2004. We focus on Chapters 1, 2 and 5. Geo-referenced data arise
Prediction for Max-Stable Processes via an Approximated Conditional Density
 Prediction for Max-Stable Processes via an Approximated Conditional Density Daniel Cooley 1 Richard A. Davis 2 Philippe Naveau 3 1 Department of Statistics Colorado State University, Fort Collins, CO USA
Bayesian nonparametrics for multivariate extremes including censored data. EVT 2013, Vimeiro. Anne Sabourin. September 10, 2013
 Bayesian nonparametrics for multivariate extremes including censored data Anne Sabourin PhD advisors: Anne-Laure Fougères (Lyon 1), Philippe Naveau (LSCE, Saclay). Joint work with Benjamin Renard, IRSTEA,
A Framework for Daily Spatio-Temporal Stochastic Weather Simulation
 A Framework for Daily Spatio-Temporal Stochastic Weather Simulation, Rick Katz, Balaji Rajagopalan Geophysical Statistics Project Institute for Mathematics Applied to Geosciences National Center for Atmospheric
Lecture 2 APPLICATION OF EXREME VALUE THEORY TO CLIMATE CHANGE. Rick Katz
 1 Lecture 2 APPLICATION OF EXREME VALUE THEORY TO CLIMATE CHANGE Rick Katz Institute for Study of Society and Environment National Center for Atmospheric Research Boulder, CO USA email: rwk@ucar.edu Home
Continuous Spatial Process Models for Spatial Extreme Values
 Continuous Spatial Process Models for Spatial Extreme Values HUIYAN SANG AND ALAN E. GELFAND We propose a hierarchical modeling approach for explaining a collection of point-referenced extreme values.
MULTIVARIATE EXTREMES AND RISK
 MULTIVARIATE EXTREMES AND RISK Richard L. Smith Department of Statistics and Operations Research University of North Carolina Chapel Hill, NC 27599-3260 rls@email.unc.edu Interface 2008 RISK: Reality Durham,
CONTAGION VERSUS FLIGHT TO QUALITY IN FINANCIAL MARKETS
 EVA IV, CONTAGION VERSUS FLIGHT TO QUALITY IN FINANCIAL MARKETS Jose Olmo Department of Economics City University, London (joint work with Jesús Gonzalo, Universidad Carlos III de Madrid) 4th Conference
Generalized additive modelling of hydrological sample extremes
 Generalized additive modelling of hydrological sample extremes Valérie Chavez-Demoulin 1 Joint work with A.C. Davison (EPFL) and Marius Hofert (ETHZ) 1 Faculty of Business and Economics, University of
Bayesian Point Process Modeling for Extreme Value Analysis, with an Application to Systemic Risk Assessment in Correlated Financial Markets
 Bayesian Point Process Modeling for Extreme Value Analysis, with an Application to Systemic Risk Assessment in Correlated Financial Markets Athanasios Kottas Department of Applied Mathematics and Statistics,
Chapter 4 - Fundamentals of spatial processes Lecture notes
 Chapter 4 - Fundamentals of spatial processes Lecture notes Geir Storvik January 21, 2013 STK4150 - Intro 2 Spatial processes Typically correlation between nearby sites Mostly positive correlation Negative
Geostatistical Modeling for Large Data Sets: Low-rank methods
 Geostatistical Modeling for Large Data Sets: Low-rank methods Whitney Huang, Kelly-Ann Dixon Hamil, and Zizhuang Wu Department of Statistics Purdue University February 22, 2016 Outline Motivation Low-rank
Semi-parametric estimation of non-stationary Pickands functions
 Semi-parametric estimation of non-stationary Pickands functions Linda Mhalla 1 Joint work with: Valérie Chavez-Demoulin 2 and Philippe Naveau 3 1 Geneva School of Economics and Management, University of
L-momenty s rušivou regresí
 L-momenty s rušivou regresí Jan Picek, Martin Schindler e-mail: jan.picek@tul.cz TECHNICKÁ UNIVERZITA V LIBERCI ROBUST 2016 J. Picek, M. Schindler, TUL L-momenty s rušivou regresí 1/26 Motivation 1 Development
Bayesian spatial quantile regression
 Brian J. Reich and Montserrat Fuentes North Carolina State University and David B. Dunson Duke University E-mail:reich@stat.ncsu.edu Tropospheric ozone Tropospheric ozone has been linked with several adverse
STAT 518 Intro Student Presentation
 STAT 518 Intro Student Presentation Wen Wei Loh April 11, 2013 Title of paper Radford M. Neal [1999] Bayesian Statistics, 6: 475-501, 1999 What the paper is about Regression and Classification Flexible
Chapter 4 - Fundamentals of spatial processes Lecture notes
 TK4150 - Intro 1 Chapter 4 - Fundamentals of spatial processes Lecture notes Odd Kolbjørnsen and Geir Storvik January 30, 2017 STK4150 - Intro 2 Spatial processes Typically correlation between nearby sites
The extremal elliptical model: Theoretical properties and statistical inference
 1/25 The extremal elliptical model: Theoretical properties and statistical inference Thomas OPITZ Supervisors: Jean-Noel Bacro, Pierre Ribereau Institute of Mathematics and Modeling in Montpellier (I3M)
Hierarchical Modeling for Univariate Spatial Data
 Hierarchical Modeling for Univariate Spatial Data Geography 890, Hierarchical Bayesian Models for Environmental Spatial Data Analysis February 15, 2011 1 Spatial Domain 2 Geography 890 Spatial Domain This
A comparison of U.S. precipitation extremes under two climate change scenarios
 A comparison of U.S. precipitation extremes under two climate change scenarios Miranda Fix 1 Dan Cooley 1 Steve Sain 2 Claudia Tebaldi 3 1 Department of Statistics, Colorado State University 2 The Climate
ANALYZING SEASONAL TO INTERANNUAL EXTREME WEATHER AND CLIMATE VARIABILITY WITH THE EXTREMES TOOLKIT. Eric Gilleland and Richard W.
 P2.15 ANALYZING SEASONAL TO INTERANNUAL EXTREME WEATHER AND CLIMATE VARIABILITY WITH THE EXTREMES TOOLKIT Eric Gilleland and Richard W. Katz Research Applications Laboratory, National Center for Atmospheric
ESTIMATING THE MEAN LEVEL OF FINE PARTICULATE MATTER: AN APPLICATION OF SPATIAL STATISTICS
 ESTIMATING THE MEAN LEVEL OF FINE PARTICULATE MATTER: AN APPLICATION OF SPATIAL STATISTICS Richard L. Smith Department of Statistics and Operations Research University of North Carolina Chapel Hill, N.C.,
Gaussian Processes. Le Song. Machine Learning II: Advanced Topics CSE 8803ML, Spring 2012
 Gaussian Processes Le Song Machine Learning II: Advanced Topics CSE 8803ML, Spring 01 Pictorial view of embedding distribution Transform the entire distribution to expected features Feature space Feature
Hierarchical Modelling for Univariate Spatial Data
 Hierarchical Modelling for Univariate Spatial Data Sudipto Banerjee 1 and Andrew O. Finley 2 1 Biostatistics, School of Public Health, University of Minnesota, Minneapolis, Minnesota, U.S.A. 2 Department
A space-time skew-t model for threshold exceedances
 BIOMETRICS 000, 1 20 DOI: 000 000 0000 A space-time skew-t model for threshold exceedances Samuel A Morris 1,, Brian J Reich 1, Emeric Thibaud 2, and Daniel Cooley 2 1 Department of Statistics, North Carolina
Bayesian hierarchical modelling of rainfall extremes
 Bayesian hierarchical modelling of rainfall extremes E.A. Lehmann a, A. Phatak a, S. Soltyk b, J. Chia a, R. Lau a and M. Palmer c a CSIRO Computational Informatics, Perth, WA, AUSTRALIA b Curtin University
Estimation of spatial max-stable models using threshold exceedances
 Estimation of spatial max-stable models using threshold exceedances arxiv:1205.1107v1 [stat.ap] 5 May 2012 Jean-Noel Bacro I3M, Université Montpellier II and Carlo Gaetan DAIS, Università Ca Foscari -
Nonstationary spatial process modeling Part II Paul D. Sampson --- Catherine Calder Univ of Washington --- Ohio State University
 Nonstationary spatial process modeling Part II Paul D. Sampson --- Catherine Calder Univ of Washington --- Ohio State University this presentation derived from that presented at the Pan-American Advanced
Climate Change: the Uncertainty of Certainty
 Climate Change: the Uncertainty of Certainty Reinhard Furrer, UZH JSS, Geneva Oct. 30, 2009 Collaboration with: Stephan Sain - NCAR Reto Knutti - ETHZ Claudia Tebaldi - Climate Central Ryan Ford, Doug
Nonparametric Spatial Models for Extremes: Application to Extreme Temperature Data.
 Nonparametric Spatial Models for Extremes: Application to Extreme Temperature Data. Montserrat Fuentes, John Henry, and Brian Reich SUMMARY Estimating the probability of extreme temperature events is difficult
Introduction to Spatial Data and Models
 Introduction to Spatial Data and Models Sudipto Banerjee 1 and Andrew O. Finley 2 1 Biostatistics, School of Public Health, University of Minnesota, Minneapolis, Minnesota, U.S.A. 2 Department of Forestry
APPLICATION OF EXTREMAL THEORY TO THE PRECIPITATION SERIES IN NORTHERN MORAVIA
 APPLICATION OF EXTREMAL THEORY TO THE PRECIPITATION SERIES IN NORTHERN MORAVIA DANIELA JARUŠKOVÁ Department of Mathematics, Czech Technical University, Prague; jarus@mat.fsv.cvut.cz 1. Introduction The
Sharp statistical tools Statistics for extremes
 Sharp statistical tools Statistics for extremes Georg Lindgren Lund University October 18, 2012 SARMA Background Motivation We want to predict outside the range of observations Sums, averages and proportions
Statistical modelling of spatial extremes using the SpatialExtremes package
 Statistical modelling of spatial extremes using the SpatialExtremes package M. Ribatet University of Montpellier TheSpatialExtremes package Mathieu Ribatet 1 / 39 Rationale for thespatialextremes package
Multivariate Non-Normally Distributed Random Variables
 Multivariate Non-Normally Distributed Random Variables An Introduction to the Copula Approach Workgroup seminar on climate dynamics Meteorological Institute at the University of Bonn 18 January 2008, Bonn
Modeling daily precipitation in Space and Time
 Space and Time SWGen - Hydro Berlin 20 September 2017 temporal - dependence Outline temporal - dependence temporal - dependence Stochastic Weather Generator Stochastic Weather Generator (SWG) is a stochastic
Max-stable processes: Theory and Inference
 1/39 Max-stable processes: Theory and Inference Mathieu Ribatet Institute of Mathematics, EPFL Laboratory of Environmental Fluid Mechanics, EPFL joint work with Anthony Davison and Simone Padoan 2/39 Outline
Hierarchical Modelling for Univariate and Multivariate Spatial Data
 Hierarchical Modelling for Univariate and Multivariate Spatial Data p. 1/4 Hierarchical Modelling for Univariate and Multivariate Spatial Data Sudipto Banerjee sudiptob@biostat.umn.edu University of Minnesota
Modeling Extreme Events in Spatial Domain by Copula Graphical Models
 Modeling Extreme Events in Spatial Domain by Copula Graphical Models Hang Yu, Zheng Choo, Wayne Isaac T. Uy, Justin Dauwels, and Philip Jonathan School of Electrical and Electronics Engineering, School
Gaussian predictive process models for large spatial data sets.
 Gaussian predictive process models for large spatial data sets. Sudipto Banerjee, Alan E. Gelfand, Andrew O. Finley, and Huiyan Sang Presenters: Halley Brantley and Chris Krut September 28, 2015 Overview
Statistics for extreme & sparse data
 Statistics for extreme & sparse data University of Bath December 6, 2018 Plan 1 2 3 4 5 6 The Problem Climate Change = Bad! 4 key problems Volcanic eruptions/catastrophic event prediction. Windstorms
MULTIDIMENSIONAL COVARIATE EFFECTS IN SPATIAL AND JOINT EXTREMES
 MULTIDIMENSIONAL COVARIATE EFFECTS IN SPATIAL AND JOINT EXTREMES Philip Jonathan, Kevin Ewans, David Randell, Yanyun Wu philip.jonathan@shell.com www.lancs.ac.uk/ jonathan Wave Hindcasting & Forecasting
Wrapped Gaussian processes: a short review and some new results
 Wrapped Gaussian processes: a short review and some new results Giovanna Jona Lasinio 1, Gianluca Mastrantonio 2 and Alan Gelfand 3 1-Università Sapienza di Roma 2- Università RomaTRE 3- Duke University
Modeling Spatial Extreme Events using Markov Random Field Priors
 Modeling Spatial Extreme Events using Markov Random Field Priors Hang Yu, Zheng Choo, Justin Dauwels, Philip Jonathan, and Qiao Zhou School of Electrical and Electronics Engineering, School of Physical
MFM Practitioner Module: Quantitiative Risk Management. John Dodson. October 14, 2015
 MFM Practitioner Module: Quantitiative Risk Management October 14, 2015 The n-block maxima 1 is a random variable defined as M n max (X 1,..., X n ) for i.i.d. random variables X i with distribution function
Can a regional climate model reproduce observed extreme temperatures? Peter F. Craigmile
 Can a regional climate model reproduce observed extreme temperatures? Peter F. Craigmile http://www.stat.osu.edu/~pfc/ Workshop on the analysis of environmental extremes, The Pennsylvania State University,
Two practical tools for rainfall weather generators
 Two practical tools for rainfall weather generators Philippe Naveau naveau@lsce.ipsl.fr Laboratoire des Sciences du Climat et l Environnement (LSCE) Gif-sur-Yvette, France FP7-ACQWA, GIS-PEPER, MIRACLE
R.Garçon, F.Garavaglia, J.Gailhard, E.Paquet, F.Gottardi EDF-DTG
 Homogeneous samples and reliability of probabilistic models : using an atmospheric circulation patterns sampling for a better estimation of extreme rainfall probability R.Garçon, F.Garavaglia, J.Gailhard,
Introduction to Spatial Data and Models
 Introduction to Spatial Data and Models Sudipto Banerjee 1 and Andrew O. Finley 2 1 Department of Forestry & Department of Geography, Michigan State University, Lansing Michigan, U.S.A. 2 Biostatistics,
Some conditional extremes of a Markov chain
 Some conditional extremes of a Markov chain Seminar at Edinburgh University, November 2005 Adam Butler, Biomathematics & Statistics Scotland Jonathan Tawn, Lancaster University Acknowledgements: Janet
A HIERARCHICAL MAX-STABLE SPATIAL MODEL FOR EXTREME PRECIPITATION
 Submitted to the Annals of Applied Statistics arxiv: arxiv:0000.0000 A HIERARCHICAL MAX-STABLE SPATIAL MODEL FOR EXTREME PRECIPITATION By Brian J. Reich and Benjamin A. Shaby North Carolina State University
Approximate Bayesian computation for spatial extremes via open-faced sandwich adjustment
 Approximate Bayesian computation for spatial extremes via open-faced sandwich adjustment Ben Shaby SAMSI August 3, 2010 Ben Shaby (SAMSI) OFS adjustment August 3, 2010 1 / 29 Outline 1 Introduction 2 Spatial
Hierarchical Modelling for Univariate Spatial Data
 Spatial omain Hierarchical Modelling for Univariate Spatial ata Sudipto Banerjee 1 and Andrew O. Finley 2 1 Biostatistics, School of Public Health, University of Minnesota, Minneapolis, Minnesota, U.S.A.
Data. Climate model data from CMIP3
 Data Observational data from CRU (Climate Research Unit, University of East Anglia, UK) monthly averages on 5 o x5 o grid boxes, aggregated to JJA average anomalies over Europe: spatial averages over 10
EXTREMAL MODELS AND ENVIRONMENTAL APPLICATIONS. Rick Katz
 1 EXTREMAL MODELS AND ENVIRONMENTAL APPLICATIONS Rick Katz Institute for Study of Society and Environment National Center for Atmospheric Research Boulder, CO USA email: rwk@ucar.edu Home page: www.isse.ucar.edu/hp_rick/
Financial Econometrics and Volatility Models Extreme Value Theory
 Financial Econometrics and Volatility Models Extreme Value Theory Eric Zivot May 3, 2010 1 Lecture Outline Modeling Maxima and Worst Cases The Generalized Extreme Value Distribution Modeling Extremes Over
A STATISTICAL TECHNIQUE FOR MODELLING NON-STATIONARY SPATIAL PROCESSES
 A STATISTICAL TECHNIQUE FOR MODELLING NON-STATIONARY SPATIAL PROCESSES JOHN STEPHENSON 1, CHRIS HOLMES, KERRY GALLAGHER 1 and ALEXANDRE PINTORE 1 Dept. Earth Science and Engineering, Imperial College,
Journal of Environmental Statistics
 jes Journal of Environmental Statistics February 2010, Volume 1, Issue 3. http://www.jenvstat.org Exponentiated Gumbel Distribution for Estimation of Return Levels of Significant Wave Height Klara Persson
Simple example of analysis on spatial-temporal data set
 Simple example of analysis on spatial-temporal data set I used the ground level ozone data in North Carolina (from Suhasini Subba Rao s website) The original data consists of 920 days of data over 72 locations
Bayesian spatial hierarchical modeling for temperature extremes
 Bayesian spatial hierarchical modeling for temperature extremes Indriati Bisono Dr. Andrew Robinson Dr. Aloke Phatak Mathematics and Statistics Department The University of Melbourne Maths, Informatics
Hydrologic Design under Nonstationarity
 Hydrologic Design under Nonstationarity Jayantha Obeysekera ( Obey ), SFWMD Jose D. Salas, Colorado State University Hydroclimatology & Engineering Adaptaton (HYDEA) Subcommittee Meeting May 30, 2017,
A STATISTICAL APPROACH TO OPERATIONAL ATTRIBUTION
 A STATISTICAL APPROACH TO OPERATIONAL ATTRIBUTION Richard L. Smith Department of Statistics and Operations Research University of North Carolina Chapel Hill, NC 27599-3260, USA rls@email.unc.edu IDAG Meeting
Spatial Statistics with Image Analysis. Outline. A Statistical Approach. Johan Lindström 1. Lund October 6, 2016
 Spatial Statistics Spatial Examples More Spatial Statistics with Image Analysis Johan Lindström 1 1 Mathematical Statistics Centre for Mathematical Sciences Lund University Lund October 6, 2016 Johan Lindström
On the Estimation and Application of Max-Stable Processes
 On the Estimation and Application of Max-Stable Processes Zhengjun Zhang Department of Statistics University of Wisconsin Madison, WI 53706, USA Co-author: Richard Smith EVA 2009, Fort Collins, CO Z. Zhang
Emma Simpson. 6 September 2013
 6 September 2013 Test What is? Beijing during periods of low and high air pollution Air pollution is composed of sulphur oxides, nitrogen oxides, carbon monoxide and particulates. Particulates are small
Hidden Markov Models for precipitation
 Hidden Markov Models for precipitation Pierre Ailliot Université de Brest Joint work with Peter Thomson Statistics Research Associates (NZ) Page 1 Context Part of the project Climate-related risks for
A spatio-temporal model for extreme precipitation simulated by a climate model
 A spatio-temporal model for extreme precipitation simulated by a climate model Jonathan Jalbert Postdoctoral fellow at McGill University, Montréal Anne-Catherine Favre, Claude Bélisle and Jean-François
9 th International Extreme Value Analysis Conference Ann Arbor, Michigan. 15 June 2015
 Severe Storm Environments and Extreme Value Analysis Eric Gilleland Research Applications Laboratory Weather and Climate Impacts Assessment Science Project http://www.assessment.ucar.edu/ 9 th International
of the 7 stations. In case the number of daily ozone maxima in a month is less than 15, the corresponding monthly mean was not computed, being treated
 Spatial Trends and Spatial Extremes in South Korean Ozone Seokhoon Yun University of Suwon, Department of Applied Statistics Suwon, Kyonggi-do 445-74 South Korea syun@mail.suwon.ac.kr Richard L. Smith
Spatial smoothing using Gaussian processes
 Spatial smoothing using Gaussian processes Chris Paciorek paciorek@hsph.harvard.edu August 5, 2004 1 OUTLINE Spatial smoothing and Gaussian processes Covariance modelling Nonstationary covariance modelling
Bivariate generalized Pareto distribution
 Bivariate generalized Pareto distribution in practice Eötvös Loránd University, Budapest, Hungary Minisymposium on Uncertainty Modelling 27 September 2011, CSASC 2011, Krems, Austria Outline Short summary
Statistics for analyzing and modeling precipitation isotope ratios in IsoMAP
 Statistics for analyzing and modeling precipitation isotope ratios in IsoMAP The IsoMAP uses the multiple linear regression and geostatistical methods to analyze isotope data Suppose the response variable
Models for models. Douglas Nychka Geophysical Statistics Project National Center for Atmospheric Research
 Models for models Douglas Nychka Geophysical Statistics Project National Center for Atmospheric Research Outline Statistical models and tools Spatial fields (Wavelets) Climate regimes (Regression and clustering)
Bayesian covariate models in extreme value analysis
 Bayesian covariate models in extreme value analysis David Randell, Philip Jonathan, Kathryn Turnbull, Mathew Jones EVA 2015 Ann Arbor Copyright 2015 Shell Global Solutions (UK) EVA 2015 Ann Arbor June
Tomoko Matsuo s collaborators
 Tomoko Matsuo s collaborators Thermosphere-Ionosphere GCM Modeling A. Richmond (NCAR-HAO) T. Fuller-Rowell and M. Codrescu (NOAA) Polar Ionosphere Data Assimilation A. Richmond, G. Lu, and B. Emery (NCAR-HAO)
A short introduction to INLA and R-INLA
 A short introduction to INLA and R-INLA Integrated Nested Laplace Approximation Thomas Opitz, BioSP, INRA Avignon Workshop: Theory and practice of INLA and SPDE November 7, 2018 2/21 Plan for this talk
Large-scale Indicators for Severe Weather
 Large-scale Indicators for Severe Weather Eric Gilleland Matthew Pocernich Harold E. Brooks Barbara G. Brown Patrick Marsh Abstract Trends in extreme values of a large-scale indicator for severe weather
Nonparametric Estimation of the Dependence Function for a Multivariate Extreme Value Distribution
 Nonparametric Estimation of the Dependence Function for a Multivariate Extreme Value Distribution p. /2 Nonparametric Estimation of the Dependence Function for a Multivariate Extreme Value Distribution
Practical Bayesian Optimization of Machine Learning. Learning Algorithms
 Practical Bayesian Optimization of Machine Learning Algorithms CS 294 University of California, Berkeley Tuesday, April 20, 2016 Motivation Machine Learning Algorithms (MLA s) have hyperparameters that
Max-stable Processes for Threshold Exceedances in Spatial Extremes
 Max-stable Processes for Threshold Exceedances in Spatial Extremes Soyoung Jeon A dissertation submitted to the faculty of the University of North Carolina at Chapel Hill in partial fulfillment of the
Sub-kilometer-scale space-time stochastic rainfall simulation
 Picture: Huw Alexander Ogilvie Sub-kilometer-scale space-time stochastic rainfall simulation Lionel Benoit (University of Lausanne) Gregoire Mariethoz (University of Lausanne) Denis Allard (INRA Avignon)
Geostatistics of Extremes
 Geostatistics of Extremes Anthony Davison Joint with Mohammed Mehdi Gholamrezaee, Juliette Blanchet, Simone Padoan, Mathieu Ribatet Funding: Swiss National Science Foundation, ETH Competence Center for