HIERARCHICAL MODELS IN EXTREME VALUE THEORY
|
|
|
- Rosalyn Andrews
- 6 years ago
- Views:
Transcription
1 HIERARCHICAL MODELS IN EXTREME VALUE THEORY Richard L. Smith Department of Statistics and Operations Research, University of North Carolina, Chapel Hill and Statistical and Applied Mathematical Sciences Institute Department of Statistics North Carolina State University February 19, 2015
2 OUTLINE OF TALKs I. An Example of Hierarchical Models Applied to Insurance Extremes II. Attribution of Climate Extremes III. The Attribution Problem for Joint Distributions of Climate Extremes (introduction)
3 I. AN EXAMPLE OF HIERARCHICAL MODELS APPLIED TO INSURANCE EXTREMES From the book chapter Bayesian Risk Analysis by R.L. Smith and D.J. Goodman (2000) See also: R.L. Smith (2003), Statistics of Extremes, With Applications in Environment, Insurance and Finance. In Extreme Values in Finance, Telecommunications and the Environment, edited by B. Finkenstadt and H. Rootzen, Chapman and Hall/CRC Press, London, pp
4 The data consist of all insurance claims experienced by a large international oil company over a threshold 0.5 during a 15-year period a total of 393 claims. Seven types: Type Description Number Mean 1 Fire Liability Offshore Cargo Hull Onshore Aviation Total of all 393 claims: largest claims: 776.2, 268.0, 142.0, 131.0, 95.8, 56.8, 46.2, 45.2, 40.4, 30.7.
5 (a) (b) Claim Size Total number of claims Years From Start Years From Start (c) (d) Total size of claims Mean excess over threshold Years From Start Threshold Some plots of the insurance data.
6 Some problems: 1. What is the distribution of very large claims? 2. Is there any evidence of a change of the distribution over time? 3. What is the influence of the different types of claim? 4. How should one characterize the risk to the company? More precisely, what probability distribution can one put on the amount of money that the company will have to pay out in settlement of large insurance claims over a future time period of, say, three years?
7 Introduction to Univariate Extreme Value Theory
8 EXTREME VALUE DISTRIBUTIONS X 1, X 2,..., i.i.d., F (x) = Pr{X i x}, M n = max(x 1,..., X n ), Pr{M n x} = F (x) n. For non-trivial results must renormalize: find a n > 0, b n such that { } Mn b n Pr x = F (a n x + b n ) n H(x). a n The Three Types Theorem (Fisher-Tippett, Gnedenko) asserts that if nondegenerate H exists, it must be one of three types: H(x) = exp( e x ), all x (Gumbel) { 0 x < 0 H(x) = exp( x α ) x > 0 (Fréchet) { exp( x H(x) = α ) x < 0 1 x > 0 (Weibull) In Fréchet and Weibull, α > 0.
9 The three types may be combined into a single generalized extreme value (GEV) distribution: ( H(x) = exp 1 + ξ x µ ) 1/ξ ψ, (y + = max(y, 0)) where µ is a location parameter, ψ > 0 is a scale parameter and ξ is a shape parameter. ξ 0 corresponds to the Gumbel distribution, ξ > 0 to the Fréchet distribution with α = 1/ξ, ξ < 0 to the Weibull distribution with α = 1/ξ. ξ > 0: long-tailed case, 1 F (x) x 1/ξ, ξ = 0: exponential tail ξ < 0: short-tailed case, finite endpoint at µ ξ/ψ +
10 EXCEEDANCES OVER THRESHOLDS Consider the distribution of X conditionally on exceeding some high threshold u: F u (y) = F (u + y) F (u). 1 F (u) As u ω F = sup{x : F (x) < 1}, often find a limit F u (y) G(y; σ u, ξ) where G is generalized Pareto distribution (GPD) G(y; σ, ξ) = 1 ( 1 + ξ y ) 1/ξ σ + Equivalence to three types theorem established by Pickands (1975)..
11 The Generalized Pareto Distribution G(y; σ, ξ) = 1 ( 1 + ξ y ) 1/ξ σ +. ξ > 0: long-tailed (equivalent to usual Pareto distribution), tail like x 1/ξ, ξ = 0: take limit as ξ 0 to get G(y; σ, 0) = 1 exp i.e. exponential distribution with mean σ, ( y ), σ ξ < 0: finite upper endpoint at σ/ξ.
12 POISSON-GPD MODEL FOR EXCEEDANCES 1. The number, N, of exceedances of the level u in any one year has a Poisson distribution with mean λ, 2. Conditionally on N 1, the excess values Y 1,..., Y N are IID from the GPD.
13 Relation to GEV for annual maxima: Suppose x > u. The probability that the annual maximum of the Poisson-GPD process is less than x is Pr{ max Y i x} = Pr{N = 0} + 1 i N = e λ + = exp { n=1 ( λ λ n e λ n! { ξ x u σ ( 1 + ξ x u σ ) 1/ξ }. n=1 ) } 1/ξ n Pr{N = n, Y 1 x,... Y n x} This is GEV with σ = ψ + ξ(u µ), λ = ( 1 + ξ u µ ) 1/ξ ψ. Thus the GEV and GPD models are entirely consistent with one another above the GPD threshold, and moreover, shows exactly how the Poisson GPD parameters σ and λ vary with u.
14 ALTERNATIVE PROBABILITY MODELS 1. The r largest order statistics model If Y n,1 Y n,2... Y n,r are r largest order statistics of IID sample of size n, and a n and b n are EVT normalizing constants, then ( Yn,1 b n,..., Y ) n,r b n a n a n converges in distribution to a limiting random vector (X 1,..., X r ), whose density is ( h(x 1,..., x r ) = ψ r exp 1 + ξ x ) 1/ξ r µ ψ ( ξ ) r j=1 log ( 1 + ξ x j µ ψ ).
15 2. Point process approach (Smith 1989) Two-dimensional plot of exceedance times and exceedance levels forms a nonhomogeneous Poisson process with Λ(A) = (t 2 t 1 )Ψ(y; µ, ψ, ξ) Ψ(y; µ, ψ, ξ) = ( 1 + ξ y µ ψ ) 1/ξ (1 + ξ(y µ)/ψ > 0).
16 Illustration of point process model.
17 An extension of this approach allows for nonstationary processes in which the parameters µ, ψ and ξ are all allowed to be timedependent, denoted µ t, ψ t and ξ t. This is the basis of the extreme value regression approaches introduced later Comment. The point process approach is almost equivalent to the following: assume the GEV (not GPD) distribution is valid for exceedances over the threshold, and that all observations under the threshold are censored. Compared with the GPD approach, the parameterization directly in terms of µ, ψ, ξ is often easier to interpret, especially when trends are involved.
18 GEV log likelihood: l Y (µ, ψ, ξ) = N log ψ ESTIMATION i ( ( ) 1 ξ ξ Y i µ ψ i ) 1/ξ provided 1 + ξ(y i µ)/ψ > 0 for each i. log ( 1 + ξ Y i µ ψ ) Poisson-GPD model: l N,Y (λ, σ, ξ) = N log λ λt N log σ provided 1 + ξy i /σ > 0 for all i. ( ξ ) N i=1 log ( 1 + ξ Y i σ ) Usual asymptotics valid if ξ > 1 2 (Smith 1985)
19 Bayesian approaches An alternative approach to extreme value inference is Bayesian, using vague priors for the GEV parameters and MCMC samples for the computations. Bayesian methods are particularly useful for predictive inference, e.g. if Z is some as yet unobserved random variable whose distribution depends on µ, ψ and ξ, estimate Pr{Z > z} by Pr{Z > z; µ, ψ, ξ}π(µ, ψ, ξ Y )dµdψdξ where π(... Y ) denotes the posterior density given past data Y
20 Plots of women s 3000 meter records, and profile log-likelihood for ultimate best value based on pre-1993 data.
21 Example. The left figure shows the five best running times by different athletes in the women s 3000 metre track event for each year from 1972 to Also shown on the plot is Wang Junxia s world record from Many questions were raised about possible illegal drug use. We approach this by asking how implausible Wang s performance was, given all data up to Robinson and Tawn (1995) used the r largest order statistics method (with r = 5, translated to smallest order statistics) to estimate an extreme value distribution, and hence computed a profile likelihood for x ult, the lower endpoint of the distribution, based on data up to 1992 (right plot of previous figure)
22 Alternative Bayesian calculation: (Smith 1997) Compute the (Bayesian) predictive probability that the 1993 performance is equal or better to Wang s, given the data up to 1992, and conditional on the event that there is a new world record. The answer is approximately
23 Insurance Extremes Dataset We return to the oil company data set discussed earlier. Prior to any of the analysis, some examination was made of clustering phenomena, but this only reduced the original 425 claims to 393 independent claims (Smith & Goodman 2000) GPD fits to various thresholds: u N u Mean σ ξ Excess
24 Point process approach: u N u µ log ψ ξ (4.4) (0.24) (0.09) (5.2) (0.31) (0.16) (5.5) (0.31) (0.21) (5.7) (0.32) (0.25) (3.9) (0.46) (0.45) (5.7) (0.56) (0.53) (8.6) (0.66) (0.56) Standard errors are in parentheses
25 Predictive Distributions of Future Losses What is the probability distribution of future losses over a specific time period, say 1 year? Let Y be future total loss. Distribution function G(y; µ, ψ, ξ) in practice this must itself be simulated.
26 Traditional frequentist approach: where ˆµ, ˆψ, ˆξ are MLEs. Ĝ(y) = G(y; ˆµ, ˆψ, ˆξ) Bayesian: G(y) = G(y; µ, ψ, ξ)dπ(µ, ψ, ξ X) where π( X) denotes posterior density given data X.
27 (a) (b) post.density post.density mu Log psi (c) (d) post.density Amount of Loss xi N=1/(probability of loss) Estimated posterior densities for the three parameters, and for the predictive distribution function. Four independent Monte Carlo runs are shown for each plot.
28 Hierarchical models for claim type and year effects Further features of the data: 1. When separate GPDs are fitted to each of the 6 main types, there are clear differences among the parameters. 2. The rate of high-threshold crossings does not appear uniform, but peaks around years
29 A Hierarchical Model: Level I. Parameters m µ, m ψ, m ξ, s 2 µ, s 2 ψ, s2 ξ a prior distribution. are generated from Level II. Conditional on the parameters in Level I, parameters µ 1,..., µ J (where J is the number of types) are independently drawn from N(m µ, s 2 µ), the normal distribution with mean m µ, variance s 2 µ. Similarly, log ψ 1,..., log ψ J are drawn independently from N(m ψ, s 2 ψ ), ξ 1,..., ξ J are drawn independently from N(m ξ, s 2 ξ ). Level III. Conditional on Level II, for each j {1,..., J}, the point process of exceedances of type j is generated from the Poisson process with parameters µ j, ψ j, ξ j.
30 This model may be further extended to include a year effect, as follows. Suppose the extreme value parameters for type j in year k are not µ j, ψ j, ξ j but µ j + δ k, ψ j, ξ j. We fix δ 1 = 0 to ensure identifiability, and let {δ k, k > 1} follow an AR(1) process: with a vague prior on (ρ, s 2 η). δ k = ρδ k 1 + η k, η k N(0, s 2 η) We show boxplots for each of µ j, log ψ j, ξ j, j = 1,..., 6 and for δ k, k = 2, 15.
31 (a) (b) mu log psi type type (c) (d) xi delta type Posterior means, quartiles for µ j, log ψ j, ξ j (j = 1,..., 6) and δ k (k = 2,..., 15). year
32 50000 A: All data combined B: Separate types A C: Separate types and years D: As C, outliers omitted B C Amount of loss 5000 D N=1/(probability of loss) Posterior predictive distribution functions (log-log scale) for homogenous model (curve A) and three versions of hierarchical model
33 II. ATTRIBUTION OF CLIMATE EXTREMES (Joint work with Michael Wehner, Lawrence Berkeley National Laboratory)

34 Superstorm Sandy on October (Scott Sistek)

35 Superstorm Sandy ( October 30, 2012)

36 Superstorm Sandy ( October 31, 2012)

37
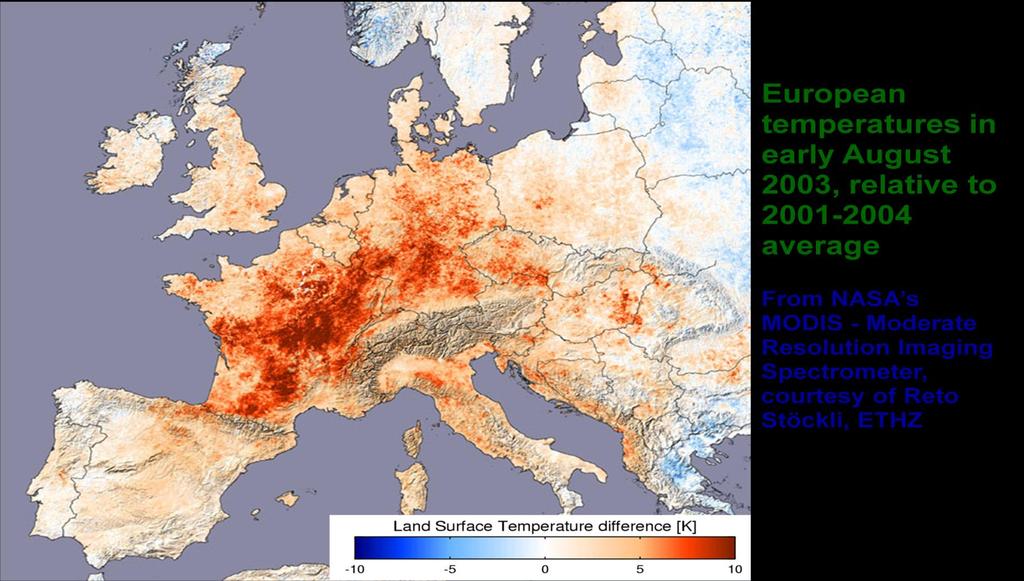
38 Motivating Question: Concern over increasing frequency of extreme meteorological events Is the increasing frequency a result of anthropogenic influence? How much more rapidly with they increase in the future? Focus on three specific events: heatwaves in Europe 2003, Russia 2010 and Central USA 2011 Identify meteorological variables of interest JJA temperature averages over a region Europe 10 o W to 40 o E, 30 o to 50 o N Russia 30 o to 60 o E, 45 o to 65 o N Central USA 90 o to 105 o W, 25 o to 45 o N Probabilities of crossing thresholds respectively 1.92K, 3.65K, 2.01K in any year from 1990 to 2040.
39 Background Stott, Stone and Allen (2004) defined fraction of attributable risk (FAR) Observe some extreme event Let P 1 be probability of this event estimated from models including anthropogenic forcings, P 0 corresponding probability under natural forcings F AR = 1 P 0 P (also consider RR = P 1 1 P ) 0 For the Europe 2003 event they claimed P , P 0 1 so RR = 4 and F AR = = Very likely (confidence level at least 90%) that the F AR was at least 0.5 (RR 2), Method used a combination of extreme value theory, and detection and attribution methodology from the climate literature
RISK AND EXTREMES: ASSESSING THE PROBABILITIES OF VERY RARE EVENTS
 RISK AND EXTREMES: ASSESSING THE PROBABILITIES OF VERY RARE EVENTS Richard L. Smith Department of Statistics and Operations Research University of North Carolina Chapel Hill, NC 27599-3260 rls@email.unc.edu
RISK ANALYSIS AND EXTREMES
 RISK ANALYSIS AND EXTREMES Richard L. Smith Department of Statistics and Operations Research University of North Carolina Chapel Hill, NC 27599-3260 rls@email.unc.edu Opening Workshop SAMSI program on
Richard L. Smith Department of Statistics and Operations Research University of North Carolina Chapel Hill, NC
 EXTREME VALUE THEORY Richard L. Smith Department of Statistics and Operations Research University of North Carolina Chapel Hill, NC 27599-3260 rls@email.unc.edu AMS Committee on Probability and Statistics
MULTIVARIATE EXTREMES AND RISK
 MULTIVARIATE EXTREMES AND RISK Richard L. Smith Department of Statistics and Operations Research University of North Carolina Chapel Hill, NC 27599-3260 rls@email.unc.edu Interface 2008 RISK: Reality Durham,
Extreme Precipitation: An Application Modeling N-Year Return Levels at the Station Level
 Extreme Precipitation: An Application Modeling N-Year Return Levels at the Station Level Presented by: Elizabeth Shamseldin Joint work with: Richard Smith, Doug Nychka, Steve Sain, Dan Cooley Statistics
Overview of Extreme Value Theory. Dr. Sawsan Hilal space
 Overview of Extreme Value Theory Dr. Sawsan Hilal space Maths Department - University of Bahrain space November 2010 Outline Part-1: Univariate Extremes Motivation Threshold Exceedances Part-2: Bivariate
Extreme Value Analysis and Spatial Extremes
 Extreme Value Analysis and Department of Statistics Purdue University 11/07/2013 Outline Motivation 1 Motivation 2 Extreme Value Theorem and 3 Bayesian Hierarchical Models Copula Models Max-stable Models
Bayesian Point Process Modeling for Extreme Value Analysis, with an Application to Systemic Risk Assessment in Correlated Financial Markets
 Bayesian Point Process Modeling for Extreme Value Analysis, with an Application to Systemic Risk Assessment in Correlated Financial Markets Athanasios Kottas Department of Applied Mathematics and Statistics,
Bayesian Modelling of Extreme Rainfall Data
 Bayesian Modelling of Extreme Rainfall Data Elizabeth Smith A thesis submitted for the degree of Doctor of Philosophy at the University of Newcastle upon Tyne September 2005 UNIVERSITY OF NEWCASTLE Bayesian
STATISTICS FOR CLIMATE SCIENCE
 STATISTICS FOR CLIMATE SCIENCE Richard L Smith University of North Carolina and SAMSI VI-MSS Workshop on Environmental Statistics Kolkata, March 2-4, 2015 www.unc.edu/~rls/kolkata.html 1 1 In Memoriam
MFM Practitioner Module: Quantitiative Risk Management. John Dodson. October 14, 2015
 MFM Practitioner Module: Quantitiative Risk Management October 14, 2015 The n-block maxima 1 is a random variable defined as M n max (X 1,..., X n ) for i.i.d. random variables X i with distribution function
Financial Econometrics and Volatility Models Extreme Value Theory
 Financial Econometrics and Volatility Models Extreme Value Theory Eric Zivot May 3, 2010 1 Lecture Outline Modeling Maxima and Worst Cases The Generalized Extreme Value Distribution Modeling Extremes Over
Extreme Value Theory and Applications
 Extreme Value Theory and Deauville - 04/10/2013 Extreme Value Theory and Introduction Asymptotic behavior of the Sum Extreme (from Latin exter, exterus, being on the outside) : Exceeding the ordinary,
BAYESIAN HIERARCHICAL MODELS FOR EXTREME EVENT ATTRIBUTION
 BAYESIAN HIERARCHICAL MODELS FOR EXTREME EVENT ATTRIBUTION Richard L Smith University of North Carolina and SAMSI (Joint with Michael Wehner, Lawrence Berkeley Lab) IDAG Meeting Boulder, February 1-3,
Zwiers FW and Kharin VV Changes in the extremes of the climate simulated by CCC GCM2 under CO 2 doubling. J. Climate 11:
 Statistical Analysis of EXTREMES in GEOPHYSICS Zwiers FW and Kharin VV. 1998. Changes in the extremes of the climate simulated by CCC GCM2 under CO 2 doubling. J. Climate 11:2200 2222. http://www.ral.ucar.edu/staff/ericg/readinggroup.html
New Classes of Multivariate Survival Functions
 Xiao Qin 2 Richard L. Smith 2 Ruoen Ren School of Economics and Management Beihang University Beijing, China 2 Department of Statistics and Operations Research University of North Carolina Chapel Hill,
INFLUENCE OF CLIMATE CHANGE ON EXTREME WEATHER EVENTS
 INFLUENCE OF CLIMATE CHANGE ON EXTREME WEATHER EVENTS Richard L Smith University of North Carolina and SAMSI (Joint with Michael Wehner, Lawrence Berkeley Lab) VI-MSS Workshop on Environmental Statistics
A STATISTICAL APPROACH TO OPERATIONAL ATTRIBUTION
 A STATISTICAL APPROACH TO OPERATIONAL ATTRIBUTION Richard L. Smith Department of Statistics and Operations Research University of North Carolina Chapel Hill, NC 27599-3260, USA rls@email.unc.edu IDAG Meeting
What Can We Infer From Beyond The Data? The Statistics Behind The Analysis Of Risk Events In The Context Of Environmental Studies
 What Can We Infer From Beyond The Data? The Statistics Behind The Analysis Of Risk Events In The Context Of Environmental Studies Sibusisiwe Khuluse, Sonali Das, Pravesh Debba, Chris Elphinstone Logistics
Statistics for extreme & sparse data
 Statistics for extreme & sparse data University of Bath December 6, 2018 Plan 1 2 3 4 5 6 The Problem Climate Change = Bad! 4 key problems Volcanic eruptions/catastrophic event prediction. Windstorms
Lecture 2 APPLICATION OF EXREME VALUE THEORY TO CLIMATE CHANGE. Rick Katz
 1 Lecture 2 APPLICATION OF EXREME VALUE THEORY TO CLIMATE CHANGE Rick Katz Institute for Study of Society and Environment National Center for Atmospheric Research Boulder, CO USA email: rwk@ucar.edu Home
Data. Climate model data from CMIP3
 Data Observational data from CRU (Climate Research Unit, University of East Anglia, UK) monthly averages on 5 o x5 o grid boxes, aggregated to JJA average anomalies over Europe: spatial averages over 10
Investigation of an Automated Approach to Threshold Selection for Generalized Pareto
 Investigation of an Automated Approach to Threshold Selection for Generalized Pareto Kate R. Saunders Supervisors: Peter Taylor & David Karoly University of Melbourne April 8, 2015 Outline 1 Extreme Value
UNIVERSITY OF CALGARY. Inference for Dependent Generalized Extreme Values. Jialin He A THESIS SUBMITTED TO THE FACULTY OF GRADUATE STUDIES
 UNIVERSITY OF CALGARY Inference for Dependent Generalized Extreme Values by Jialin He A THESIS SUBMITTED TO THE FACULTY OF GRADUATE STUDIES IN PARTIAL FULFILLMENT OF THE REQUIREMENTS FOR THE DEGREE OF
Introduction to Algorithmic Trading Strategies Lecture 10
 Introduction to Algorithmic Trading Strategies Lecture 10 Risk Management Haksun Li haksun.li@numericalmethod.com www.numericalmethod.com Outline Value at Risk (VaR) Extreme Value Theory (EVT) References
Generalized additive modelling of hydrological sample extremes
 Generalized additive modelling of hydrological sample extremes Valérie Chavez-Demoulin 1 Joint work with A.C. Davison (EPFL) and Marius Hofert (ETHZ) 1 Faculty of Business and Economics, University of
Modelação de valores extremos e sua importância na
 Modelação de valores extremos e sua importância na segurança e saúde Margarida Brito Departamento de Matemática FCUP (FCUP) Valores Extremos - DemSSO 1 / 12 Motivation Consider the following events Occurance
EXTREMAL MODELS AND ENVIRONMENTAL APPLICATIONS. Rick Katz
 1 EXTREMAL MODELS AND ENVIRONMENTAL APPLICATIONS Rick Katz Institute for Study of Society and Environment National Center for Atmospheric Research Boulder, CO USA email: rwk@ucar.edu Home page: www.isse.ucar.edu/hp_rick/
Overview of Extreme Value Analysis (EVA)
") Overview of Extreme Value Analysis (EVA) Brian Reich North Carolina State University July 26, 2016 Rossbypalooza Chicago, IL Brian Reich Overview of Extreme Value Analysis (EVA) 1 / 24 Importance of extremes
Overview of Extreme Value Analysis (EVA) Brian Reich North Carolina State University July 26, 2016 Rossbypalooza Chicago, IL Brian Reich Overview of Extreme Value Analysis (EVA) 1 / 24 Importance of extremes
Classical Extreme Value Theory - An Introduction
 Chapter 1 Classical Extreme Value Theory - An Introduction 1.1 Introduction Asymptotic theory of functions of random variables plays a very important role in modern statistics. The objective of the asymptotic
PENULTIMATE APPROXIMATIONS FOR WEATHER AND CLIMATE EXTREMES. Rick Katz
 PENULTIMATE APPROXIMATIONS FOR WEATHER AND CLIMATE EXTREMES Rick Katz Institute for Mathematics Applied to Geosciences National Center for Atmospheric Research Boulder, CO USA Email: rwk@ucar.edu Web site:
Bivariate generalized Pareto distribution
 Bivariate generalized Pareto distribution in practice Eötvös Loránd University, Budapest, Hungary Minisymposium on Uncertainty Modelling 27 September 2011, CSASC 2011, Krems, Austria Outline Short summary
FORECAST VERIFICATION OF EXTREMES: USE OF EXTREME VALUE THEORY
 1 FORECAST VERIFICATION OF EXTREMES: USE OF EXTREME VALUE THEORY Rick Katz Institute for Study of Society and Environment National Center for Atmospheric Research Boulder, CO USA Email: rwk@ucar.edu Web
Accounting for Choice of Measurement Scale in Extreme Value Modeling
 Accounting for Choice of Measurement Scale in Extreme Value Modeling J. L. Wadsworth Department of Mathematics and Statistics Lancaster University, LA1 4YF, UK J. A. Tawn Department of Mathematics and
Bayesian Inference for Clustered Extremes
 Newcastle University, Newcastle-upon-Tyne, U.K. lee.fawcett@ncl.ac.uk 20th TIES Conference: Bologna, Italy, July 2009 Structure of this talk 1. Motivation and background 2. Review of existing methods Limitations/difficulties
Emma Simpson. 6 September 2013
 6 September 2013 Test What is? Beijing during periods of low and high air pollution Air pollution is composed of sulphur oxides, nitrogen oxides, carbon monoxide and particulates. Particulates are small
DOWNSCALING EXTREMES: A COMPARISON OF EXTREME VALUE DISTRIBUTIONS IN POINT-SOURCE AND GRIDDED PRECIPITATION DATA
 Submitted to the Annals of Applied Statistics arxiv: math.pr/0000000 DOWNSCALING EXTREMES: A COMPARISON OF EXTREME VALUE DISTRIBUTIONS IN POINT-SOURCE AND GRIDDED PRECIPITATION DATA By Elizabeth C. Mannshardt-Shamseldin
Downscaling Extremes: A Comparison of Extreme Value Distributions in Point-Source and Gridded Precipitation Data
 Downscaling Extremes: A Comparison of Extreme Value Distributions in Point-Source and Gridded Precipitation Data Elizabeth C. Mannshardt-Shamseldin 1, Richard L. Smith 2 Stephan R. Sain 3,Linda O. Mearns
Physically-Based Statistical Models of Extremes arising from Extratropical Cyclones
 Lancaster University STOR603: PhD Proposal Physically-Based Statistical Models of Extremes arising from Extratropical Cyclones Author: Paul Sharkey Supervisors: Jonathan Tawn Jenny Wadsworth Simon Brown
Parameter Estimation
 Parameter Estimation Chapters 13-15 Stat 477 - Loss Models Chapters 13-15 (Stat 477) Parameter Estimation Brian Hartman - BYU 1 / 23 Methods for parameter estimation Methods for parameter estimation Methods
Models and estimation.
 Bivariate generalized Pareto distribution practice: Models and estimation. Eötvös Loránd University, Budapest, Hungary 7 June 2011, ASMDA Conference, Rome, Italy Problem How can we properly estimate the
On the Application of the Generalized Pareto Distribution for Statistical Extrapolation in the Assessment of Dynamic Stability in Irregular Waves
 On the Application of the Generalized Pareto Distribution for Statistical Extrapolation in the Assessment of Dynamic Stability in Irregular Waves Bradley Campbell 1, Vadim Belenky 1, Vladas Pipiras 2 1.
IT S TIME FOR AN UPDATE EXTREME WAVES AND DIRECTIONAL DISTRIBUTIONS ALONG THE NEW SOUTH WALES COASTLINE
 IT S TIME FOR AN UPDATE EXTREME WAVES AND DIRECTIONAL DISTRIBUTIONS ALONG THE NEW SOUTH WALES COASTLINE M Glatz 1, M Fitzhenry 2, M Kulmar 1 1 Manly Hydraulics Laboratory, Department of Finance, Services
Extreme Event Modelling
 Extreme Event Modelling Liwei Wu, SID: 52208712 Department of Mathematics City University of Hong Kong Supervisor: Dr. Xiang Zhou March 31, 2014 Contents 1 Introduction 4 2 Theory and Methods 5 2.1 Asymptotic
SEVERE WEATHER UNDER A CHANGING CLIMATE: LARGE-SCALE INDICATORS OF EXTREME EVENTS
 SEVERE WEATHER UNDER A CHANGING CLIMATE: LARGE-SCALE INDICATORS OF EXTREME EVENTS Matthew Heaton 1, Matthias Katzfuß 2, Yi Li 3, Kathryn Pedings 4, Shahla Ramachandar 5 Problem Presenter: Dr. Eric Gilleland
CONTAGION VERSUS FLIGHT TO QUALITY IN FINANCIAL MARKETS
 EVA IV, CONTAGION VERSUS FLIGHT TO QUALITY IN FINANCIAL MARKETS Jose Olmo Department of Economics City University, London (joint work with Jesús Gonzalo, Universidad Carlos III de Madrid) 4th Conference
Assessing Dependence in Extreme Values
 02/09/2016 1 Motivation Motivation 2 Comparison 3 Asymptotic Independence Component-wise Maxima Measures Estimation Limitations 4 Idea Results Motivation Given historical flood levels, how high should
Estimating Bivariate Tail: a copula based approach
 Estimating Bivariate Tail: a copula based approach Elena Di Bernardino, Université Lyon 1 - ISFA, Institut de Science Financiere et d'assurances - AST&Risk (ANR Project) Joint work with Véronique Maume-Deschamps
Chapter 4 HOMEWORK ASSIGNMENTS. 4.1 Homework #1
 Chapter 4 HOMEWORK ASSIGNMENTS These homeworks may be modified as the semester progresses. It is your responsibility to keep up to date with the correctly assigned homeworks. There may be some errors in
Estimation of Operational Risk Capital Charge under Parameter Uncertainty
 Estimation of Operational Risk Capital Charge under Parameter Uncertainty Pavel V. Shevchenko Principal Research Scientist, CSIRO Mathematical and Information Sciences, Sydney, Locked Bag 17, North Ryde,
STATISTICAL METHODS FOR RELATING TEMPERATURE EXTREMES TO LARGE-SCALE METEOROLOGICAL PATTERNS. Rick Katz
 1 STATISTICAL METHODS FOR RELATING TEMPERATURE EXTREMES TO LARGE-SCALE METEOROLOGICAL PATTERNS Rick Katz Institute for Mathematics Applied to Geosciences National Center for Atmospheric Research Boulder,
Max-stable Processes for Threshold Exceedances in Spatial Extremes
 Max-stable Processes for Threshold Exceedances in Spatial Extremes Soyoung Jeon A dissertation submitted to the faculty of the University of North Carolina at Chapel Hill in partial fulfillment of the
Analysis methods of heavy-tailed data
 Institute of Control Sciences Russian Academy of Sciences, Moscow, Russia February, 13-18, 2006, Bamberg, Germany June, 19-23, 2006, Brest, France May, 14-19, 2007, Trondheim, Norway PhD course Chapter
A Conditional Approach to Modeling Multivariate Extremes
 A Approach to ing Multivariate Extremes By Heffernan & Tawn Department of Statistics Purdue University s April 30, 2014 Outline s s Multivariate Extremes s A central aim of multivariate extremes is trying
Peaks-Over-Threshold Modelling of Environmental Data
 U.U.D.M. Project Report 2014:33 Peaks-Over-Threshold Modelling of Environmental Data Esther Bommier Examensarbete i matematik, 30 hp Handledare och examinator: Jesper Rydén September 2014 Department of
Multivariate generalized Pareto distributions
 Multivariate generalized Pareto distributions Holger Rootzén and Nader Tajvidi Abstract Statistical inference for extremes has been a subject of intensive research during the past couple of decades. One
Approximate Bayesian computation for spatial extremes via open-faced sandwich adjustment
 Approximate Bayesian computation for spatial extremes via open-faced sandwich adjustment Ben Shaby SAMSI August 3, 2010 Ben Shaby (SAMSI) OFS adjustment August 3, 2010 1 / 29 Outline 1 Introduction 2 Spatial
Spatial Extremes in Atmospheric Problems
 Spatial Extremes in Atmospheric Problems Eric Gilleland Research Applications Laboratory (RAL) National Center for Atmospheric Research (NCAR), Boulder, Colorado, U.S.A. http://www.ral.ucar.edu/staff/ericg
PREPRINT 2005:38. Multivariate Generalized Pareto Distributions HOLGER ROOTZÉN NADER TAJVIDI
 PREPRINT 2005:38 Multivariate Generalized Pareto Distributions HOLGER ROOTZÉN NADER TAJVIDI Department of Mathematical Sciences Division of Mathematical Statistics CHALMERS UNIVERSITY OF TECHNOLOGY GÖTEBORG
High-frequency data modelling using Hawkes processes
 Valérie Chavez-Demoulin joint work with High-frequency A.C. Davison data modelling and using A.J. Hawkes McNeil processes(2005), J.A EVT2013 McGill 1 /(201 High-frequency data modelling using Hawkes processes
High-frequency data modelling using Hawkes processes
 High-frequency data modelling using Hawkes processes Valérie Chavez-Demoulin 1 joint work J.A McGill 1 Faculty of Business and Economics, University of Lausanne, Switzerland Boulder, April 2016 Boulder,
Estimation of Gutenberg-Richter seismicity parameters for the Bundaberg region using piecewise extended Gumbel analysis
 Estimation of Gutenberg-Richter seismicity parameters for the Bundaberg region using piecewise extended Gumbel analysis Abstract Mike Turnbull Central Queensland University The Gumbel statistics of extreme
Bayesian Modeling of Accelerated Life Tests with Random Effects
 Bayesian Modeling of Accelerated Life Tests with Random Effects Ramón V. León Avery J. Ashby Jayanth Thyagarajan Joint Statistical Meeting August, 00 Toronto, Canada Abstract We show how to use Bayesian
On the Estimation and Application of Max-Stable Processes
 On the Estimation and Application of Max-Stable Processes Zhengjun Zhang Department of Statistics University of Wisconsin Madison, WI 53706, USA Co-author: Richard Smith EVA 2009, Fort Collins, CO Z. Zhang
Bayesian nonparametric Poisson process modeling with applications
 Bayesian nonparametric Poisson process modeling with applications Athanasios Kottas Department of Applied Mathematics and Statistics University of California, Santa Cruz Neyman Seminar Department of Statistics
Efficient Estimation of Distributional Tail Shape and the Extremal Index with Applications to Risk Management
 Journal of Mathematical Finance, 2016, 6, 626-659 http://www.scirp.org/journal/jmf ISSN Online: 2162-2442 ISSN Print: 2162-2434 Efficient Estimation of Distributional Tail Shape and the Extremal Index
Discussion on Human life is unlimited but short by Holger Rootzén and Dmitrii Zholud
 Extremes (2018) 21:405 410 https://doi.org/10.1007/s10687-018-0322-z Discussion on Human life is unlimited but short by Holger Rootzén and Dmitrii Zholud Chen Zhou 1 Received: 17 April 2018 / Accepted:
Wei-han Liu Department of Banking and Finance Tamkang University. R/Finance 2009 Conference 1
 Detecting Structural Breaks in Tail Behavior -From the Perspective of Fitting the Generalized Pareto Distribution Wei-han Liu Department of Banking and Finance Tamkang University R/Finance 2009 Conference
Bayesian spatial hierarchical modeling for temperature extremes
 Bayesian spatial hierarchical modeling for temperature extremes Indriati Bisono Dr. Andrew Robinson Dr. Aloke Phatak Mathematics and Statistics Department The University of Melbourne Maths, Informatics
A New Class of Tail-dependent Time Series Models and Its Applications in Financial Time Series
 A New Class of Tail-dependent Time Series Models and Its Applications in Financial Time Series Zhengjun Zhang Department of Mathematics, Washington University, Saint Louis, MO 63130-4899, USA Abstract
Bayesian nonparametrics for multivariate extremes including censored data. EVT 2013, Vimeiro. Anne Sabourin. September 10, 2013
 Bayesian nonparametrics for multivariate extremes including censored data Anne Sabourin PhD advisors: Anne-Laure Fougères (Lyon 1), Philippe Naveau (LSCE, Saclay). Joint work with Benjamin Renard, IRSTEA,
Math 576: Quantitative Risk Management
 Math 576: Quantitative Risk Management Haijun Li lih@math.wsu.edu Department of Mathematics Washington State University Week 11 Haijun Li Math 576: Quantitative Risk Management Week 11 1 / 21 Outline 1
Distributed Scheduling for Achieving Multi-User Diversity (Capacity of Opportunistic Scheduling in Heterogeneous Networks)
") Distributed Scheduling for Achieving Multi-User Diversity (Capacity of Opportunistic Scheduling in Heterogeneous Networks) Sefi Kampeas, Ben-Gurion University Joint work with Asaf Cohen and Omer Gurewitz
Distributed Scheduling for Achieving Multi-User Diversity (Capacity of Opportunistic Scheduling in Heterogeneous Networks) Sefi Kampeas, Ben-Gurion University Joint work with Asaf Cohen and Omer Gurewitz
A BAYESIAN APPROACH FOR ESTIMATING EXTREME QUANTILES UNDER A SEMIPARAMETRIC MIXTURE MODEL ABSTRACT KEYWORDS
 A BAYESIAN APPROACH FOR ESTIMATING EXTREME QUANTILES UNDER A SEMIPARAMETRIC MIXTURE MODEL BY STEFANO CABRAS AND MARÍA EUGENIA CASTELLANOS ABSTRACT In this paper we propose an additive mixture model, where
Extremes and Atmospheric Data
 Extremes and Atmospheric Data Eric Gilleland Research Applications Laboratory National Center for Atmospheric Research 2007-08 Program on Risk Analysis, Extreme Events and Decision Theory, opening workshop
Extreme Value Analysis of Tropical Cyclone Trapped-Fetch Waves
 VOLUME 46 J O U R N A L O F A P P L I E D M E T E O R O L O G Y A N D C L I M A T O L O G Y OCTOBER 2007 Extreme Value Analysis of Tropical Cyclone Trapped-Fetch Waves ALLAN W. MACAFEE AND SAMUEL W. K.
Modelling Multivariate Peaks-over-Thresholds using Generalized Pareto Distributions
 Modelling Multivariate Peaks-over-Thresholds using Generalized Pareto Distributions Anna Kiriliouk 1 Holger Rootzén 2 Johan Segers 1 Jennifer L. Wadsworth 3 1 Université catholique de Louvain (BE) 2 Chalmers
STATISTICAL MODELS FOR QUANTIFYING THE SPATIAL DISTRIBUTION OF SEASONALLY DERIVED OZONE STANDARDS
 STATISTICAL MODELS FOR QUANTIFYING THE SPATIAL DISTRIBUTION OF SEASONALLY DERIVED OZONE STANDARDS Eric Gilleland Douglas Nychka Geophysical Statistics Project National Center for Atmospheric Research Supported
Ronald Christensen. University of New Mexico. Albuquerque, New Mexico. Wesley Johnson. University of California, Irvine. Irvine, California
 Texts in Statistical Science Bayesian Ideas and Data Analysis An Introduction for Scientists and Statisticians Ronald Christensen University of New Mexico Albuquerque, New Mexico Wesley Johnson University
EVA Tutorial #2 PEAKS OVER THRESHOLD APPROACH. Rick Katz
 1 EVA Tutorial #2 PEAKS OVER THRESHOLD APPROACH Rick Katz Institute for Mathematics Applied to Geosciences National Center for Atmospheric Research Boulder, CO USA email: rwk@ucar.edu Home page: www.isse.ucar.edu/staff/katz/
Extreme value statistics: from one dimension to many. Lecture 1: one dimension Lecture 2: many dimensions
 Extreme value statistics: from one dimension to many Lecture 1: one dimension Lecture 2: many dimensions The challenge for extreme value statistics right now: to go from 1 or 2 dimensions to 50 or more
The Behavior of Multivariate Maxima of Moving Maxima Processes
 The Behavior of Multivariate Maxima of Moving Maxima Processes Zhengjun Zhang Department of Mathematics Washington University Saint Louis, MO 6313-4899 USA Richard L. Smith Department of Statistics University
Extreme Value Theory as a Theoretical Background for Power Law Behavior
 Extreme Value Theory as a Theoretical Background for Power Law Behavior Simone Alfarano 1 and Thomas Lux 2 1 Department of Economics, University of Kiel, alfarano@bwl.uni-kiel.de 2 Department of Economics,
Estimation of Quantiles
 9 Estimation of Quantiles The notion of quantiles was introduced in Section 3.2: recall that a quantile x α for an r.v. X is a constant such that P(X x α )=1 α. (9.1) In this chapter we examine quantiles
STATISTICS OF CLIMATE EXTREMES// TRENDS IN CLIMATE DATASETS
 STATISTICS OF CLIMATE EXTREMES// TRENDS IN CLIMATE DATASETS Richard L Smith Departments of STOR and Biostatistics, University of North Carolina at Chapel Hill and Statistical and Applied Mathematical Sciences
CTDL-Positive Stable Frailty Model
 CTDL-Positive Stable Frailty Model M. Blagojevic 1, G. MacKenzie 2 1 Department of Mathematics, Keele University, Staffordshire ST5 5BG,UK and 2 Centre of Biostatistics, University of Limerick, Ireland
Nonparametric Estimation of the Dependence Function for a Multivariate Extreme Value Distribution
 Nonparametric Estimation of the Dependence Function for a Multivariate Extreme Value Distribution p. /2 Nonparametric Estimation of the Dependence Function for a Multivariate Extreme Value Distribution
Freeway rear-end collision risk for Italian freeways. An extreme value theory approach
 XXII SIDT National Scientific Seminar Politecnico di Bari 14 15 SETTEMBRE 2017 Freeway rear-end collision risk for Italian freeways. An extreme value theory approach Gregorio Gecchele Federico Orsini University
Sharp statistical tools Statistics for extremes
 Sharp statistical tools Statistics for extremes Georg Lindgren Lund University October 18, 2012 SARMA Background Motivation We want to predict outside the range of observations Sums, averages and proportions
of the 7 stations. In case the number of daily ozone maxima in a month is less than 15, the corresponding monthly mean was not computed, being treated
 Spatial Trends and Spatial Extremes in South Korean Ozone Seokhoon Yun University of Suwon, Department of Applied Statistics Suwon, Kyonggi-do 445-74 South Korea syun@mail.suwon.ac.kr Richard L. Smith
Modelling Operational Risk Using Bayesian Inference
 Pavel V. Shevchenko Modelling Operational Risk Using Bayesian Inference 4y Springer 1 Operational Risk and Basel II 1 1.1 Introduction to Operational Risk 1 1.2 Defining Operational Risk 4 1.3 Basel II
DOWNSCALING EXTREMES: A COMPARISON OF EXTREME VALUE DISTRIBUTIONS IN POINT-SOURCE AND GRIDDED PRECIPITATION DATA
 The Annals of Applied Statistics 2010, Vol. 4, No. 1, 484 502 DOI: 10.1214/09-AOAS287 Institute of Mathematical Statistics, 2010 DOWNSCALING EXTREMES: A COMPARISON OF EXTREME VALUE DISTRIBUTIONS IN POINT-SOURCE
Accommodating measurement scale uncertainty in extreme value analysis of. northern North Sea storm severity
 Introduction Model Analysis Conclusions Accommodating measurement scale uncertainty in extreme value analysis of northern North Sea storm severity Yanyun Wu, David Randell, Daniel Reeve Philip Jonathan,
A class of probability distributions for application to non-negative annual maxima
 Hydrol. Earth Syst. Sci. Discuss., doi:.94/hess-7-98, 7 A class of probability distributions for application to non-negative annual maxima Earl Bardsley School of Science, University of Waikato, Hamilton
Extreme value modelling of rainfalls and
 Universite de Paris Sud Master s Thesis Extreme value modelling of rainfalls and flows Author: Fan JIA Supervisor: Pr Elisabeth Gassiat Dr Elena Di Bernardino Pr Michel Bera A thesis submitted in fulfilment
Tail negative dependence and its applications for aggregate loss modeling
 Tail negative dependence and its applications for aggregate loss modeling Lei Hua Division of Statistics Oct 20, 2014, ISU L. Hua (NIU) 1/35 1 Motivation 2 Tail order Elliptical copula Extreme value copula
Abstract: In this short note, I comment on the research of Pisarenko et al. (2014) regarding the
 regarding the") Comment on Pisarenko et al. Characterization of the Tail of the Distribution of Earthquake Magnitudes by Combining the GEV and GPD Descriptions of Extreme Value Theory Mathias Raschke Institution: freelancer
Comment on Pisarenko et al. Characterization of the Tail of the Distribution of Earthquake Magnitudes by Combining the GEV and GPD Descriptions of Extreme Value Theory Mathias Raschke Institution: freelancer
Models for Spatial Extremes. Dan Cooley Department of Statistics Colorado State University. Work supported in part by NSF-DMS
 Models for Spatial Extremes Dan Cooley Department of Statistics Colorado State University Work supported in part by NSF-DMS 0905315 Outline 1. Introduction Statistics for Extremes Climate and Weather 2.
Fall 2017 STAT 532 Homework Peter Hoff. 1. Let P be a probability measure on a collection of sets A.
 1. Let P be a probability measure on a collection of sets A. (a) For each n N, let H n be a set in A such that H n H n+1. Show that P (H n ) monotonically converges to P ( k=1 H k) as n. (b) For each n
Journal of Environmental Statistics
 jes Journal of Environmental Statistics February 2010, Volume 1, Issue 3. http://www.jenvstat.org Exponentiated Gumbel Distribution for Estimation of Return Levels of Significant Wave Height Klara Persson