Comparative Genomics of Fagaceae
|
|
|
- Iris Martin
- 5 years ago
- Views:
Transcription


1 Fagaceae Images.google.com Linkage Map TM
2 Selection of mapping parents SM2 SM1 Predominant pollinator?
3 Progeny Exclusion for Full Sib Linkage Mapping Year Acorns genotyped SM2 pollinated All acorns genotyped across 6 microsatellite markers. Also all potential pollinators within 200 m of SM1 Exclude all acorns except those pollinated by SM2 Parentage analysis done with CERVUS.

4 Pollination rates in SM1 by SM2 across years SM2 paternity (%) across years Our current mapping population composed of 510 full sibs.
5 SSR markers developed and mapped Developing codominant SSRs Primary amplification test. Temperature gradient. Test of informativeness in parents. Informative markers configurations ab x cd, ef x eg, hk x hk, nn x np, lm x ll SSR Mapping 37 gssrs ( 26 with CA repeats, 11 with GA repeats) 39 Q. rubra EST-SSRs from FGP ( 181 screened & 148 amplified) 31 Q. robur EST-SSRs ( 113 screened & 99 amplified) 1 EST-SSR from Castanea mollissima.
6 SSR Framework Map of Q.rubra 1 (6) 2 (8) 3 (1) 4 (2)
 7 (4)")
7 5 (5) 6 (12) 7 (4) 8 (7)
8 9 (3) 10 (9) 11 (10) 12 (11)
9 Comparative Mapping Marker Name Linkage Gr. in Q. rubra Linkage Gr. in Q. robur FIR 021, FIR027, GOT040, GOT063, PIE111, VIT PIE099,PIE PIE FIR065, GOT066,POR FIR053, PIE FIR008,GOT009, PIE039, PIE126, PIE PIE002, PIE228, WAG FIR030, FIR095, GOT004, PIE PIE FIR026, PIE POR FIR
10 Fagaceae Mapping Parents Screening Panel Screening Panel included mapping parents from: American white oak (Quercus alba) American beech (Fagus grandifolia) Chinese chestnut (Castanea mollissima) American chestnut (Castanea dentata) English oak (Quercus robur) Sessile oak (Quercus petraea) Interspecific cross of Quercus robur x Quercus petraea

11 % markers amplified Amplification of Q.rubra markers across Fagaceae Mapping Parent Test Panel CA_gSSRs EST-SSRs Quercus alba Fagus grandifolia Castanea mollissima Castanea dentata Quercus robur Quercus petraea Q.robur x Q.patrea
12 High density RAD-tag Mapping in Quercus rubra Experimental approach: High quality DNA was extracted using QIAGEN for 250 full sibs. Genomic DNA was double digested with EcoRI-MseI for producing RAD-tags. Illumina HiSeq platform used for sequencing. High coverage parent lane (one lane/2 parents) 5 lanes of 50 progeny each. Bioinformatics: Reference loci identified from high coverage parent allele calls. Full sibs genotyped relative to parental allele calls. Data formatted and changed into a JoinMap readable format.
13 JoinMap 4.1 Pre-mapping quality control Missing data Extreme deviation from Mendelian expectation Similarity of loci. Grouping LOD value of for grouping test statistic. Grouping tree visually checked for selection of groups. Q. rubra and Q. robur gssr and EST-SSR markers used as anchor tags for identifying LGs. Mapping Maximum likelihood and Regression mapping algorithm with default criteria.
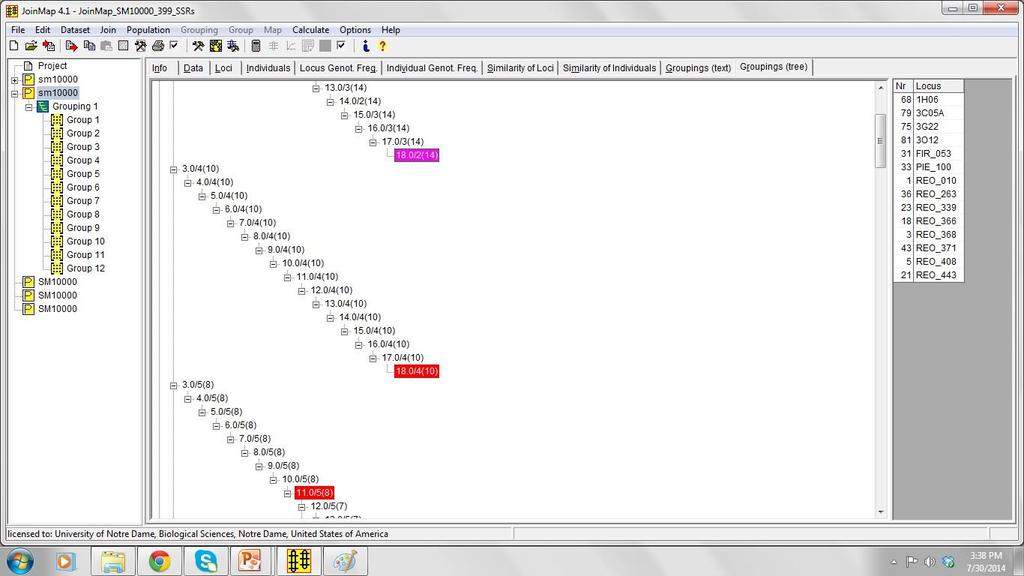
14


15 Construction of RAD-tag pipeline SAM Tools GATK Oak2 Total # markers : 32,976 >30% missing data: >10 chi square value: 7994 Total # markers : 8,607 >30% missing data: 3529 > 10 chi square value : 1367 Oak3 Total # markers : 6977 >30% missing data: 1740 >10 chi square value: 6 Total # markers : 5,844 >30% missing data: 1432 > 10 chi square value : 100
16 Mapping RAD-tag markers 7994 RAD TAG SSRs 1 st : 108 SSRs +392 RAD 2 nd : 108 SSRs +200 old RAD +200 new RAD 3 rd :108 SSRs 4th:108 SSRs +200 RAD from +200 RAD from 2nd 3rd +200 new RAD +200 new RAD END
17 In silico Comparative Mapping Quercus rubra Quercus robur Mapped EST-SSRs Mapped SNP Sequence WGS Castanea mollissima Mapped EST-SSRs EST-SSRs X X X X RAD- tags X X X X X WGS


18 Phenotypes Bud burst Marcescence Leaf morphometrics Leaf nitrogen and carbon content QTL Mapping Phenotypic Data Collection Bud burst and marcescence 2012, 2013 and 2014 Leaf morphometrics 2013 and 2014 Clonally propagated Q.rubra mapping population SM1 SM2
19 Paper Submission Development and cross species transferability of genomic and EST microsatellite markers in Quercus rubra. L for comparative mapping in the Fagaceae ready for submission in Plant molecular biology reporter. First high density northern red oak mapping paper Fall 2014 Bioinformatics' RAD-tag paper Fall 2014 Comparative mapping papers Spring 2015 QTL paper 2015

20 JRS lab and ND Acknowledgements Professor. Jeanne Romero Severson Lab Technician: Lauren Fiedler Graduate Students: Daniel Borkowski, Andi Noakes Undergraduate: Rebecca Bullis Collaborators: Dr. Scott Emrich, Olivia Choudhury Notre Dame Genomics and Bioinformatics core facility: Brent Harker Melissa Pullins Grant # TRPGR IOS
Local genetic adaptation to drought: oak species as an example
 Local genetic adaptation to drought: oak species as an example Oliver Gailing 1,2, Jennifer Lind 2, Barbara Vornam 1, Reiner Finkeldey 1 1 University of Göttingen, Germany 2 Michigan Technological University,
MOLECULAR MAPS AND MARKERS FOR DIPLOID ROSES
 MOLECULAR MAPS AND MARKERS FOR DIPLOID ROSES Patricia E Klein, Mandy Yan, Ellen Young, Jeekin Lau, Stella Kang, Natalie Patterson, Natalie Anderson and David Byrne Department of Horticultural Sciences,
Calculation of IBD probabilities
 Calculation of IBD probabilities David Evans University of Bristol This Session Identity by Descent (IBD) vs Identity by state (IBS) Why is IBD important? Calculating IBD probabilities Lander-Green Algorithm
1 Springer. Nan M. Laird Christoph Lange. The Fundamentals of Modern Statistical Genetics
 1 Springer Nan M. Laird Christoph Lange The Fundamentals of Modern Statistical Genetics 1 Introduction to Statistical Genetics and Background in Molecular Genetics 0 0 1 0 0 0 0 0 0 0 0 0 0 0 0 0 0 0 0
Calculation of IBD probabilities
 Calculation of IBD probabilities David Evans and Stacey Cherny University of Oxford Wellcome Trust Centre for Human Genetics This Session IBD vs IBS Why is IBD important? Calculating IBD probabilities
Genotyping By Sequencing (GBS) Method Overview
 Method Overview") enotyping By Sequencing (BS) Method Overview Sharon E Mitchell Institute for enomic Diversity Cornell University http://wwwmaizegeneticsnet/ Topics Presented Background/oals BS lab protocol Illumina sequencing
enotyping By Sequencing (BS) Method Overview Sharon E Mitchell Institute for enomic Diversity Cornell University http://wwwmaizegeneticsnet/ Topics Presented Background/oals BS lab protocol Illumina sequencing
Genotype Imputation. Biostatistics 666
 Genotype Imputation Biostatistics 666 Previously Hidden Markov Models for Relative Pairs Linkage analysis using affected sibling pairs Estimation of pairwise relationships Identity-by-Descent Relatives
Developing and implementing molecular markers in perennial ryegrass breeding
 Developing and implementing molecular markers in perennial ryegrass breeding K.F. Smith 1,3, J.W. Forster 2,3, T.A. Ciavarella 1,3, J.L. Dumsday 2, M.P. Dupal 2,3, E.S. Jones 2,3, B.D. Kirkwood 1,3, A.
Genotyping By Sequencing (GBS) Method Overview
 Method Overview") enotyping By Sequencing (BS) Method Overview RJ Elshire, JC laubitz, Q Sun, JV Harriman ES Buckler, and SE Mitchell http://wwwmaizegeneticsnet/ Topics Presented Background/oals BS lab protocol Illumina
enotyping By Sequencing (BS) Method Overview RJ Elshire, JC laubitz, Q Sun, JV Harriman ES Buckler, and SE Mitchell http://wwwmaizegeneticsnet/ Topics Presented Background/oals BS lab protocol Illumina
Principles of QTL Mapping. M.Imtiaz
 Principles of QTL Mapping M.Imtiaz Introduction Definitions of terminology Reasons for QTL mapping Principles of QTL mapping Requirements For QTL Mapping Demonstration with experimental data Merit of QTL
Developing summerdormant tall fescue for the southern Great Plains
 Developing summerdormant tall fescue for the southern Great Plains Persistence is the major constraint of growing tall fescue in south-central USA 40-60% stand loss in a year Improve persistence Drought
Accounting for read depth in the analysis of genotyping-by-sequencing data
 Accounting for read depth in the analysis of genotyping-by-sequencing data Ken Dodds, John McEwan, Timothy Bilton, Rudi Brauning, Rayna Anderson, Tracey Van Stijn, Theodor Kristjánsson, Shannon Clarke
Lecture WS Evolutionary Genetics Part I 1
 Quantitative genetics Quantitative genetics is the study of the inheritance of quantitative/continuous phenotypic traits, like human height and body size, grain colour in winter wheat or beak depth in
Proportional Variance Explained by QLT and Statistical Power. Proportional Variance Explained by QTL and Statistical Power
 Proportional Variance Explained by QTL and Statistical Power Partitioning the Genetic Variance We previously focused on obtaining variance components of a quantitative trait to determine the proportion
Fei Lu. Post doctoral Associate Cornell University
 Fei Lu Post doctoral Associate Cornell University http://www.maizegenetics.net Genotyping by sequencing (GBS) is simple and cost effective 1. Digest DNA 2. Ligate adapters with barcodes 3. Pool DNAs 4.
Lecture 9. QTL Mapping 2: Outbred Populations
 Lecture 9 QTL Mapping 2: Outbred Populations Bruce Walsh. Aug 2004. Royal Veterinary and Agricultural University, Denmark The major difference between QTL analysis using inbred-line crosses vs. outbred
New imputation strategies optimized for crop plants: FILLIN (Fast, Inbred Line Library ImputatioN) FSFHap (Full Sib Family Haplotype)
 FSFHap (Full Sib Family Haplotype)") New imputation strategies optimized for crop plants: FILLIN (Fast, Inbred Line Library ImputatioN) FSFHap (Full Sib Family Haplotype) Kelly Swarts PAG Allele Mining 1/11/2014 Imputation is the projection
New imputation strategies optimized for crop plants: FILLIN (Fast, Inbred Line Library ImputatioN) FSFHap (Full Sib Family Haplotype) Kelly Swarts PAG Allele Mining 1/11/2014 Imputation is the projection
Impact of genetic variation in stomatal conductance on water use efficiency in Quercus robur. Oliver Brendel. INRA Nancy France
 Impact of genetic variation in stomatal conductance on water use efficiency in Quercus robur Oliver Brendel INRA Nancy France Unit of Forest Ecology and Ecophysiology In collaboration with INRA Pierroton
Detection of triploids in the INRA collection
 Wild cherry triploids: a chance for forest breeders? L Serres-Giardi, J Dufour, F Santi VALBRO Growing Valuable Broadleaved Tree species 2008, October 6-8 Freiburg - Germany A L I M E N T A T I O N A G
Lecture 2: Genetic Association Testing with Quantitative Traits. Summer Institute in Statistical Genetics 2017
 Lecture 2: Genetic Association Testing with Quantitative Traits Instructors: Timothy Thornton and Michael Wu Summer Institute in Statistical Genetics 2017 1 / 29 Introduction to Quantitative Trait Mapping
Prediction of the Confidence Interval of Quantitative Trait Loci Location
 Behavior Genetics, Vol. 34, No. 4, July 2004 ( 2004) Prediction of the Confidence Interval of Quantitative Trait Loci Location Peter M. Visscher 1,3 and Mike E. Goddard 2 Received 4 Sept. 2003 Final 28
Statistical issues in QTL mapping in mice
 Statistical issues in QTL mapping in mice Karl W Broman Department of Biostatistics Johns Hopkins University http://www.biostat.jhsph.edu/~kbroman Outline Overview of QTL mapping The X chromosome Mapping
Microsatellite data analysis. Tomáš Fér & Filip Kolář
 Microsatellite data analysis Tomáš Fér & Filip Kolář Multilocus data dominant heterozygotes and homozygotes cannot be distinguished binary biallelic data (fragments) presence (dominant allele/heterozygote)
Explore SNP polymorphism data. A. Dereeper, Y. Hueber
 Explore SNP polymorphism data A. Dereeper, Y. Hueber Bioinformatics trainings, Supagro, February, 2016 Tablet Graphical tool to visualize assemblies Accept many formats ACE, SAM, BAM GATK (Genome Analysis
Introduction to QTL mapping in model organisms
 Introduction to QTL mapping in model organisms Karl W Broman Department of Biostatistics and Medical Informatics University of Wisconsin Madison www.biostat.wisc.edu/~kbroman [ Teaching Miscellaneous lectures]
Introduction to QTL mapping in model organisms
 Introduction to QTL mapping in model organisms Karl Broman Biostatistics and Medical Informatics University of Wisconsin Madison kbroman.org github.com/kbroman @kwbroman Backcross P 1 P 2 P 1 F 1 BC 4
Assessment of Genetic Diversity of Pawpaw Cultivars with Inter-Simple Sequence Repeat Markers
 Assessment of Genetic Diversity of Pawpaw Cultivars with Inter-Simple Sequence Repeat Markers Kirk W. Pomper*, Sheri B. Crabtree, and Snake C. Jones Kentucky State University What is Pawpaw? Asimina triloba
Microsatellite evolution in Adélie penguins
 Microsatellite evolution in Adélie penguins Bennet McComish School of Mathematics and Physics Microsatellites Tandem repeats of motifs up to 6bp, e.g. (AC) 6 = ACACACACACAC Length is highly polymorphic.
Microsatellites as genetic tools for monitoring escapes and introgression
 Microsatellites as genetic tools for monitoring escapes and introgression Alexander TRIANTAFYLLIDIS & Paulo A. PRODÖHL What are microsatellites? Microsatellites (SSR Simple Sequence Repeats) The repeat
Supplementary Figure 1. Phenotype of the HI strain.
 Supplementary Figure 1. Phenotype of the HI strain. (A) Phenotype of the HI and wild type plant after flowering (~1month). Wild type plant is tall with well elongated inflorescence. All four HI plants
Gene mapping in model organisms
 Gene mapping in model organisms Karl W Broman Department of Biostatistics Johns Hopkins University http://www.biostat.jhsph.edu/~kbroman Goal Identify genes that contribute to common human diseases. 2
Evolution of phenotypic traits
 Quantitative genetics Evolution of phenotypic traits Very few phenotypic traits are controlled by one locus, as in our previous discussion of genetics and evolution Quantitative genetics considers characters
Lecture 11: Multiple trait models for QTL analysis
 Lecture 11: Multiple trait models for QTL analysis Julius van der Werf Multiple trait mapping of QTL...99 Increased power of QTL detection...99 Testing for linked QTL vs pleiotropic QTL...100 Multiple
UNIT 8 BIOLOGY: Meiosis and Heredity Page 148
 UNIT 8 BIOLOGY: Meiosis and Heredity Page 148 CP: CHAPTER 6, Sections 1-6; CHAPTER 7, Sections 1-4; HN: CHAPTER 11, Section 1-5 Standard B-4: The student will demonstrate an understanding of the molecular
Association Testing with Quantitative Traits: Common and Rare Variants. Summer Institute in Statistical Genetics 2014 Module 10 Lecture 5
 Association Testing with Quantitative Traits: Common and Rare Variants Timothy Thornton and Katie Kerr Summer Institute in Statistical Genetics 2014 Module 10 Lecture 5 1 / 41 Introduction to Quantitative
Managing segregating populations
 Managing segregating populations Aim of the module At the end of the module, we should be able to: Apply the general principles of managing segregating populations generated from parental crossing; Describe
GBS Bioinformatics Pipeline(s) Overview
 Overview") GBS Bioinformatics Pipeline(s) Overview Getting from sequence files to genotypes. Pipeline Coding: Ed Buckler Jeff Glaubitz James Harriman Presentation: Terry Casstevens With supporting information from
GBS Bioinformatics Pipeline(s) Overview Getting from sequence files to genotypes. Pipeline Coding: Ed Buckler Jeff Glaubitz James Harriman Presentation: Terry Casstevens With supporting information from
Epigenetic vs. genetic diversity of stenoendemic short toothed sage (Salvia brachyodon Vandas)
") Epigenetic vs. genetic diversity of stenoendemic short toothed sage (Salvia brachyodon Vandas) Biruš, I., Liber, Z., Radosavljević, I., Bogdanović, S., Jug Dujaković, M., Zoldoš, V., Šatović, Z. Balkan
Epigenetic vs. genetic diversity of stenoendemic short toothed sage (Salvia brachyodon Vandas) Biruš, I., Liber, Z., Radosavljević, I., Bogdanović, S., Jug Dujaković, M., Zoldoš, V., Šatović, Z. Balkan
2. Map genetic distance between markers
 Chapter 5. Linkage Analysis Linkage is an important tool for the mapping of genetic loci and a method for mapping disease loci. With the availability of numerous DNA markers throughout the human genome,
Nature Genetics: doi: /ng Supplementary Figure 1. The phenotypes of PI , BR121, and Harosoy under short-day conditions.
 Supplementary Figure 1 The phenotypes of PI 159925, BR121, and Harosoy under short-day conditions. (a) Plant height. (b) Number of branches. (c) Average internode length. (d) Number of nodes. (e) Pods
Bias in RNA sequencing and what to do about it
 Bias in RNA sequencing and what to do about it Walter L. (Larry) Ruzzo Computer Science and Engineering Genome Sciences University of Washington Fred Hutchinson Cancer Research Center Seattle, WA, USA
Linkage analysis and QTL mapping in autotetraploid species. Christine Hackett Biomathematics and Statistics Scotland Dundee DD2 5DA
 Linkage analysis and QTL mapping in autotetraploid species Christine Hackett Biomathematics and Statistics Scotland Dundee DD2 5DA Collaborators John Bradshaw Zewei Luo Iain Milne Jim McNicol Data and
Molecular characterisation of a population derived from microspores of Brassica napus B. carinata hybrids
 Molecular characterisation of a population derived from microspores of Brassica napus B. carinata hybrids Annaliese Mason 1, Matthew Nelson 1,2, Guijun Yan 1 and Wallace Cowling 1,2 1 School of Plant Biology,
Expression QTLs and Mapping of Complex Trait Loci. Paul Schliekelman Statistics Department University of Georgia
 Expression QTLs and Mapping of Complex Trait Loci Paul Schliekelman Statistics Department University of Georgia Definitions: Genes, Loci and Alleles A gene codes for a protein. Proteins due everything.
Introduction to QTL mapping in model organisms
 Introduction to QTL mapping in model organisms Karl W Broman Department of Biostatistics Johns Hopkins University kbroman@jhsph.edu www.biostat.jhsph.edu/ kbroman Outline Experiments and data Models ANOVA
Phenotypic plasticity, QTL mapping and genomic characterization of bud set in black poplar
 RESEARCH ARTICLE Open Access Phenotypic plasticity, QTL mapping and genomic characterization of bud set in black poplar Francesco Fabbrini 1, Muriel Gaudet 1, Catherine Bastien 2, Giusi Zaina 3, Antoine
Lesson Plan non mendelian inheritance
 Lesson Plan non mendelian inheritance LEYNAR LEYTON NARANJO PH.D. STUDENT. INSTITUTE OF PLANT BREEDING, GENETICS AND GENOMICS Author(s): Author Affiliation and Location. Author Website Author Contact Information
THE USE OF MOLECULAR MARKERS IN THE MANAGEMENT AND IMPROVEMENT OF AVOCADO (Persea americana Mill.)
") 1 1999. Revista Chapingo Serie Horticultura 5: 227-231. THE USE OF MOLECULAR MARKERS IN THE MANAGEMENT AND IMPROVEMENT OF AVOCADO (Persea americana Mill.) M. T. Clegg 1 ; M. Kobayashi 2 ; J.-Z. Lin 1 1
1 1999. Revista Chapingo Serie Horticultura 5: 227-231. THE USE OF MOLECULAR MARKERS IN THE MANAGEMENT AND IMPROVEMENT OF AVOCADO (Persea americana Mill.) M. T. Clegg 1 ; M. Kobayashi 2 ; J.-Z. Lin 1 1
Chapter 2: Extensions to Mendel: Complexities in Relating Genotype to Phenotype.
 Chapter 2: Extensions to Mendel: Complexities in Relating Genotype to Phenotype. please read pages 38-47; 49-55;57-63. Slide 1 of Chapter 2 1 Extension sot Mendelian Behavior of Genes Single gene inheritance
Towards a high and sustainable biomass production: the Salix molecular breeding activities program (SAMBA)
") Towards a high and sustainable biomass production: the Salix molecular breeding activities program (SAMBA) Ann Christin Rönnberg-Wästljung*, Berit Samils, Nils-Erik Nordh, Jan Stenlid & Martin Weih *Dept.
Towards a high and sustainable biomass production: the Salix molecular breeding activities program (SAMBA) Ann Christin Rönnberg-Wästljung*, Berit Samils, Nils-Erik Nordh, Jan Stenlid & Martin Weih *Dept.
GBLUP and G matrices 1
 GBLUP and G matrices 1 GBLUP from SNP-BLUP We have defined breeding values as sum of SNP effects:! = #$ To refer breeding values to an average value of 0, we adopt the centered coding for genotypes described
GBS Bioinformatics Pipeline(s) Overview
 Overview") GBS Bioinformatics Pipeline(s) Overview Getting from sequence files to genotypes. Pipeline Coding: Ed Buckler Jeff Glaubitz James Harriman Presentation: Rob Elshire With supporting information from the
GBS Bioinformatics Pipeline(s) Overview Getting from sequence files to genotypes. Pipeline Coding: Ed Buckler Jeff Glaubitz James Harriman Presentation: Rob Elshire With supporting information from the
Unit 3 - Molecular Biology & Genetics - Review Packet
 Name Date Hour Unit 3 - Molecular Biology & Genetics - Review Packet True / False Questions - Indicate True or False for the following statements. 1. Eye color, hair color and the shape of your ears can
Conservation Genetics. Outline
 Conservation Genetics The basis for an evolutionary conservation Outline Introduction to conservation genetics Genetic diversity and measurement Genetic consequences of small population size and extinction.
I Have the Power in QTL linkage: single and multilocus analysis
 I Have the Power in QTL linkage: single and multilocus analysis Benjamin Neale 1, Sir Shaun Purcell 2 & Pak Sham 13 1 SGDP, IoP, London, UK 2 Harvard School of Public Health, Cambridge, MA, USA 3 Department
Maize Genetics Cooperation Newsletter Vol Derkach 1
 Maize Genetics Cooperation Newsletter Vol 91 2017 Derkach 1 RELATIONSHIP BETWEEN MAIZE LANCASTER INBRED LINES ACCORDING TO SNP-ANALYSIS Derkach K. V., Satarova T. M., Dzubetsky B. V., Borysova V. V., Cherchel
MARKER ASSISTED SELECTION (MAS) FOR DROUGHT TOLERANCE IN WHEAT USING MARKERS ASSOCIATED WITH MEMBRANE STABILITY
 FOR DROUGHT TOLERANCE IN WHEAT USING MARKERS ASSOCIATED WITH MEMBRANE STABILITY") AN. I.N.C.D.A. FUNDULEA, VOL. LXXVII, 2009 GENETICA ŞI AMELIORAREA PLANTELOR MARKER ASSISTED SELECTION (MAS) FOR DROUGHT TOLERANCE IN WHEAT USING MARKERS ASSOCIATED WITH MEMBRANE STABILITY SELECŢIA ASISTATĂ
AN. I.N.C.D.A. FUNDULEA, VOL. LXXVII, 2009 GENETICA ŞI AMELIORAREA PLANTELOR MARKER ASSISTED SELECTION (MAS) FOR DROUGHT TOLERANCE IN WHEAT USING MARKERS ASSOCIATED WITH MEMBRANE STABILITY SELECŢIA ASISTATĂ
GREAT LAKES FISHERY COMMISSION Project Completion Report 1
 GREAT LAKES FISHERY COMMISSION 22 Project Completion Report 1 Genetic assignment of larval parentage as a means of assessing mechanisms underlying adult reproductive success and larval dispersal by: K.T.
Analysis of Y-STR Profiles in Mixed DNA using Next Generation Sequencing
 Analysis of Y-STR Profiles in Mixed DNA using Next Generation Sequencing So Yeun Kwon, Hwan Young Lee, and Kyoung-Jin Shin Department of Forensic Medicine, Yonsei University College of Medicine, Seoul,
PRINCIPLES OF MENDELIAN GENETICS APPLICABLE IN FORESTRY. by Erich Steiner 1/
 PRINCIPLES OF MENDELIAN GENETICS APPLICABLE IN FORESTRY by Erich Steiner 1/ It is well known that the variation exhibited by living things has two components, one hereditary, the other environmental. One
Linkage Mapping. Reading: Mather K (1951) The measurement of linkage in heredity. 2nd Ed. John Wiley and Sons, New York. Chapters 5 and 6.
 The measurement of linkage in heredity. 2nd Ed. John Wiley and Sons, New York. Chapters 5 and 6.") Linkage Mapping Reading: Mather K (1951) The measurement of linkage in heredity. 2nd Ed. John Wiley and Sons, New York. Chapters 5 and 6. Genetic maps The relative positions of genes on a chromosome can
Linkage Mapping Reading: Mather K (1951) The measurement of linkage in heredity. 2nd Ed. John Wiley and Sons, New York. Chapters 5 and 6. Genetic maps The relative positions of genes on a chromosome can
THE GENETIC BASIS OF FLORAL TRAITS ASSOCIATED WITH MATING SYSTEM EVOLUTION IN LEPTOSIPHON (POLEMONIACEAE): AN ANALYSIS OF QUANTITATIVE TRAIT LOCI
: AN ANALYSIS OF QUANTITATIVE TRAIT LOCI") Evolution, 60(3), 2006, pp. 491 504 THE GENETIC BASIS OF FLORAL TRAITS ASSOCIATED WITH MATING SYSTEM EVOLUTION IN LEPTOSIPHON (POLEMONIACEAE): AN ANALYSIS OF QUANTITATIVE TRAIT LOCI CAROL GOODWILLIE, 1,2
Evolution, 60(3), 2006, pp. 491 504 THE GENETIC BASIS OF FLORAL TRAITS ASSOCIATED WITH MATING SYSTEM EVOLUTION IN LEPTOSIPHON (POLEMONIACEAE): AN ANALYSIS OF QUANTITATIVE TRAIT LOCI CAROL GOODWILLIE, 1,2
Investigations into biomass yield in perennial ryegrass (Lolium perenne L.)
") Investigations into biomass yield in perennial ryegrass (Lolium perenne L.) Ulrike Anhalt 1,2, Pat Heslop-Harrison 2, Céline Tomaszewski 1,2, Hans-Peter Piepho 3, Oliver Fiehn 4 and Susanne Barth 1 1 2
Investigations into biomass yield in perennial ryegrass (Lolium perenne L.) Ulrike Anhalt 1,2, Pat Heslop-Harrison 2, Céline Tomaszewski 1,2, Hans-Peter Piepho 3, Oliver Fiehn 4 and Susanne Barth 1 1 2
Genetic and physiological approach to elucidation of Cd absorption mechanism by rice plants
 Genetic and physiological approach to elucidation of Cd absorption mechanism by rice plants Satoru Ishikawa National Institute for Agro-Environmental Sciences, 3-1-3, Kannondai, Tsukuba, Ibaraki, 305-8604,
The phenotype of this worm is wild type. When both genes are mutant: The phenotype of this worm is double mutant Dpy and Unc phenotype.
 Series 2: Cross Diagrams - Complementation There are two alleles for each trait in a diploid organism In C. elegans gene symbols are ALWAYS italicized. To represent two different genes on the same chromosome:
Genetic diversity of beech in Greece
 Genetic diversity of beech in Greece A.C. Papageorgiou (1), I. Tsiripidis (2), S. Hatziskakis (1) Democritus University of Thrace Forest Genetics Laboratory Orestiada, Greece (2) Aristotle University of
Plasticity in forest trees: a brief review and a few thoughts
 Plasticity in forest trees: a brief review and a few thoughts GEA, Montpellier, 2008 from INRA plasticity team: C. Bastien, V. Jorge, A. Martinez, L. Paques, P. Rozenberg, L. Sanchez. Plasticity has become
A mixed model based QTL / AM analysis of interactions (G by G, G by E, G by treatment) for plant breeding
 for plant breeding") Professur Pflanzenzüchtung Professur Pflanzenzüchtung A mixed model based QTL / AM analysis of interactions (G by G, G by E, G by treatment) for plant breeding Jens Léon 4. November 2014, Oulu Workshop
Professur Pflanzenzüchtung Professur Pflanzenzüchtung A mixed model based QTL / AM analysis of interactions (G by G, G by E, G by treatment) for plant breeding Jens Léon 4. November 2014, Oulu Workshop
1 Global and Neotropical Distribution and Diversity of Oak (genus Quercus) and Oak Forests
 and Oak Forests") 1 Global and Neotropical Distribution and Diversity of Oak (genus Quercus) and Oak Forests 1.1 Introduction The genus Quercus is one of the most important clades of woody angiosperms in the northern hemisphere
1 Global and Neotropical Distribution and Diversity of Oak (genus Quercus) and Oak Forests 1.1 Introduction The genus Quercus is one of the most important clades of woody angiosperms in the northern hemisphere
Heterosis and inbreeding depression of epigenetic Arabidopsis hybrids
 Heterosis and inbreeding depression of epigenetic Arabidopsis hybrids Plant growth conditions The soil was a 1:1 v/v mixture of loamy soil and organic compost. Initial soil water content was determined
2013 Breeding Progress for Rust Resistance in Confection Sunflower
 2013 Breeding Progress for Rust Resistance in Confection Sunflower Guojia Ma 1,2, Yunming Long 1,3, Sam Markell 2, Tom Gulya 1 and Lili Qi 1 1 USDA, ARS, NCSL, Fargo, ND 2 NDSU Plant Pathology, Fargo,
Q Expected Coverage Achievement Merit Excellence. Punnett square completed with correct gametes and F2.
 NCEA Level 2 Biology (91157) 2018 page 1 of 6 Assessment Schedule 2018 Biology: Demonstrate understanding of genetic variation and change (91157) Evidence Q Expected Coverage Achievement Merit Excellence
Quantitative genetics
 Quantitative genetics Many traits that are important in agriculture, biology and biomedicine are continuous in their phenotypes. For example, Crop Yield Stemwood Volume Plant Disease Resistances Body Weight
1. they are influenced by many genetic loci. 2. they exhibit variation due to both genetic and environmental effects.
 October 23, 2009 Bioe 109 Fall 2009 Lecture 13 Selection on quantitative traits Selection on quantitative traits - From Darwin's time onward, it has been widely recognized that natural populations harbor
Introduction to PLINK H3ABionet Course Covenant University, Nigeria
 UNIVERSITY OF THE WITWATERSRAND, JOHANNESBURG Introduction to PLINK H3ABionet Course Covenant University, Nigeria Scott Hazelhurst H3ABioNet funded by NHGRI grant number U41HG006941 Wits Bioinformatics
Gene Discovery for Bud Dormancy Induction and Release in Oak by 454-Pyrosequencing and Q-PCR Analysis. Saneyoshi Ueno FFPRI
 Gene Discovery for Bud Dormancy Induction and Release in Oak by 454-Pyrosequencing and Q-PCR Analysis Saneyoshi Ueno FFPRI 1 Outline Dormancy and bud break phonology in deciduous trees Quercus (Fagaceae)
Linear Regression (1/1/17)
") STA613/CBB540: Statistical methods in computational biology Linear Regression (1/1/17) Lecturer: Barbara Engelhardt Scribe: Ethan Hada 1. Linear regression 1.1. Linear regression basics. Linear regression
STA613/CBB540: Statistical methods in computational biology Linear Regression (1/1/17) Lecturer: Barbara Engelhardt Scribe: Ethan Hada 1. Linear regression 1.1. Linear regression basics. Linear regression
Ben Hecht Columbia River Inter-Tribal Fish Commission March 19, 2013
 The Genetic Basis for the Propensity to Migrate in a Sequestered Population of Rainbow and Steelhead Trout Ben Hecht Columbia River Inter-Tribal Fish Commission March 19, 2013 Migration Cultural, ecological,
Analytic power calculation for QTL linkage analysis of small pedigrees
 (2001) 9, 335 ± 340 ã 2001 Nature Publishing Group All rights reserved 1018-4813/01 $15.00 www.nature.com/ejhg ARTICLE for QTL linkage analysis of small pedigrees FruÈhling V Rijsdijk*,1, John K Hewitt
Transfer of Rust Resistance from Triticum aestivum L. Cultivar Chinese Spring to Cultivar WL 711
 Tropical Agricultural Research Vol. 16:71-78 (2004) Transfer of Rust Resistance from Triticum aestivum L. Cultivar Chinese Spring to Cultivar WL 711 S.P. Withanage and H. S. Dhaliwal 1 Rubber Research
The study of a common beech (Fagus sylvatica) population. Mt Ventoux, France
 population. Mt Ventoux, France") The study of a common beech (Fagus sylvatica) population. Mt Ventoux, France Master II EBEN Ingénieur agronome 3 e année, ENSA Toulouse Réunion CAQSIS 5/4/16 Montpellier In the northern hemisphere, climate
The study of a common beech (Fagus sylvatica) population. Mt Ventoux, France Master II EBEN Ingénieur agronome 3 e année, ENSA Toulouse Réunion CAQSIS 5/4/16 Montpellier In the northern hemisphere, climate
R/qtl workshop. (part 2) Karl Broman. Biostatistics and Medical Informatics University of Wisconsin Madison. kbroman.org
 Karl Broman. Biostatistics and Medical Informatics University of Wisconsin Madison. kbroman.org") R/qtl workshop (part 2) Karl Broman Biostatistics and Medical Informatics University of Wisconsin Madison kbroman.org github.com/kbroman @kwbroman Example Sugiyama et al. Genomics 71:70-77, 2001 250 male
R/qtl workshop (part 2) Karl Broman Biostatistics and Medical Informatics University of Wisconsin Madison kbroman.org github.com/kbroman @kwbroman Example Sugiyama et al. Genomics 71:70-77, 2001 250 male
Dropping Your Genes. A Simulation of Meiosis and Fertilization and An Introduction to Probability
 Dropping Your Genes A Simulation of Meiosis and Fertilization and An Introduction to To fully understand Mendelian genetics (and, eventually, population genetics), you need to understand certain aspects
Laboratory III Quantitative Genetics
 Laboratory III Quantitative Genetics Genetics Biology 303 Spring 2007 Dr. Wadsworth Introduction Mendel's experimental approach depended on the fact that he chose phenotypes that varied in simple and discrete
Introduction to QTL mapping in model organisms
 Human vs mouse Introduction to QTL mapping in model organisms Karl W Broman Department of Biostatistics Johns Hopkins University www.biostat.jhsph.edu/~kbroman [ Teaching Miscellaneous lectures] www.daviddeen.com
Introduction to QTL mapping in model organisms
 Introduction to QTL mapping in model organisms Karl W Broman Department of Biostatistics Johns Hopkins University kbroman@jhsph.edu www.biostat.jhsph.edu/ kbroman Outline Experiments and data Models ANOVA
Complexity and Approximation of the Minimum Recombination Haplotype Configuration Problem
 Complexity and Approximation of the Minimum Recombination Haplotype Configuration Problem Lan Liu 1, Xi Chen 3, Jing Xiao 3, and Tao Jiang 1,2 1 Department of Computer Science and Engineering, University
Imprints of natural selection along environmental. gradients in phenology-related genes of Quercus petraea
 Genetics: Early Online, published on August 9, 2013 as 10.1534/genetics.113.153783 Imprints of natural selection along environmental gradients in phenology-related genes of Quercus petraea Florian J. Alberto
allosteric cis-acting DNA element coding strand dominant constitutive mutation coordinate regulation of genes denatured
 A B C D E F G H I J K L M N O P Q R S T U V W X Y Z AA BB CC DD EE FF GG HH II JJ KK LL MM NN OO PP QQ RR SS TT UU VV allosteric cis-acting DNA element coding strand codominant constitutive mutation coordinate
Friday Harbor From Genetics to GWAS (Genome-wide Association Study) Sept David Fardo
 Sept David Fardo") Friday Harbor 2017 From Genetics to GWAS (Genome-wide Association Study) Sept 7 2017 David Fardo Purpose: prepare for tomorrow s tutorial Genetic Variants Quality Control Imputation Association Visualization
Friday Harbor 2017 From Genetics to GWAS (Genome-wide Association Study) Sept 7 2017 David Fardo Purpose: prepare for tomorrow s tutorial Genetic Variants Quality Control Imputation Association Visualization
Mapping multiple QTL in experimental crosses
 Human vs mouse Mapping multiple QTL in experimental crosses Karl W Broman Department of Biostatistics & Medical Informatics University of Wisconsin Madison www.biostat.wisc.edu/~kbroman www.daviddeen.com
Segregation distortion in F 2 and doubled haploid populations of temperate japonica rice
 c Indian Academy of Sciences RESEARCH NOTE Segregation distortion in F 2 and doubled haploid populations of temperate japonica rice MASUMI YAMAGISHI 1,2,6, YOSHINOBU TAKEUCHI 3,7, ISAO TANAKA 4, IZUMI
Affected Sibling Pairs. Biostatistics 666
 Affected Sibling airs Biostatistics 666 Today Discussion of linkage analysis using affected sibling pairs Our exploration will include several components we have seen before: A simple disease model IBD
Teacher: Cheely/ Harbuck Course: Biology Period(s): All Day Week of: 1/12/15 EOCEP Lesson Plan/5E s
: All Day Week of: 1/12/15 EOCEP Lesson Plan/5E s") EOCEP Lesson Plan/5E s Day of the Week Monday Curriculum 2005 SDE Support Doc Standard:: B-4: The student will demonstrate an understanding of the molecular basis of heredity. Indicator: B-4.5 Goals (Objectives
EOCEP Lesson Plan/5E s Day of the Week Monday Curriculum 2005 SDE Support Doc Standard:: B-4: The student will demonstrate an understanding of the molecular basis of heredity. Indicator: B-4.5 Goals (Objectives
Molecular markers in plant systematics and population biology
 Molecular markers in plant systematics and population biology 2. Overview of applications and questions Tomáš Fér tomas.fer@natur.cuni.cz Molecular markers overview 1. proteins isozymes 2. DNA markers
Mapping QTL to a phylogenetic tree
 Mapping QTL to a phylogenetic tree Karl W Broman Department of Biostatistics & Medical Informatics University of Wisconsin Madison www.biostat.wisc.edu/~kbroman Human vs mouse www.daviddeen.com 3 Intercross
Tutorial Session 2. MCMC for the analysis of genetic data on pedigrees:
 MCMC for the analysis of genetic data on pedigrees: Tutorial Session 2 Elizabeth Thompson University of Washington Genetic mapping and linkage lod scores Monte Carlo likelihood and likelihood ratio estimation
Quantitative characters II: heritability
 Quantitative characters II: heritability The variance of a trait (x) is the average squared deviation of x from its mean: V P = (1/n)Σ(x-m x ) 2 This total phenotypic variance can be partitioned into components:
Eiji Yamamoto 1,2, Hiroyoshi Iwata 3, Takanari Tanabata 4, Ritsuko Mizobuchi 1, Jun-ichi Yonemaru 1,ToshioYamamoto 1* and Masahiro Yano 5,6
 Yamamoto et al. BMC Genetics 2014, 15:50 METHODOLOGY ARTICLE Open Access Effect of advanced intercrossing on genome structure and on the power to detect linked quantitative trait loci in a multi-parent
Nature Biotechnology: doi: /nbt Supplementary Figure 1. Overexpression of YFP::GPR-1 in the germline.
 Supplementary Figure 1 Overexpression of YFP::GPR-1 in the germline. The pie-1 promoter and 3 utr were used to express yfp::gpr-1 in the germline. Expression levels from the yfp::gpr-1(cai 1.0)-expressing