Genotype Imputation. Biostatistics 666
|
|
|
- Abner Knight
- 6 years ago
- Views:
Transcription
1 Genotype Imputation Biostatistics 666
2 Previously Hidden Markov Models for Relative Pairs Linkage analysis using affected sibling pairs Estimation of pairwise relationships Identity-by-Descent Relatives share long stretches of chromosome Sharing at some markers can be used as surrogate for sharing at unobserved markers
3 Today Genotype Imputation / In Silico Genotyping Use genotypes at a few markers to infer genotypes at other unobserved markers Closely related individuals Long segments of identity by descent Distantly related individuals Shorter segments of identity by descent
4 Intuition ?? Given the above pedigree, what are the likely values of the genotype marked?/??
5 In Silico Genotyping For Family Samples Family members will share large segments of chromosomes If we genotype many related individuals, we will effectively be genotyping a few chromosomes many times In fact, we can: Genotype a few markers on all individuals Identify shared segments of haplotypes Genotype additional markers on a subset of individuals Fill in missing genotypes that fall in shared segments Even without information on shared segments, it may be possible to learn about genotypes of relative members
6 Genotype Inference Part 1 Observed Genotype Data A/A A/G A/A A/G A/T A/A A/T G/T G/G G/T G/G G/T G/T G/T A/G A/A G/G A/A T/G C/G G/G C/C G/G A/G A/T G/T A/A C/G A/G A/T G/T G/T G/A C/G A/G G/T C/G A/G G/G A/A G/G C/C A/A G/G C/C G/G G/G G/G G/G
7 Genotype Inference Part 2 Inferring Allele Sharing A A G A A A G A T A A A A T T T T T T G G G T G G G T G G T T G A G A A G G A A T T T T T T T G C G G G C C G G A G A G T A A T T T G T G T G T A A G A T T T T C G C G A G A G A A A A G G G G G T T T G G G G T T T T C G G G C C C C G G G G
8 Genotype Inference Part 3 Imputing Missing Genotypes A/A A/G A/A A/G A/T A/A A/T G/T G/G G/T G/G G/T G/T G/G A/G A/A G/G A/A T/G C/G G/G C/C G/G A/G A/T G/T A/A C/G A/G A/T G/T G/T G/A C/G A/G G/T C/G A/G A/A G/G A/A A/T G/T G/G A/G C/C A/A A/T G/T G/G A/G C/C G/G A/T A/A G/G G/G A/T A/A G/G
9 Genotype Imputation in Families Suppose a particular genotype g ij is missing Genotype for person i at marker j Consider full set of observed genotypes G Evaluate pedigree likelihood L for each combination of {G, g ij = x} Posterior probability that g ij = x is P g ij = x G = L(G, g ij = x) L(G) For pairs, same HMM as for linkage analysis or checking relatedness. Large pedigrees, Lander-Green (1987) or Elston-Stewart (1972) algorithm.
10 Standard Linear Model for Genetic Association Model association using a model such as: E y i = μ + β g g i + β c c i + y i is the phenotype for individual i g i is the genotype for individual i Simplest coding is to set g i = number of copies of the first allele c i is a covariate for individual i Covariates could be estimated ancestry, environmental factors β coefficients are estimated covariate, genotype effects Model is fitted in variance component framework
11 Model With Inferred Genotypes Replace genotype score g with its expected value: E y i = μ + β g g ҧ + β c c + Where ഥg i = 2P g i = 2 G + P(g i = 1 G) Association test can then be implemented in variance component framework, just as before Alternatives would be to (a) impute genotypes with large posterior probabilities; or (b) integrate joint distribution of unobserved genotypes in family
12 Example I 1/1 1/1 1/1 1/1 1/1 L(G) =.0061 L(G, g 22 = 1/1) = L(G, g 22 = 1/2) = L(G, g 22 = 2/2) = Assumptions: Two alleles per marker Equal allele frequencies Θ = 0 P(g 22 = 1/1 G) = 0.81 P(g 22 = 1/2 G) = 0.18 P(g 22 = 2/2 G) = 0.01 g ҧ = 1.80
13 Example II 1/1 1/1 1/1 2/2 2/2 L(G) = L(G, g 22 = 1/1) = L(G, g 22 = 1/2) = L(G, g 22 = 2/2) = Assumptions: Two alleles per marker Equal allele frequencies Θ = 0 P(g 22 = 1/1 G) = 0.25 P(g 22 = 1/2 G) = 0.50 P(g 22 = 2/2 G) = 0.25 g ҧ = 1.00
14 Example III 1/1 1/1 1/1 1/1 1/1 L(G) =.0054 L(G, g 22 = 1/1) = L(G, g 22 = 1/2) = L(G, g 22 = 2/2) = Assumptions: Two alleles per marker Equal allele frequencies Θ = 0.10 P(g 22 = 1/1 G) = 0.73 P(g 22 = 1/2 G) = 0.25 P(g 22 = 2/2 G) = 0.02 g ҧ = 1.70
15 Example IV 1/1 1/1 1/1 2/2 2/2 L(G) = L(G, g 22 = 1/1) = L(G, g 22 = 1/2) = L(G, g 22 = 2/2) = Assumptions: Two alleles per marker Equal allele frequencies Θ = 0.10 P(g 22 = 1/1 G) = P(g 22 = 1/2 G) = P(g 22 = 2/2 G) = g ҧ = 1.05
16 Power in Sibships of Size 6 Without Parental Genotype Data Analyze Observed Data Impute when Posterior >.99 Using Expected Genotype Score T is the number of genotyped offspring. QTL explains 5% of variance, polygenes explain 35%, 250 sibships, α =
17 Application: Gene Expression Data Cheung et al (2005) carried out a genome wide association with 27 expression levels as traits Measured in grandparents and parents of CEPH pedigrees and took advantage of HapMap I genotypes SNP consortium genotypes also available for ~6000 SNPs in the offspring of each CEPH family
18 Example: Gene Expression Data Panels show GWA scan with CTBP1 expression as outcome Gene is at start of chromosome 4 Using observed genotypes, most significant association maps in cis for 15/27 traits 12 of these reach p < 5 * 10-8 Using inferred genotypes, most significant association maps in cis for 19/27 traits 15 of these reach p < 5 * 10-8 Data from Cheung et al. (2005)
19 Point of Situation When analyzing family samples FOR INDIVIDUALS WITH KNOWN RELATIONSHIPS Impute genotypes in relatives Imputation works through long shared stretches of chromosome But the majority of GWAS that use unrelated individuals FOR INDIVIDUALS WITH UNKNOWN RELATIONSHIPS Impute observed genotypes in relatives Imputation works through short shared stretches of chromosome
20 In Silico Genotyping For Unrelated Individuals In families, long stretches of shared chromosome In unrelated individuals, shared stretches are much shorter The plan is still to identify stretches of shared chromosome between individuals we then infer intervening genotypes by contrasting samples typing at a few sites with those with denser genotypes
21 Observed Genotypes Observed Genotypes.... A A.... A G C.... A... Reference Haplotypes C G A G A T C T C C T T C T T C T G T G C C G A G A T C T C C C G A C C T C A T G G C C A A G C T C T T T T C T T C T G T G C C G A A G C T C T T T T C T T C T G T G C C G A G A C T C T C C G A C C T T A T G C T G G G A T C T C C C G A C C T C A T G G C G A G A T C T C C C G A C C T T G T G C C G A G A C T C T T T T C T T T T G T A C C G A G A C T C T C C G A C C T C G T G C C G A A G C T C T T T T C T T C T G T G C Study Sample HapMap
22 Identify Match Among Reference Observed Genotypes.... A A.... A G C.... A... Reference Haplotypes C G A G A T C T C C T T C T T C T G T G C C G A G A T C T C C C G A C C T C A T G G C C A A G C T C T T T T C T T C T G T G C C G A A G C T C T T T T C T T C T G T G C C G A G A C T C T C C G A C C T T A T G C T G G G A T C T C C C G A C C T C A T G G C G A G A T C T C C C G A C C T T G T G C C G A G A C T C T T T T C T T T T G T A C C G A G A C T C T C C G A C C T C G T G C C G A A G C T C T T T T C T T C T G T G C
23 Phase Chromosome, Impute Missing Genotypes Observed Genotypes c g a g A t c t c c c g A c c t c A t g g c g a a G c t c t t t t C t t t c A t g g Reference Haplotypes C G A G A T C T C C T T C T T C T G T G C C G A G A T C T C C C G A C C T C A T G G C C A A G C T C T T T T C T T C T G T G C C G A A G C T C T T T T C T T C T G T G C C G A G A C T C T C C G A C C T T A T G C T G G G A T C T C C C G A C C T C A T G G C G A G A T C T C C C G A C C T T G T G C C G A G A C T C T T T T C T T T T G T A C C G A G A C T C T C C G A C C T C G T G C C G A A G C T C T T T T C T T C T G T G C
24 Implementation Markov model is used to model each haplotype, conditional on all others At each position, we assume that the haplotype being modeled copies a template haplotype Each individual has two haplotypes, and therefore copies two template haplotypes
25 Markov Model X X X X M P X 1 S ) P X 2 S ) P X 3 S ) P X M S ) ( 1 ( 2 ( 3 ( M S 1 S S 2 3 SM P( S 1 ) P S 2 S ) P S 3 S ) P(...) ( 1 ( 2 The final ingredient connects template states along the chromosome
26 Possible States A state S selects pair of template haplotypes Consider S i as vector with two elements (S i,1, S i,2 ) With H possible haplotypes, H 2 possible states H(H+1)/2 of these are distinct A recombination rate parameter describes probability of switches between states P((S i,1 = a,s i,2 = b) (S i+1,1 = a,s i+1,2 = b)) (1-θ) 2 P((S i,1 = a,s i,2 = b) (S i+1,1 = a*,s i+1,2 = b)) (1-θ)θ/H P((S i,1 = a,s i,2 = b) (S i+1,1 = a*,s i+1,2 = b*)) (θ/h) 2
27 Emission Probabilities Each value of S implies expected pair of alleles Emission probabilities will be higher when observed genotype matches expected alleles Emission probabilities will be lower when alleles mismatch Let T(S) be a function that provides expected allele pairs for each state S
28 Emission Probabilities
29 Does This Really Work? Preliminary Results Used 11 tag SNPs to predict 84 SNPs in CFH Comparison of Test Statistics, Truth vs. Imputed Predicted genotypes differ from original ~1.8% of the time Reasonably similar results possible using various haplotyping methods Experimental Data Chi-Square Test Statistic for Disease-Marker Association Imputed Data
30 Does This Really Work? Used about ~300,000 SNPs from Illumina HumanHap300 to impute 2.1M HapMap SNPs in 2500 individuals from a study of type II diabetes Compared imputed genotypes with actual experimental genotypes in a candidate region on chromosome individuals, 521 markers not on Illumina chip Results of comparison Average r 2 with true genotypes 0.92 (median 0.97) 1.4% of imputed alleles mismatch original 2.8% of imputed genotypes mismatch Most errors concentrated on worst 3% of SNPs Scott et al, Science, 2007
31 Does this really, really work? 90 GAIN psoriasis study samples were re-genotyped for 906,600 SNPs using the Affymetrix 6.0 chip. Comparison of 15,844,334 genotypes for 218,039 SNPs that overlap between the Perlegen and Affymetrix chips resulted in discrepancy rate of 0.25% per genotype (0.12% per allele). Comparison of 57,747,244 imputed and experimentally derived genotypes for 661,881 non-perlegen SNPs present in the Affymetrix 6.0 array resulted in a discrepancy rate of 1.80% per genotype (0.91% per allele). Overall, the average r 2 between imputed genotypes and their experimental counterparts was This statistic exceeded 0.80 for >90% of SNPs. Nair et al, Nature Genetics, 2009
32 LDLR and LDL example Willer et al, Nature Genetics, 2008 Li et al, Annual Review of Genomics and Human Genetics, 2009
33 Impact of HapMap Imputation on Power Power Disease SNP MAF tagsnps Imputation 2.5% 24.4% 56.2% 5% 55.8% 73.8% 10% 77.4% 87.2% 20% 85.6% 92.0% 50% 93.0% 96.0% Power for Simulated Case Control Studies. Simulations Ensure Equal Power for Directly Genotyped SNPs. Simulated studies used a tag SNP panel that captures 80% of common variants with pairwise r 2 > 0.80.
34 Combined Lipid Scans SardiNIA (Schlessinger, Uda, et al.) ~4,300 individuals, cohort study FUSION (Mohlke, Boehnke, Collins, et al.) ~2,500 individuals, case-control study of type 2 diabetes DGI (Kathiresan, Altshuler, Orho-Mellander, et al.) ~3,000 individuals, case-control study of type 2 diabetes Individually, 1-3 hits/scan, mostly known loci Analysis: Impute genotypes so that all scans are analyzed at the same SNPs Carry out meta-analysis of results across scans Willer et al, Nature Genetics, 2008
35 Combined Lipid Scan Results 18 clear loci! Willer et al, Nature Genetics, 2008
36 New LDL Locus, Previously Associated with CAD
37 Comparison with Related Traits: Coronary Artery Disease and LDL-C Alleles Gene LDL-C p-value Frequency CAD cases Frequency CAD ctrls CAD p-value APOE/C1/C4 3.0x x ( ) APOE/C1/C4 1.2x ( ) SORT1 6.1x x ( ) LDLR 4.2x x ( ) APOB 5.6x ( ) APOB 8.3x ( ) APOB 3.1x ( ) PCSK9 3.5x ( ) NCAN/CILP2 2.7x ( ) B3GALT4 5.1x ( ) B4GALT4 1.0x ( ) Comparison to data from WTCCC (Nature, 2007) was made possible by imputation. OR
 dataset Tag SNP Portability 52 regions, each ~330 kb Human Genome Diversity Panel ~927 individuals, 52 populations 1864 SNPs Grid of 872")
38 Does This Work Across Populations? Conrad et al. (2006) dataset Tag SNP Portability 52 regions, each ~330 kb Human Genome Diversity Panel ~927 individuals, 52 populations 1864 SNPs Grid of 872 SNPs used as tags Predicted genotypes for the other 992 SNPs Compared predictions to actual genotypes
39 (Evaluation Using ~1 SNP per 10kb in 52 x 300kb regions For Imputation)
40 Summary Genotype imputation can be used to accurately estimate missing genotypes Genotype imputation is usually implemented through using a Hidden Markov Model Benefits of genotype imputation Increases power of genetic association studies Facilitates analyses that combine data across studies Facilitates interpretation of results
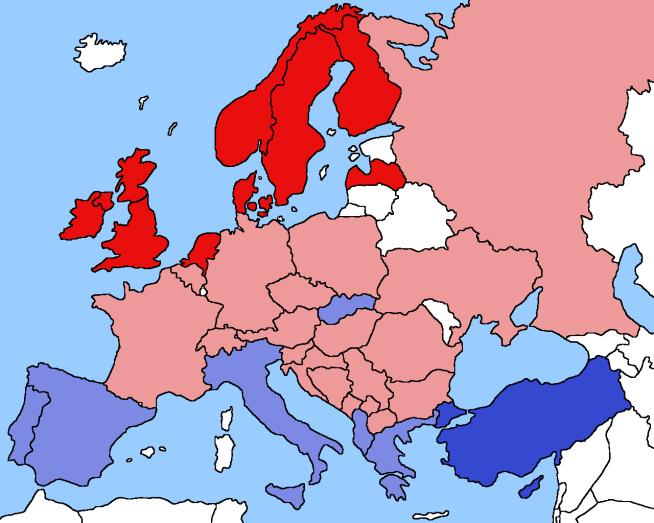
41 2017 Imputation Accuracy: Europeans (Complete Genomics as Truth)
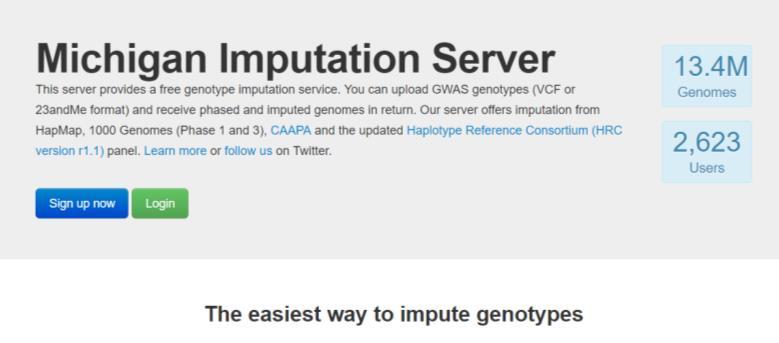
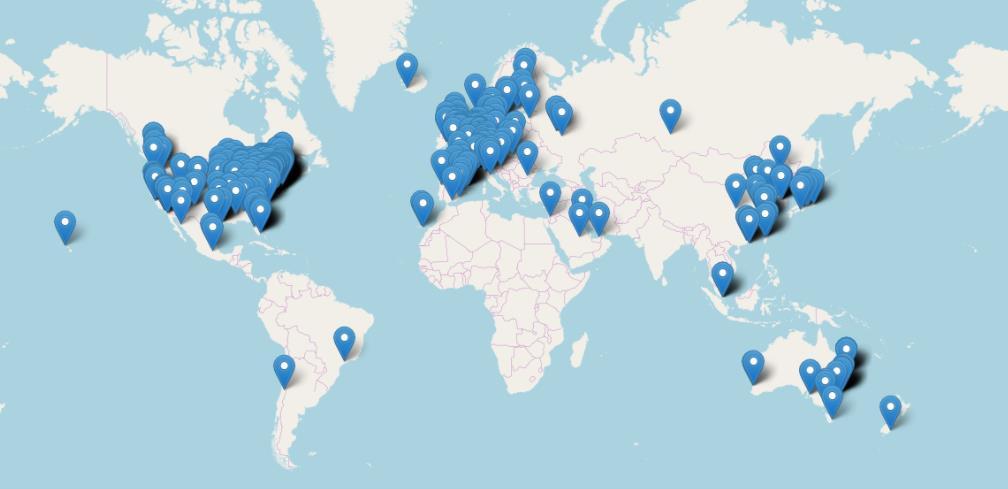
42 Imputation Servers
43 Recommended Reading Chen and Abecasis (2007) Family based association tests for genome wide association scans. Am J Hum Genet 81: Li et al (2010) Using sequence and genotype data to estimate haplotypes and unobserved genotypes. Genetic Epidemiology 34:
Genotype Imputation. Class Discussion for January 19, 2016
 Genotype Imputation Class Discussion for January 19, 2016 Intuition Patterns of genetic variation in one individual guide our interpretation of the genomes of other individuals Imputation uses previously
Calculation of IBD probabilities
 Calculation of IBD probabilities David Evans University of Bristol This Session Identity by Descent (IBD) vs Identity by state (IBS) Why is IBD important? Calculating IBD probabilities Lander-Green Algorithm
Calculation of IBD probabilities
 Calculation of IBD probabilities David Evans and Stacey Cherny University of Oxford Wellcome Trust Centre for Human Genetics This Session IBD vs IBS Why is IBD important? Calculating IBD probabilities
The Lander-Green Algorithm. Biostatistics 666 Lecture 22
 The Lander-Green Algorithm Biostatistics 666 Lecture Last Lecture Relationship Inferrence Likelihood of genotype data Adapt calculation to different relationships Siblings Half-Siblings Unrelated individuals
Variance Component Models for Quantitative Traits. Biostatistics 666
 Variance Component Models for Quantitative Traits Biostatistics 666 Today Analysis of quantitative traits Modeling covariance for pairs of individuals estimating heritability Extending the model beyond
Affected Sibling Pairs. Biostatistics 666
 Affected Sibling airs Biostatistics 666 Today Discussion of linkage analysis using affected sibling pairs Our exploration will include several components we have seen before: A simple disease model IBD
MODEL-FREE LINKAGE AND ASSOCIATION MAPPING OF COMPLEX TRAITS USING QUANTITATIVE ENDOPHENOTYPES
 MODEL-FREE LINKAGE AND ASSOCIATION MAPPING OF COMPLEX TRAITS USING QUANTITATIVE ENDOPHENOTYPES Saurabh Ghosh Human Genetics Unit Indian Statistical Institute, Kolkata Most common diseases are caused by
Lecture 9. QTL Mapping 2: Outbred Populations
 Lecture 9 QTL Mapping 2: Outbred Populations Bruce Walsh. Aug 2004. Royal Veterinary and Agricultural University, Denmark The major difference between QTL analysis using inbred-line crosses vs. outbred
Linear Regression (1/1/17)
") STA613/CBB540: Statistical methods in computational biology Linear Regression (1/1/17) Lecturer: Barbara Engelhardt Scribe: Ethan Hada 1. Linear regression 1.1. Linear regression basics. Linear regression
STA613/CBB540: Statistical methods in computational biology Linear Regression (1/1/17) Lecturer: Barbara Engelhardt Scribe: Ethan Hada 1. Linear regression 1.1. Linear regression basics. Linear regression
Probability of Detecting Disease-Associated SNPs in Case-Control Genome-Wide Association Studies
 Probability of Detecting Disease-Associated SNPs in Case-Control Genome-Wide Association Studies Ruth Pfeiffer, Ph.D. Mitchell Gail Biostatistics Branch Division of Cancer Epidemiology&Genetics National
(Genome-wide) association analysis
 association analysis") (Genome-wide) association analysis 1 Key concepts Mapping QTL by association relies on linkage disequilibrium in the population; LD can be caused by close linkage between a QTL and marker (= good) or by
(Genome-wide) association analysis 1 Key concepts Mapping QTL by association relies on linkage disequilibrium in the population; LD can be caused by close linkage between a QTL and marker (= good) or by
Proportional Variance Explained by QLT and Statistical Power. Proportional Variance Explained by QTL and Statistical Power
 Proportional Variance Explained by QTL and Statistical Power Partitioning the Genetic Variance We previously focused on obtaining variance components of a quantitative trait to determine the proportion
Association Testing with Quantitative Traits: Common and Rare Variants. Summer Institute in Statistical Genetics 2014 Module 10 Lecture 5
 Association Testing with Quantitative Traits: Common and Rare Variants Timothy Thornton and Katie Kerr Summer Institute in Statistical Genetics 2014 Module 10 Lecture 5 1 / 41 Introduction to Quantitative
1 Springer. Nan M. Laird Christoph Lange. The Fundamentals of Modern Statistical Genetics
 1 Springer Nan M. Laird Christoph Lange The Fundamentals of Modern Statistical Genetics 1 Introduction to Statistical Genetics and Background in Molecular Genetics 0 0 1 0 0 0 0 0 0 0 0 0 0 0 0 0 0 0 0
Gene mapping in model organisms
 Gene mapping in model organisms Karl W Broman Department of Biostatistics Johns Hopkins University http://www.biostat.jhsph.edu/~kbroman Goal Identify genes that contribute to common human diseases. 2
Department of Forensic Psychiatry, School of Medicine & Forensics, Xi'an Jiaotong University, Xi'an, China;
 Title: Evaluation of genetic susceptibility of common variants in CACNA1D with schizophrenia in Han Chinese Author names and affiliations: Fanglin Guan a,e, Lu Li b, Chuchu Qiao b, Gang Chen b, Tinglin
Statistical Methods in Mapping Complex Diseases
 University of Pennsylvania ScholarlyCommons Publicly Accessible Penn Dissertations Summer 8-12-2011 Statistical Methods in Mapping Complex Diseases Jing He University of Pennsylvania, jinghe@mail.med.upenn.edu
Association studies and regression
 Association studies and regression CM226: Machine Learning for Bioinformatics. Fall 2016 Sriram Sankararaman Acknowledgments: Fei Sha, Ameet Talwalkar Association studies and regression 1 / 104 Administration
Lecture 2: Genetic Association Testing with Quantitative Traits. Summer Institute in Statistical Genetics 2017
 Lecture 2: Genetic Association Testing with Quantitative Traits Instructors: Timothy Thornton and Michael Wu Summer Institute in Statistical Genetics 2017 1 / 29 Introduction to Quantitative Trait Mapping
Effect of Genetic Divergence in Identifying Ancestral Origin using HAPAA
 Effect of Genetic Divergence in Identifying Ancestral Origin using HAPAA Andreas Sundquist*, Eugene Fratkin*, Chuong B. Do, Serafim Batzoglou Department of Computer Science, Stanford University, Stanford,
Introduction to Linkage Disequilibrium
 Introduction to September 10, 2014 Suppose we have two genes on a single chromosome gene A and gene B such that each gene has only two alleles Aalleles : A 1 and A 2 Balleles : B 1 and B 2 Suppose we have
p(d g A,g B )p(g B ), g B
p(g B ), g B") Supplementary Note Marginal effects for two-locus models Here we derive the marginal effect size of the three models given in Figure 1 of the main text. For each model we assume the two loci (A and B)
Supplementary Note Marginal effects for two-locus models Here we derive the marginal effect size of the three models given in Figure 1 of the main text. For each model we assume the two loci (A and B)
1. Understand the methods for analyzing population structure in genomes
 MSCBIO 2070/02-710: Computational Genomics, Spring 2016 HW3: Population Genetics Due: 24:00 EST, April 4, 2016 by autolab Your goals in this assignment are to 1. Understand the methods for analyzing population
USING LINEAR PREDICTORS TO IMPUTE ALLELE FREQUENCIES FROM SUMMARY OR POOLED GENOTYPE DATA. By Xiaoquan Wen and Matthew Stephens University of Chicago
 Submitted to the Annals of Applied Statistics USING LINEAR PREDICTORS TO IMPUTE ALLELE FREQUENCIES FROM SUMMARY OR POOLED GENOTYPE DATA By Xiaoquan Wen and Matthew Stephens University of Chicago Recently-developed
Tutorial Session 2. MCMC for the analysis of genetic data on pedigrees:
 MCMC for the analysis of genetic data on pedigrees: Tutorial Session 2 Elizabeth Thompson University of Washington Genetic mapping and linkage lod scores Monte Carlo likelihood and likelihood ratio estimation
CSci 8980: Advanced Topics in Graphical Models Analysis of Genetic Variation
 CSci 8980: Advanced Topics in Graphical Models Analysis of Genetic Variation Instructor: Arindam Banerjee November 26, 2007 Genetic Polymorphism Single nucleotide polymorphism (SNP) Genetic Polymorphism
Nature Genetics: doi: /ng Supplementary Figure 1. Imputation server overview.
 Supplementary Figure 1 Imputation server overview. The imputation workflow uses two MapReduce jobs to parallelize the quality control and the phasing/imputation step. Supplementary Figure 2 Quality control
Expression QTLs and Mapping of Complex Trait Loci. Paul Schliekelman Statistics Department University of Georgia
 Expression QTLs and Mapping of Complex Trait Loci Paul Schliekelman Statistics Department University of Georgia Definitions: Genes, Loci and Alleles A gene codes for a protein. Proteins due everything.
Common Variants near MBNL1 and NKX2-5 are Associated with Infantile Hypertrophic Pyloric Stenosis
 Supplementary Information: Common Variants near MBNL1 and NKX2-5 are Associated with Infantile Hypertrophic Pyloric Stenosis Bjarke Feenstra 1*, Frank Geller 1*, Camilla Krogh 1, Mads V. Hollegaard 2,
Modeling IBD for Pairs of Relatives. Biostatistics 666 Lecture 17
 Modeling IBD for Pairs of Relatives Biostatistics 666 Lecture 7 Previously Linkage Analysis of Relative Pairs IBS Methods Compare observed and expected sharing IBD Methods Account for frequency of shared
MCMC IN THE ANALYSIS OF GENETIC DATA ON PEDIGREES
 MCMC IN THE ANALYSIS OF GENETIC DATA ON PEDIGREES Elizabeth A. Thompson Department of Statistics, University of Washington Box 354322, Seattle, WA 98195-4322, USA Email: thompson@stat.washington.edu This
Statistical issues in QTL mapping in mice
 Statistical issues in QTL mapping in mice Karl W Broman Department of Biostatistics Johns Hopkins University http://www.biostat.jhsph.edu/~kbroman Outline Overview of QTL mapping The X chromosome Mapping
SNP Association Studies with Case-Parent Trios
 SNP Association Studies with Case-Parent Trios Department of Biostatistics Johns Hopkins Bloomberg School of Public Health September 3, 2009 Population-based Association Studies Balding (2006). Nature
Use of hidden Markov models for QTL mapping
 Use of hidden Markov models for QTL mapping Karl W Broman Department of Biostatistics, Johns Hopkins University December 5, 2006 An important aspect of the QTL mapping problem is the treatment of missing
Theoretical and computational aspects of association tests: application in case-control genome-wide association studies.
 Theoretical and computational aspects of association tests: application in case-control genome-wide association studies Mathieu Emily November 18, 2014 Caen mathieu.emily@agrocampus-ouest.fr - Agrocampus
Lecture WS Evolutionary Genetics Part I 1
 Quantitative genetics Quantitative genetics is the study of the inheritance of quantitative/continuous phenotypic traits, like human height and body size, grain colour in winter wheat or beak depth in
2. Map genetic distance between markers
 Chapter 5. Linkage Analysis Linkage is an important tool for the mapping of genetic loci and a method for mapping disease loci. With the availability of numerous DNA markers throughout the human genome,
Lecture 13: Population Structure. October 8, 2012
 Lecture 13: Population Structure October 8, 2012 Last Time Effective population size calculations Historical importance of drift: shifting balance or noise? Population structure Today Course feedback The
Multiple QTL mapping
 Multiple QTL mapping Karl W Broman Department of Biostatistics Johns Hopkins University www.biostat.jhsph.edu/~kbroman [ Teaching Miscellaneous lectures] 1 Why? Reduce residual variation = increased power
Nature Genetics: doi: /ng Supplementary Figure 1. Number of cases and proxy cases required to detect association at designs.
 Supplementary Figure 1 Number of cases and proxy cases required to detect association at designs. = 5 10 8 for case control and proxy case control The ratio of controls to cases (or proxy cases) is 1.
Inferring Genetic Architecture of Complex Biological Processes
 Inferring Genetic Architecture of Complex Biological Processes BioPharmaceutical Technology Center Institute (BTCI) Brian S. Yandell University of Wisconsin-Madison http://www.stat.wisc.edu/~yandell/statgen
Test for interactions between a genetic marker set and environment in generalized linear models Supplementary Materials
 Biostatistics (2013), pp. 1 31 doi:10.1093/biostatistics/kxt006 Test for interactions between a genetic marker set and environment in generalized linear models Supplementary Materials XINYI LIN, SEUNGGUEN
Supplementary Materials: Meta-analysis of Quantitative Pleiotropic Traits at Gene Level with Multivariate Functional Linear Models
 Supplementary Materials: Meta-analysis of Quantitative Pleiotropic Traits at Gene Level with Multivariate Functional Linear Models Appendix A. Type I Error and Power Simulations and Results A.. Type I
The E-M Algorithm in Genetics. Biostatistics 666 Lecture 8
 The E-M Algorithm in Genetics Biostatistics 666 Lecture 8 Maximum Likelihood Estimation of Allele Frequencies Find parameter estimates which make observed data most likely General approach, as long as
Bayesian Inference of Interactions and Associations
 Bayesian Inference of Interactions and Associations Jun Liu Department of Statistics Harvard University http://www.fas.harvard.edu/~junliu Based on collaborations with Yu Zhang, Jing Zhang, Yuan Yuan,
Supplementary Information for: Detection and interpretation of shared genetic influences on 42 human traits
 Supplementary Information for: Detection and interpretation of shared genetic influences on 42 human traits Joseph K. Pickrell 1,2,, Tomaz Berisa 1, Jimmy Z. Liu 1, Laure Segurel 3, Joyce Y. Tung 4, David
New imputation strategies optimized for crop plants: FILLIN (Fast, Inbred Line Library ImputatioN) FSFHap (Full Sib Family Haplotype)
 FSFHap (Full Sib Family Haplotype)") New imputation strategies optimized for crop plants: FILLIN (Fast, Inbred Line Library ImputatioN) FSFHap (Full Sib Family Haplotype) Kelly Swarts PAG Allele Mining 1/11/2014 Imputation is the projection
New imputation strategies optimized for crop plants: FILLIN (Fast, Inbred Line Library ImputatioN) FSFHap (Full Sib Family Haplotype) Kelly Swarts PAG Allele Mining 1/11/2014 Imputation is the projection
Supplementary Materials for Molecular QTL Discovery Incorporating Genomic Annotations using Bayesian False Discovery Rate Control
 Supplementary Materials for Molecular QTL Discovery Incorporating Genomic Annotations using Bayesian False Discovery Rate Control Xiaoquan Wen Department of Biostatistics, University of Michigan A Model
Learning ancestral genetic processes using nonparametric Bayesian models
 Learning ancestral genetic processes using nonparametric Bayesian models Kyung-Ah Sohn October 31, 2011 Committee Members: Eric P. Xing, Chair Zoubin Ghahramani Russell Schwartz Kathryn Roeder Matthew
The genomes of recombinant inbred lines
 The genomes of recombinant inbred lines Karl W Broman Department of Biostatistics Johns Hopkins University http://www.biostat.jhsph.edu/~kbroman C57BL/6 2 1 Recombinant inbred lines (by sibling mating)
Statistical Analysis of Haplotypes, Untyped SNPs, and CNVs in Genome-Wide Association Studies
 Statistical Analysis of Haplotypes, Untyped SNPs, and CNVs in Genome-Wide Association Studies by Yijuan Hu A dissertation submitted to the faculty of the University of North Carolina at Chapel Hill in
Quantitative Genomics and Genetics BTRY 4830/6830; PBSB
 Quantitative Genomics and Genetics BTRY 4830/6830; PBSB.5201.01 Lecture 20: Epistasis and Alternative Tests in GWAS Jason Mezey jgm45@cornell.edu April 16, 2016 (Th) 8:40-9:55 None Announcements Summary
Analyzing metabolomics data for association with genotypes using two-component Gaussian mixture distributions
 Analyzing metabolomics data for association with genotypes using two-component Gaussian mixture distributions Jason Westra Department of Statistics, Iowa State University Ames, IA 50011, United States
NIH Public Access Author Manuscript Stat Sin. Author manuscript; available in PMC 2013 August 15.
 NIH Public Access Author Manuscript Published in final edited form as: Stat Sin. 2012 ; 22: 1041 1074. ON MODEL SELECTION STRATEGIES TO IDENTIFY GENES UNDERLYING BINARY TRAITS USING GENOME-WIDE ASSOCIATION
Introduction to QTL mapping in model organisms
 Introduction to QTL mapping in model organisms Karl Broman Biostatistics and Medical Informatics University of Wisconsin Madison kbroman.org github.com/kbroman @kwbroman Backcross P 1 P 2 P 1 F 1 BC 4
HERITABILITY ESTIMATION USING A REGULARIZED REGRESSION APPROACH (HERRA)
") BIRS 016 1 HERITABILITY ESTIMATION USING A REGULARIZED REGRESSION APPROACH (HERRA) Malka Gorfine, Tel Aviv University, Israel Joint work with Li Hsu, FHCRC, Seattle, USA BIRS 016 The concept of heritability
BIRS 016 1 HERITABILITY ESTIMATION USING A REGULARIZED REGRESSION APPROACH (HERRA) Malka Gorfine, Tel Aviv University, Israel Joint work with Li Hsu, FHCRC, Seattle, USA BIRS 016 The concept of heritability
Improved linear mixed models for genome-wide association studies
 Nature Methods Improved linear mixed models for genome-wide association studies Jennifer Listgarten, Christoph Lippert, Carl M Kadie, Robert I Davidson, Eleazar Eskin & David Heckerman Supplementary File
I Have the Power in QTL linkage: single and multilocus analysis
 I Have the Power in QTL linkage: single and multilocus analysis Benjamin Neale 1, Sir Shaun Purcell 2 & Pak Sham 13 1 SGDP, IoP, London, UK 2 Harvard School of Public Health, Cambridge, MA, USA 3 Department
UNIT 8 BIOLOGY: Meiosis and Heredity Page 148
 UNIT 8 BIOLOGY: Meiosis and Heredity Page 148 CP: CHAPTER 6, Sections 1-6; CHAPTER 7, Sections 1-4; HN: CHAPTER 11, Section 1-5 Standard B-4: The student will demonstrate an understanding of the molecular
Lecture 11: Multiple trait models for QTL analysis
 Lecture 11: Multiple trait models for QTL analysis Julius van der Werf Multiple trait mapping of QTL...99 Increased power of QTL detection...99 Testing for linked QTL vs pleiotropic QTL...100 Multiple
BTRY 7210: Topics in Quantitative Genomics and Genetics
 BTRY 7210: Topics in Quantitative Genomics and Genetics Jason Mezey Biological Statistics and Computational Biology (BSCB) Department of Genetic Medicine jgm45@cornell.edu February 12, 2015 Lecture 3:
Introduction to QTL mapping in model organisms
 Introduction to QTL mapping in model organisms Karl W Broman Department of Biostatistics Johns Hopkins University kbroman@jhsph.edu www.biostat.jhsph.edu/ kbroman Outline Experiments and data Models ANOVA
Analytic power calculation for QTL linkage analysis of small pedigrees
 (2001) 9, 335 ± 340 ã 2001 Nature Publishing Group All rights reserved 1018-4813/01 $15.00 www.nature.com/ejhg ARTICLE for QTL linkage analysis of small pedigrees FruÈhling V Rijsdijk*,1, John K Hewitt
Prediction of the Confidence Interval of Quantitative Trait Loci Location
 Behavior Genetics, Vol. 34, No. 4, July 2004 ( 2004) Prediction of the Confidence Interval of Quantitative Trait Loci Location Peter M. Visscher 1,3 and Mike E. Goddard 2 Received 4 Sept. 2003 Final 28
Haplotyping. Biostatistics 666
 Haplotyping Biostatistics 666 Previously Introduction to te E-M algoritm Approac for likeliood optimization Examples related to gene counting Allele frequency estimation recessive disorder Allele frequency
Introduction to QTL mapping in model organisms
 Introduction to QTL mapping in model organisms Karl W Broman Department of Biostatistics and Medical Informatics University of Wisconsin Madison www.biostat.wisc.edu/~kbroman [ Teaching Miscellaneous lectures]
A mixed model based QTL / AM analysis of interactions (G by G, G by E, G by treatment) for plant breeding
 for plant breeding") Professur Pflanzenzüchtung Professur Pflanzenzüchtung A mixed model based QTL / AM analysis of interactions (G by G, G by E, G by treatment) for plant breeding Jens Léon 4. November 2014, Oulu Workshop
Professur Pflanzenzüchtung Professur Pflanzenzüchtung A mixed model based QTL / AM analysis of interactions (G by G, G by E, G by treatment) for plant breeding Jens Léon 4. November 2014, Oulu Workshop
Evolution of phenotypic traits
 Quantitative genetics Evolution of phenotypic traits Very few phenotypic traits are controlled by one locus, as in our previous discussion of genetics and evolution Quantitative genetics considers characters
Linkage analysis and QTL mapping in autotetraploid species. Christine Hackett Biomathematics and Statistics Scotland Dundee DD2 5DA
 Linkage analysis and QTL mapping in autotetraploid species Christine Hackett Biomathematics and Statistics Scotland Dundee DD2 5DA Collaborators John Bradshaw Zewei Luo Iain Milne Jim McNicol Data and
Friday Harbor From Genetics to GWAS (Genome-wide Association Study) Sept David Fardo
 Sept David Fardo") Friday Harbor 2017 From Genetics to GWAS (Genome-wide Association Study) Sept 7 2017 David Fardo Purpose: prepare for tomorrow s tutorial Genetic Variants Quality Control Imputation Association Visualization
Friday Harbor 2017 From Genetics to GWAS (Genome-wide Association Study) Sept 7 2017 David Fardo Purpose: prepare for tomorrow s tutorial Genetic Variants Quality Control Imputation Association Visualization
Genetic Association Studies in the Presence of Population Structure and Admixture
 Genetic Association Studies in the Presence of Population Structure and Admixture Purushottam W. Laud and Nicholas M. Pajewski Division of Biostatistics Department of Population Health Medical College
Quantitative Genomics and Genetics BTRY 4830/6830; PBSB
 Quantitative Genomics and Genetics BTRY 4830/6830; PBSB.5201.01 Lecture16: Population structure and logistic regression I Jason Mezey jgm45@cornell.edu April 11, 2017 (T) 8:40-9:55 Announcements I April
The Admixture Model in Linkage Analysis
 The Admixture Model in Linkage Analysis Jie Peng D. Siegmund Department of Statistics, Stanford University, Stanford, CA 94305 SUMMARY We study an appropriate version of the score statistic to test the
Methods for Cryptic Structure. Methods for Cryptic Structure
 Case-Control Association Testing Review Consider testing for association between a disease and a genetic marker Idea is to look for an association by comparing allele/genotype frequencies between the cases
Pedigree and genomic evaluation of pigs using a terminal cross model
 66 th EAAP Annual Meeting Warsaw, Poland Pedigree and genomic evaluation of pigs using a terminal cross model Tusell, L., Gilbert, H., Riquet, J., Mercat, M.J., Legarra, A., Larzul, C. Project funded by:
Learning Your Identity and Disease from Research Papers: Information Leaks in Genome-Wide Association Study
 Learning Your Identity and Disease from Research Papers: Information Leaks in Genome-Wide Association Study Rui Wang, Yong Li, XiaoFeng Wang, Haixu Tang and Xiaoyong Zhou Indiana University at Bloomington
Binomial Mixture Model-based Association Tests under Genetic Heterogeneity
 Binomial Mixture Model-based Association Tests under Genetic Heterogeneity Hui Zhou, Wei Pan Division of Biostatistics, School of Public Health, University of Minnesota, Minneapolis, MN 55455 April 30,
Backward Genotype-Trait Association. in Case-Control Designs
 Backward Genotype-Trait Association (BGTA)-Based Dissection of Complex Traits in Case-Control Designs Tian Zheng, Hui Wang and Shaw-Hwa Lo Department of Statistics, Columbia University, New York, New York,
DNA polymorphisms such as SNP and familial effects (additive genetic, common environment) to
 to") 1 1 1 1 1 1 1 1 0 SUPPLEMENTARY MATERIALS, B. BIVARIATE PEDIGREE-BASED ASSOCIATION ANALYSIS Introduction We propose here a statistical method of bivariate genetic analysis, designed to evaluate contribution
1 1 1 1 1 1 1 1 0 SUPPLEMENTARY MATERIALS, B. BIVARIATE PEDIGREE-BASED ASSOCIATION ANALYSIS Introduction We propose here a statistical method of bivariate genetic analysis, designed to evaluate contribution
Computational Approaches to Statistical Genetics
 Computational Approaches to Statistical Genetics GWAS I: Concepts and Probability Theory Christoph Lippert Dr. Oliver Stegle Prof. Dr. Karsten Borgwardt Max-Planck-Institutes Tübingen, Germany Tübingen
Efficient Bayesian mixed model analysis increases association power in large cohorts
 Linear regression Existing mixed model methods New method: BOLT-LMM Time O(MM) O(MN 2 ) O MN 1.5 Corrects for confounding? Power Efficient Bayesian mixed model analysis increases association power in large
TOPICS IN STATISTICAL METHODS FOR HUMAN GENE MAPPING
 TOPICS IN STATISTICAL METHODS FOR HUMAN GENE MAPPING by Chia-Ling Kuo MS, Biostatstics, National Taiwan University, Taipei, Taiwan, 003 BBA, Statistics, National Chengchi University, Taipei, Taiwan, 001
The universal validity of the possible triangle constraint for Affected-Sib-Pairs
 The Canadian Journal of Statistics Vol. 31, No.?, 2003, Pages???-??? La revue canadienne de statistique The universal validity of the possible triangle constraint for Affected-Sib-Pairs Zeny Z. Feng, Jiahua
Lecture 6. QTL Mapping
 Lecture 6 QTL Mapping Bruce Walsh. Aug 2003. Nordic Summer Course MAPPING USING INBRED LINE CROSSES We start by considering crosses between inbred lines. The analysis of such crosses illustrates many of
SNP-SNP Interactions in Case-Parent Trios
 Detection of SNP-SNP Interactions in Case-Parent Trios Department of Biostatistics Johns Hopkins Bloomberg School of Public Health June 2, 2009 Karyotypes http://ghr.nlm.nih.gov/ Single Nucleotide Polymphisms
Theoretical Population Biology
 Theoretical Population Biology 87 (013) 6 74 Contents lists available at SciVerse ScienceDirect Theoretical Population Biology journal homepage: www.elsevier.com/locate/tpb Genotype imputation in a coalescent
Accounting for read depth in the analysis of genotyping-by-sequencing data
 Accounting for read depth in the analysis of genotyping-by-sequencing data Ken Dodds, John McEwan, Timothy Bilton, Rudi Brauning, Rayna Anderson, Tracey Van Stijn, Theodor Kristjánsson, Shannon Clarke
Mapping QTL to a phylogenetic tree
 Mapping QTL to a phylogenetic tree Karl W Broman Department of Biostatistics & Medical Informatics University of Wisconsin Madison www.biostat.wisc.edu/~kbroman Human vs mouse www.daviddeen.com 3 Intercross
Lecture 28: BLUP and Genomic Selection. Bruce Walsh lecture notes Synbreed course version 11 July 2013
 Lecture 28: BLUP and Genomic Selection Bruce Walsh lecture notes Synbreed course version 11 July 2013 1 BLUP Selection The idea behind BLUP selection is very straightforward: An appropriate mixed-model
AFFECTED RELATIVE PAIR LINKAGE STATISTICS THAT MODEL RELATIONSHIP UNCERTAINTY
 AFFECTED RELATIVE PAIR LINKAGE STATISTICS THAT MODEL RELATIONSHIP UNCERTAINTY by Amrita Ray BSc, Presidency College, Calcutta, India, 2001 MStat, Indian Statistical Institute, Calcutta, India, 2003 Submitted
An Integrated Approach for the Assessment of Chromosomal Abnormalities
 An Integrated Approach for the Assessment of Chromosomal Abnormalities Department of Biostatistics Johns Hopkins Bloomberg School of Public Health June 26, 2007 Karyotypes Karyotypes General Cytogenetics
ACGTTTGACTGAGGAGTTTACGGGAGCAAAGCGGCGTCATTGCTATTCGTATCTGTTTAG Human Population Genomics
 ACGTTTGACTGAGGAGTTTACGGGAGCAAAGCGGCGTCATTGCTATTCGTATCTGTTTAG 010101100010010100001010101010011011100110001100101000100101 Human Population Genomics Heritability & Environment Feasibility of identifying
Quantitative Genetics & Evolutionary Genetics
 Quantitative Genetics & Evolutionary Genetics (CHAPTER 24 & 26- Brooker Text) May 14, 2007 BIO 184 Dr. Tom Peavy Quantitative genetics (the study of traits that can be described numerically) is important
For 5% confidence χ 2 with 1 degree of freedom should exceed 3.841, so there is clear evidence for disequilibrium between S and M.
 STAT 550 Howework 6 Anton Amirov 1. This question relates to the same study you saw in Homework-4, by Dr. Arno Motulsky and coworkers, and published in Thompson et al. (1988; Am.J.Hum.Genet, 42, 113-124).
Linkage and Linkage Disequilibrium
 Linkage and Linkage Disequilibrium Summer Institute in Statistical Genetics 2014 Module 10 Topic 3 Linkage in a simple genetic cross Linkage In the early 1900 s Bateson and Punnet conducted genetic studies
Lecture 1: Case-Control Association Testing. Summer Institute in Statistical Genetics 2015
 Timothy Thornton and Michael Wu Summer Institute in Statistical Genetics 2015 1 / 1 Introduction Association mapping is now routinely being used to identify loci that are involved with complex traits.
Gene mapping, linkage analysis and computational challenges. Konstantin Strauch
 Gene mapping, linkage analysis an computational challenges Konstantin Strauch Institute for Meical Biometry, Informatics, an Epiemiology (IMBIE) University of Bonn E-mail: strauch@uni-bonn.e Genetics an
Inference on pedigree structure from genome screen data. Running title: Inference on pedigree structure. Mary Sara McPeek. The University of Chicago
 1 Inference on pedigree structure from genome screen data Running title: Inference on pedigree structure Mary Sara McPeek The University of Chicago Address for correspondence: Department of Statistics,
NIH Public Access Author Manuscript Genet Epidemiol. Author manuscript; available in PMC 2014 December 01.
 NIH Public Access Author Manuscript Published in final edited form as: Genet Epidemiol. 2013 December ; 37(8): 759 767. doi:10.1002/gepi.21759. A General Framework for Association Tests With Multivariate
Lecture 12 April 25, 2018
 Stats 300C: Theory of Statistics Spring 2018 Lecture 12 April 25, 2018 Prof. Emmanuel Candes Scribe: Emmanuel Candes, Chenyang Zhong 1 Outline Agenda: The Knockoffs Framework 1. The Knockoffs Framework