Nature Genetics: doi: /ng Supplementary Figure 1. Number of cases and proxy cases required to detect association at designs.
|
|
|
- Roderick Hines
- 5 years ago
- Views:
Transcription
1 Supplementary Figure 1 Number of cases and proxy cases required to detect association at designs. = for case control and proxy case control The ratio of controls to cases (or proxy cases) is 1. We set the disease prevalence (K) to 0.1 and varied the true odds ratio (OR) from 1.1 to 1.5. Each panel shows the equivalent number of cases and proxy cases required across different minor allele frequencies (MAFs). Across values of K (data only shown for K = 0.1), MAF and OR, the ratio of true cases to proxy cases was ~4 when proxy cases and controls are perfectly classified (red line). When 10% of controls consist of misclassified proxy cases, the ratio increases to ~4.9 (blue line).
2 Supplementary Figure 2 Relationship between adjusted ORs and directly observed ORs across the allele frequency spectrum. The x axis denotes OR estimated directly from case control association testing when cases consist entirely of individuals with one parent (or one full sibling) affected with a disease. The y axis denotes the adjusted OR such that it is comparable to OR estimated directly using true cases and controls.
3
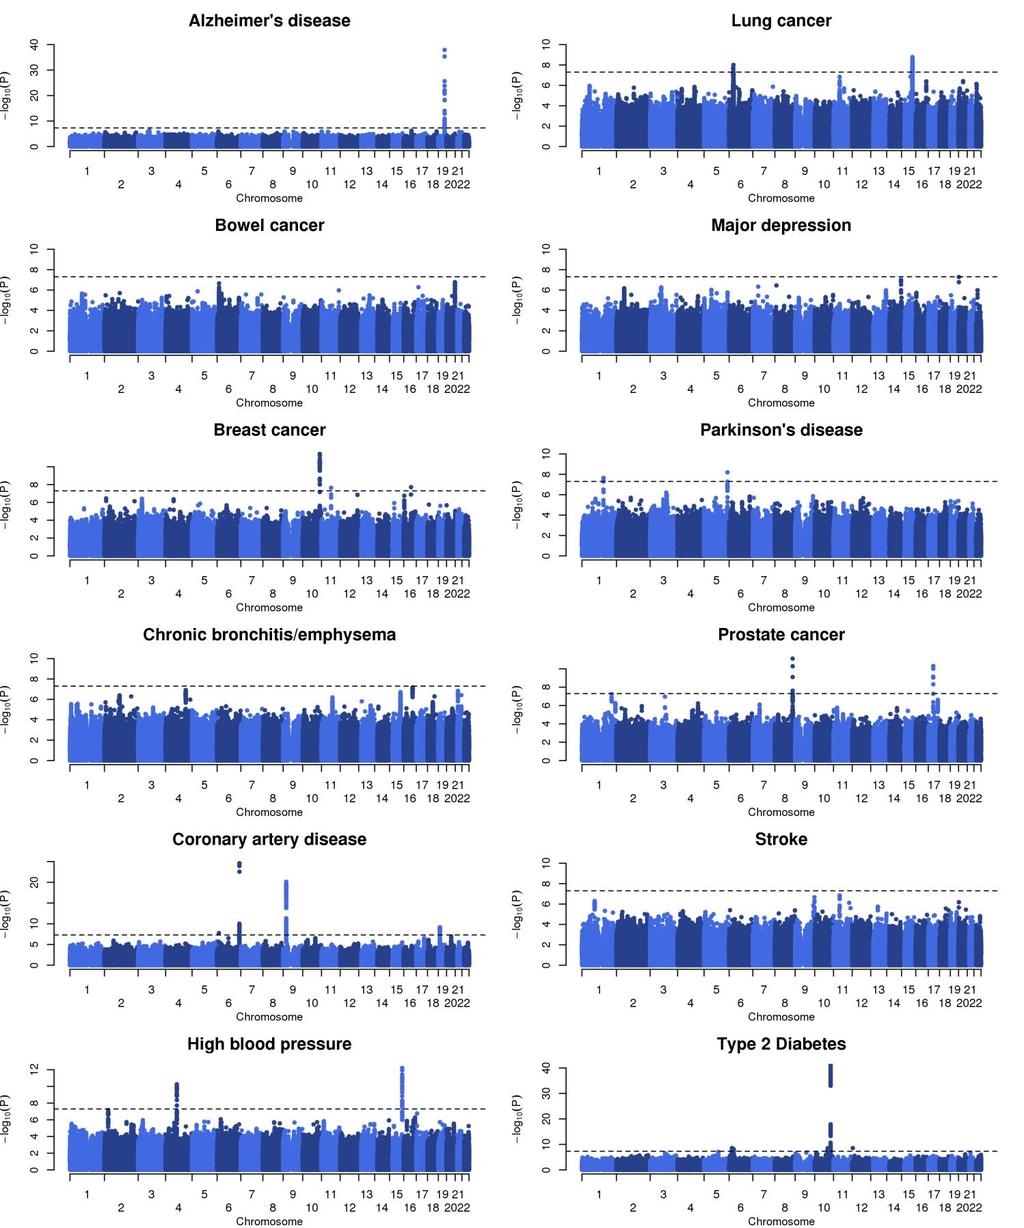
4 Supplementary Figure 3 Manhattan plots of primary proxy case control association analysis results for 12 phenotypes. Chromosome and positions are plotted on the x axis. Strength of association is plotted on the y axis. The red line corresponds to the genome-wide significant threshold of P < log 10 (P values) are truncated at 40 for illustrative purposes.
5 Supplementary Figure 4 Mean polygenic risk scores among UK Biobank individuals for Alzheimer's disease, coronary artery disease and type 2 diabetes. Risk scores were calculated using lists of established risk loci and reported effect sizes extracted from publicly available published GWAS summary statistics. Error bars denote the 95% confidence intervals of the mean normalized polygenic risk scores. Differences between each pair of risk scores were tested using Welch s t test. No significant difference between any of the unaffected individuals with two affected parents and 2 unaffected individuals with one affected parent were identified (P > 0.09).
6 Supplementary Figure 5 Regional association plots of four novel Alzheimer s disease risk loci. The coordinates on the x axis are GRCh37. SNPs are plotted according to their base-pair position and strength of association. The color of each point indicates the degree of linkage disequilibrium with the index SNP (in blue).
7
8 Supplementary Figure 6 Regional association plots of eight novel coronary artery disease risk loci. SNPs are plotted according to their base-pair position and strength of association. The color of each point indicates the degree of linkage disequilibrium with the index SNP (in blue).
9 Supplementary Figure 7 Regional association plots of five novel type 2 diabetes risk loci. SNPs are plotted according to their base-pair position and strength of association. The color of each point indicates the degree of linkage disequilibrium with the index SNP (in blue).
10
11 Supplementary Figure 8 Quantile quantile plot and genomic inflation of primary proxy case control association analysis results for 12 phenotypes. The dashed red line corresponds to y = x.
12 Supplementary Figure 9 Quantile quantile plot, genomic inflation and LD score regression intercepts of fixed-effects meta-analysis results for four phenotypes. The dashed red line corresponds to y = x.
13 Supplementary information for: Case-control association mapping by proxy using family history of disease Jimmy Z Liu 1,, Yaniv Erlich 1,2, Joseph K Pickrell 1,3 1 New York Genome Center, New York, NY, USA 2 Department of Computer Science, Columbia University, New York, NY, USA 3 Department of Biological Sciences, Columbia University, New York, NY, USA Correspondence to: jliu@nygenome.org December 6, 2016
14 Contents 1 Supplementary Tables 2 2 Supplementary Note Power calculations and simulations Power of an association test using proxy-cases Power of an association test when true cases and proxy-cases are considered jointly Discussion A novel Parkinson s disease association at SLIT3(?)
15 1 Supplementary Tables 1 Sample sizes per phenotype List of genome-wide significant loci from primary proxy-case/control analysis Percentage of female proxy-cases List of genome-wide significant loci from fixed-effects meta-analysis analysis ICD-10 codes used in assigning case/control status
16 Phenotype Affected F Affected M Affected S Affected F and M Affected F and S Affected M and S Affected F, M and S Unknown proxycases total Alzheimer s disease 4,484 8, ,632 14, ,082 Bowel cancer 5,509 5,080 1, ,626 13, ,448 Breast cancer - 8,339 3, ,665 12, ,179 Chronic bronchitis/emphysema 10,561 5,436 1, ,473 19,649 95,074 Heart disease 22,970 11,923 3,624 6,532 2,731 1,838 1,582 1,164 51,200 63,832 High blood pressure 10,936 18,543 7,921 5,883 3,010 5,431 2,990 1,248 54,714 60,234 Lung cancer 8,814 3,976 1, ,572 15,438 99,186 Major depressive disorder 2,805 5,519 4, , ,656 15,107 99,433 Parkinson s disease 2,431 1, ,743 4, ,826 Prostate cancer 7,452-1, ,711 8, ,498 Stroke 13,093 12,737 1,981 2, ,412 31,153 83,631 Type 2 diabetes 7,595 7,681 5, ,041 1, ,460 23,945 90,791 proxycontrols total Supplementary Table 1. Sample sizes per phenotype. Proxy-cases are broken down into combinations of affected father (F), mother (M) and sibling (S). 3
17 Supplementary Table 2. List of genome-wide significant loci from primary proxy-case/control analysis (see attached spreadsheet). A variant was considered genome-wide significant if P < in the proxycase control association analysis. HWE: Hardy-Weinberg equilibrium P-value, Missingness: proportion of samples with missing genotypes, Batch missing P: P-value from chi-square test for differential missingness by batch, Batch freq: P-value from chi-square test for differences in allele frequencies between genotyping batches, INFO: Imputation INFO quality metric, P-value (LMM): Association P-value from mixed-model analysis. Phenotype Female proxy-cases (52.9% overall) P-value Alzheimer s disease 55.59% Bowel cancer 52.64% 0.51 Breast cancer 56.56% Chronic bronchitis/emphysema 58.68% Heart disease 56.39% High blood pressure 58.08% Lung cancer 54.88% Major depressive disorder 61.84% Parkinson s disease 55.27% Prostate cancer 54.08% Stroke 55.88% Type 2 diabetes 55.96% Supplementary Table 3. Percentage of females who make up all proxy-cases. P-value estimated from a 2 2 chi-squared test of proxy-case and control counts for males and females. Supplementary Table 4. List of genome-wide significant loci from fixed-effects meta-analysis analysis (see attached spreadsheet) for Alzheimer s disease, coronary artery disease and type 2 diabetes. A variant was considered genome-wide significant if P < in the combined UK-Biobank and previous GWAS meta-analysis. 4
18 Phenotype ICD-10 Codes Alzheimer s disease G300, G301, G309, F000, F001, F009 Bowel cancer C180, C181, C182, C183, C184, C185, C186, C187, C188, C189, C19, C20, C210, C211, C218 Breast cancer C050, C500, C501, C502, C503, C504, C505, C506, C508, C509 Chronic bronchitis/emphysema J40, J411, J430, J431, J438, J439, J440, J441, J448, J449, J47 Coronary artery disease I200, I201, I208, I209, I210, I211, I212, I213, I214, I219, I220, I221, I228, I229, I231, I236, I238, I240, I241, I248, I249, I250, I251, I252, I253, I254, I255, I256, I258, I259 High blood pressure I10, I110, I119, I120, I129, I130, I131, I132, I139, I150, I151, I152, I159 Lung cancer C33, C340, C341, C342, C343, C348, C349 Major depressive disorder F320, F321, F322, F323, F328, F329, F330, F331, F332, F333, F334, F338, F339 Parkinson s disease G20 Prostate cancer C61 Stroke I610, I611, I612, I613, I614, I615, I618, I619, I620, I621, I629, I630, I631, I632, I633, I634, I635, I636, I638, I639, I64 Type 2 diabetes E11, E110, E111, E112, E113, E114, E115, E116, E117, E118, E119 Supplementary Table 5. ICD-10 codes used in assigning case/control status. 5
19 2 Supplementary Note 2.1 Power calculations and simulations Power of an association test using proxy-cases Suppose a researcher has a fixed budget and is interested in whether to collect proxy-cases or true cases. If proxy-cases are easier to collect than true cases (for instance, if the disease is lethal), then how many proxy-cases will need to be collected instead of cases for power to detect association to be equivalent? Method Consider a study of N A cases and N U controls, and N = N A +N U is the total sample size. For each SNP, let f A be the allele frequency of allele A1 in cases and f U be the allele frequency of A1 in controls. For all our simulations (except where noted otherwise), we assume perfect knowledge about individual phenotypes and family history. Controls do not include individuals with any affected relatives. This can be displayed in a 2 2 contingency table of expected allele counts under Hardy-Weinberg equilibrium: Cases Controls A1 2 f A N A 2 f U N U A2 2(1 f A )N A 2(1 f U )N U A test for association between genotype and disease status is then performed by calculating the Pearson χ 2 test statistic: χ 2 = i=a1,a2 j=a,u (n i j E[n i j ]) 2 E[n i j ] (1) where n i j is the allele count of the cell for allele i and case/control status j and E[n i j ] = n i.n. j n.. is the expected cell count given the number of cases, controls and the allele frequency across all samples. Under the null hypothesis, χ 2 has a chi-squared (1-degree of freedom (df)) distribution. For a given odds ratio (OR) and allele frequency in controls ( f U ), we can calculate the expected allele frequency in cases: f A = f U OR f U OR+1 f U as well as the expected allele frequency in proxy-cases: f P = f A+ f U 2. We assume for now that all cases, proxy-cases and controls are perfectly classified, and that controls do not include unaffected individuals with an affected first-degree relative. We consider the situation when some proxy-cases are misclassified as controls later on. The power of the chi-squared test is dependent upon the noncentrality parameter (NCP), λ. Under the alternative hypothesis, χ 2 has a χ1 2 (λ) (noncentral chi-squared) distribution. The power of the test at significance level α is P(χ 2 1 (λ) χ2 1;α ). The NCP equals the test statistic minus the degrees of freedom, and is a function of the allele frequency and sample size [Evans and Purcell, 2012]. For a chi-squared (1-df) test using allele counts in true cases and controls, the NCP can be derived as: 6
20 2N A N U ( f A f U ) 2 (N U + N A ) λ C = (N A N A f A + N U N U f U )( f A N A + f U N U ) = 2N A r( f A f U ) 2 (1 + r) ( f A + r f U )(1 + r f A r f U ) (2) (3) and similarly for a chi-squared (1-df) test using proxy-cases and controls: λ P = = 2N P N U ( f P f U ) 2 (N U + N P ) (N P N P f P + N U N U f U )( f P N P + f U N U ) 2N P r( f P f U ) 2 (1 + r) ( f P + r f U )(1 + r f P r f U ) (4) (5) where N P is the number of proxy-cases and r is the ratio of controls to cases (or controls to proxy-cases). Given values N A, r, f U and OR, we wish to calculate N P when λ C = λ P. That is, given a fixed number of true cases and controls, what is the number proxy-cases and controls required to have equivalent power to detect association as true cases? We can solve λ C = λ P numerically by iterating through values of N P in equations (2) and (4). Alternatively, if it can be assumed that r is constant, the relationship between N A and N P when λ C = λ P can be derived as following: 2N A r( f A f U ) 2 (1 + r) ( f A + r f U )(1 + r f A r f U ) = 2N P r( f P f U ) 2 (1 + r) ( f P + r f U )(1 + r f P r f U ) (6) substituting f P = f A+ f U 2 and solving for N P : N P = N A( fa f A(2r f U + f U r 1) + f U (2r + 1)(2r f U + f U 2(r + 1))) fa 2 + f A((2 f U 1)r 1) + r f U (( f U 1)r 1) = N A(2r( f U 1) + f U + f A 2)( f U (2r + 1) + f A ) (r( f U 1) + f A 1)(r f U + f A ) (7) (8) and differentiating with respect to N A : N P = (2r( f U 1) + f U + f A 2)( f A + f U (2r + 1)) N A ( f A + r( f U 1) 1)( f A + r f U ) = ( f U 2)( f A f U ) f A + r f U ( f U + 1)( f A f U ) f A + r( f U 1) (10) Our analysis so far assume that cases, proxy-cases and controls are perfectly classified. In situations where a certain number of proxy-cases are misclassified as controls, we would expect a decline in effect size (and hence power to detect association) for a given sample size when compared with a perfectly classified proxy-case control design. We can model this by replacing f U in equations (4) and (5) with f U = m f P + (9) 7
21 (1 m) f U, where m is the proportion of controls that are actually proxy-cases. Results We estimated N P for different values of N A across different effect sizes and allele frequencies. When r is constant between cases and controls, there is a linear relationship between the number of true cases and number of proxy-cases to achieve the same power to detect association (Supplementary Note Figure 1). In general, a study with proxy-cases will need four times as many samples as true cases to achieve equivalent power to detect association - in equation (10), N P N A 4 across the effect size and allele frequency spectrum. For example, a study of 1,000 true cases and 1,000 controls will have roughly have same power to detect association as one with 4,000 proxy-cases and 4,000 controls. The above assumes that r remains constant between the case/control and its equivalent proxy-case/control study. In a situation where the number of controls is fixed and a researcher needs to decide whether to collect true cases or proxy-cases, r will decrease as the number of true cases increases. In practice, this means that the ratio of proxy-cases to true cases when power is equivalent will increase as the number of true cases increases (Supplementary Note Figure 1). For instance, with the number of controls fixed at 100,000, a study of 1,000 true cases is equivalent to one with 4,125 proxy-cases; while one with 5,000 true cases is equivalent to 23,700 proxy-cases. 8
22 Frequency in controls = 0.01 Frequency in controls = 0.05 Frequency in controls = 0.1 Number of proxy cases OR Number of proxy cases OR Number of proxy cases OR Number of true cases Number of true cases Number of true cases Frequency in controls = 0.2 Frequency in controls = 0.3 Frequency in controls = 0.5 Number of proxy cases OR Number of proxy cases OR Number of proxy cases OR Number of true cases Number of true cases Number of true cases Supplementary Note Figure 1. Number of proxy-cases and true cases when power to detect association is equivalent. Red lines indicate a study design where the ratio of cases to controls r is constant between true case and proxy-case study. Black lines indicates a study design where number of controls is fixed at 100,000. 9
23 2.1.2 Power of an association test when true cases and proxy-cases are considered jointly We consider a cohort study where both true cases and proxy-cases are available for analysis, and compare power to detect association under three different association models: 1) a 2 2 chi-square (1-df) test using true cases and controls, 2) a 2 2 chi-square (1-df) test when cases and proxy-cases are lumped together vs. controls, and 3) a 3 2 chi-square (2-df) test where cases, proxy-cases and controls considered separately. The expected number of true cases and proxy-cases in a randomly sampled cohort is based on the disease prevalence and heritability of disease liability. Method Let there be a cohort composed of N individuals. For a typical case/control association study, the cohort is split into approximately N A = N K cases and N U = N (1 K) controls where K is the disease prevalence. For each SNP, the allele counts can be denoted as before: Cases Controls A1 2 f A N A 2 f U N U A2 2(1 f A )N A 2(1 f U )N U where f A is the frequency of A1 in cases and f U is the frequency of A1 in controls. The odds ratio is: OR = f A(1 f U ) f U (1 f A ) (11) with NCP: λ C = 2N A N U ( f A f U ) 2 (N U + N A ) (N A N A f A + N U N U f U )( f A N A + f U N U ) (12) We wish to calculate the NCP when cases are composed of both true cases and proxy-cases. To do this, we need to know how the allele counts are expected to vary when a proportion of controls are reassigned to be proxy-cases. The number of expected proxy-cases in a randomly sampled cohort can be estimated using the liability threshold model of disease. The liability distribution of individuals with an affected first-degree relative is: ( h 2 L 1 N L i 2,1 h4 L i(i T ) ) 4 (13) where h 2 L is the narrow-sense heritability of liability, T is the truncation point of a standard normal distribution at disease prevalence K, z is the height of the standard normal distribution at T and i = z/k [Falconer and Mackay, 1996]. The probability that an affected individual s first degree relative is also affected is then K 1 = 1 Φ(T 1 ) where Φ(.) is the standard normal cumulative distribution function and T 1 = T h 2 L i/2 1 h 4L i(i T )/4 (14) 10
24 In a cohort study, the total number of individuals with at least one affected parent is approximately (1 (1 K) 2 ) N. Of these, K 1 N A individuals are also affected themselves. Subtracting one from the other, the total number of proxy-cases (unaffected individuals with an affected parent) is: N P = (1 (1 K) 2 ) N (1 (1 K 1 ) 2 ) N A (15) Let f P = f A+ fu 2 be the allele frequency of A1 in proxy-cases, where fu is the allele frequency of A1 in controls that do not include proxy-cases ( true controls ). In an association study where cases are composed of both truly affected individuals and proxy-cases, the allele count of A1 in cases increases by 2 f P N P while the number in controls decreases by the same amount. Hence, we can estimate the allele frequency in true controls: f U = f UN U f P N P N U N P (16) Substituting f P = f A+ f U 2 : f U = 2 f UN U f A N P 2N U N P (17) Similarly, the allele frequency in cases that now include proxy-cases: Hence the allele counts are now: f A = f AN A + f P N P N A + N P (18) Cases Controls A1 2 f A (N A + N P ) 2 f U (N U N P ) A2 2(1 f A )(N A + N P ) 2(1 f U )(N U N P ) and NCP: λ = 2(N A + N P )( f A f U )2 (N U + N A ) (N A f A (N A + N P ) + N U f U (N U N P ))( f A (N A + N P ) + f U (N U N P )) (19) The power of the chi-square (1-df) test at significance level α using just true cases is P(χ1 2(λ C) χ1;α 2 ) and when using both true cases and proxy-cases is P(χ1 2(λ ) χ1;α 2 ). We next consider power calculations for a test where cases, proxy-cases and controls are considered separately. The allele counts are now: Cases proxy-cases Controls A1 2 f A N A 2 f P N P 2 fu (N U N P ) A2 2(1 f A )N A 2(1 f P )N P 2(1 fu )(N U N P ) with NCP for a 3 2 chi-square (2-df) test: 11
25 λ = 2(N A + N U ) 6 i=1 (p 1i p 0i ) 2 p 0i (20) where p 0i and p 1i are the proportions in cell i under the null and alterate hypotheses respectively Cohen [1977]. The power at significance level α of the chi-square (2-df) test is then given by P(χ2 2(λ ) χ2;α 2 ). Results We estimated the power to detect association at α = in a cohort of 100,000 individuals across different values of K, h 2, f U, and OR using three models: 1) true cases vs. controls (1-df test), 2) true cases + proxy-cases vs. controls (1-df test) and 3) true cases vs. proxy-cases vs. controls (2-df test) (Supplementary Note Figure 2). In all situations, accounting for proxy-cases using the 2-df test improved power to detect association. For diseases with prevalence less than 10%, the 2-df test was marginally more powerful that the 1-df test of lumping true and proxy-cases together. For instance, for a disease with 5% prevalence and 50% heritability, we expect to observe 5,000 cases and 8,597 proxy-cases in a randomly sampled cohort of 100,000 individuals. Here, for a SNP with allele frequency 0.1 in controls, an OR of 1.2 and α = , there is 60.2% power to detect association using a 2 2 test of true cases vs. controls, 83.7% using a 2 2 test of true cases + proxy-cases vs. controls and 87.7% using a 3 2 test of true cases vs. proxy-cases vs. controls. The 1-df test of lumping cases and proxy-cases becomes less powerful than a standard case/control test when disease prevalence becomes higher than This is because as K increases, so does the number of proxy-cases, such that reassigning them from controls to cases leads to a much smaller proportional increase (and sometimes a decrease) in the total effective sample size than if prevalence was lower (while at the same time losing power due to the decrease in the effect size). For instance, when K = 0.34 and h 2 = 0.5, we expect 34,000 cases and 33,033 proxy-cases in a cohort of 100,000. The effective sample size (N e f f = 4 1 N A + 1 N U ) of a standard case/control design is 89,760, while lumping cases with proxy-cases gives an effective sample size of 88,395. In contrast, using the same parameters except K = 0.05, lumping proxy-cases with cases increases the effective sample size 19,000 to 46,993. The overall gain in effective sample size from the 2-df design is shown in Supplementary Note Figure 3. The improvement in effective sample size for the 2-df test when compared with the 1df case/control test is greatest when disease prevalence is low. For instance, when K = 0.005, the 2-df design represents a 1.36 increase in sample size compared with the 1-df case/control design. This ratio decreases to 1.2 when K = Discussion We compared power to detect association with proxy-cases under two broad scenarios. In the first, a choice needs to be made whether to collect only cases or only proxy-cases, and the second, where both true and proxy-cases are collected. The first situation may prove useful if the collection of true cases is somehow prohibitive compared to proxy-cases - for instance, the disease may be very rare, lethal or very late onset. 12
26 K = 0.01, h2 = 0.2, fu = 0.1, N = 1e+05 K = 0.01, h2 = 0.5, fu = 0.1, N = 1e+05 K = 0.01, h2 = 0.8, fu = 0.1, N = 1e+05 Power at alpha = 5e df (cases vs pscases vs controls) 1df (cases+pscases vs controls) 1df (cases vs controls+pscases) n_cases = 1000 n_pscases = 1952 n_controls = Power at alpha = 5e df (cases vs pscases vs controls) 1df (cases+pscases vs controls) 1df (cases vs controls+pscases) n_cases = 1000 n_pscases = 1904 n_controls = Power at alpha = 5e df (cases vs pscases vs controls) 1df (cases+pscases vs controls) 1df (cases vs controls+pscases) n_cases = 1000 n_pscases = 1824 n_controls = OR (true case vs. controls) OR (true case vs. controls) OR (true case vs. controls) K = 0.1, h2 = 0.2, fu = 0.1, N = 1e+05 K = 0.1, h2 = 0.5, fu = 0.1, N = 1e+05 K = 0.1, h2 = 0.8, fu = 0.1, N = 1e+05 Power at alpha = 5e n_cases = n_pscases = n_controls = Power at alpha = 5e n_cases = n_pscases = n_controls = Power at alpha = 5e n_cases = n_pscases = n_controls = OR (true case vs. controls) OR (true case vs. controls) OR (true case vs. controls) K = 0.34, h2 = 0.2, fu = 0.1, N = 1e+05 K = 0.34, h2 = 0.5, fu = 0.1, N = 1e+05 K = 0.34, h2 = 0.8, fu = 0.1, N = 1e+05 Power at alpha = 5e n_cases = n_pscases = n_controls = Power at alpha = 5e n_cases = n_pscases = n_controls = Power at alpha = 5e n_cases = n_pscases = n_controls = OR (true case vs. controls) OR (true case vs. controls) OR (true case vs. controls) K = 0.5, h2 = 0.2, fu = 0.1, N = 1e+05 K = 0.5, h2 = 0.5, fu = 0.1, N = 1e+05 K = 0.5, h2 = 0.8, fu = 0.1, N = 1e+05 Power at alpha = 5e n_cases = n_pscases = n_controls = Power at alpha = 5e n_cases = n_pscases = n_controls = Power at alpha = 5e n_cases = n_pscases = n_controls = OR (true case vs. controls) OR (true case vs. controls) OR (true case vs. controls) Supplementary Note Figure 2. Power to detect association at α = using three study designs. The power of the 2-df test comparing cases against proxycases and against controls is shown in blue, the 1-df test comparing cases and proxycases against controls is in red, and the 1-df test comparing cases against controls and proxycases is shown in black. We set the total sample size (N) to 100,000, the allele frequency in controls (fu) to 0.1, and then varied the disease prevalence (K), heritability of disease liability (h2) and odds ratio (OR). The expected number of cases and proxy-cases is shown in the bottom right corner of each panel. 13
27 A Cohort size (log 10 scale) df (cases, proxy cases) 1df (cases, proxy cases) 1df (cases only) Disease prevalence B Cohort size ratio df (cases, proxy cases) / 2df (cases, proxy cases) 1df (cases only) / 2df (cases, proxy cases) Disease prevalence Supplementary Note Figure 3. Equivalent sample sizes of case/proxy-case/control designs in a population cohort. Disease prevalence is shown in the x-axis. (A) The y-axis shows the total cohort sizes of the 2-df, 1-df (cases, proxy-cases) and 1-df (cases only) study designs required for 80% power to detect association at α = for a SNP with odds ratio = 1.2, allele frequency = 0.4 and heritability = 0.5. (B) The y-axis shows the relative size of the 1-df (cases, proxy-cases) and 1-df (cases only) study designs compared with the 2-df design that is required to achieve the same power to detect association. These ratios remain constant across effect sizes and allele frequencies. 14
28 The second situation is perhaps more likely to be encountered in the context of large population cohort studies where phenotypes of genotyped individuals as well as their relatives are collected. Here, we show that it is always more powerful to explicitly account for proxy-cases using the 3 2 chi-squared test than performing a standard case/control test. The approach of lumping cases and proxy-cases together is marginally less powerful than the 3 2 test for diseases with prevalence < 10%, though this approach loses power compared to the others as prevalence increases. In practice, using the latter approach and performing association using logistic regression or mixed models so that covariates and population structure can be accounted for may prove to be effective for diseases with low to moderate prevalence. The expected number of proxy-cases in a population cohort is estimated assuming that the disease prevalence is the same between genotyped individuals and their first degree relatives. For late onset diseases where the prevalence is higher in the parents of genotyped individuals, accounting for proxy-cases will become even more attractive than just using cases. 2.2 A novel Parkinson s disease association at SLIT3(?) In the primary GWAX in the UK Biobank individuals, we identified a previously unreported Parkinson s disease risk locus near the SLIT3 gene (rs , P = , Supplementary Note Figure 4). Given the sample size of 4051 proxy-cases and 110,402 controls (effectively equivalent to a case/control study with N = 4440) is an order of magnitude smaller than in Nalls et al. [2014] (13,708 cases and 95,282 controls), we would not have expected to identify any genome-wide significant locus that had not already been identified this earlier study. Indeed, all other 23 genome-wide significant loci were at established risk loci for their respective diseases. The lead SNP at this locus, rs , is also listed with association P > 0.05 in Nalls et al. [2014] at pdgene.org. The lead SNP does not appear to have any obvious QC issues, with Hardy-Weinberg P = 0.79, missingness = 0.018, genotyping batch effects on missingness P = 0.87, and batch effects on allele frequency P = Imputation quality is also high, with IMPUTE2 INFO = The strongest association signal at a directly genotyped SNP, rs , is P = In EUR individuals from 1000 Genomes Project Phase 3, LD between rs and rs is r 2 = The strength of association in the region appears consistent with LD patterns (Supplementary Note Figure 4). We were also unable to rule out population stratification driving the association at this locus. The signal persisted when the first 20PCs were used as covariates in the logistic regression (P = ). We also performed association testing using a linear mixed model implemented in BOLT-LMM [Loh et al., 2015], where genetic relatedness between the UK Biobank was estimated using 623,852 directly genotyped SNPs. Using this method, which tries to account for cryptic population stratification, rs remained genome-wide significant (Supplementary Table 2, P = ). While we urge caution in interpreting this signal as a bona fide Parkinson s disease risk locus, there is no obvious evidence from our data to suggest that it is a false positive. We hope that future large genetic 15
29 rs log 10 (p) cm/mb LD(r 2 ) ( )SLIT Chromosome 5 position Supplementary Note Figure 4. Regional association plot of the novel Parkinson s disease association at SLIT3. The coordinates on the x-axis are GRCh37. SNPs are plotted according to their base-pair position and strength of association. The color of each point indicates the degree of linkage disequilibrium with rs (in blue). Circle points represent imputed SNPs; triangle points represent directly genotyped SNPs. 16
30 studies of Parkinson s disease, especially those that can compare UK vs other populations, will shed further light on this locus. References Cohen, J., Chapter 7 - Chi-Square Tests for Goodness of Fit and Contingency Tables. In Cohen, J., editor, Statistical Power Analysis for the Behavioral Sciences (Revised Edition), pages Academic Press, revised edition. Evans, D. M. and Purcell, S., Power Calculations in Genetic Studies. Cold Spring Harbor Protocols, 2012(6):pdb.top Falconer, D. and Mackay, T., Chapter 18 - Threshold Characters. In Introduction to Quantitative Genetics, pages Benjamin Cummings, fourth edition. Loh, P.-R., Tucker, G., Bulik-Sullivan, B. K., Vilhjalmsson, B. J., Finucane, H. K., Salem, R. M., Chasman, D. I., Ridker, P. M., Neale, B. M., Berger, B., et al., Efficient Bayesian mixed-model analysis increases association power in large cohorts. Nat Genet, 47(3): Nalls, M. A., Pankratz, N., Lill, C. M., Do, C. B., Hernandez, D. G., Saad, M., DeStefano, A. L., Kara, E., Bras, J., Sharma, M., et al., Large-scale meta-analysis of genome-wide association data identifies six new risk loci for Parkinson s disease. Nature Genetics, 46(9):
(Genome-wide) association analysis
 association analysis") (Genome-wide) association analysis 1 Key concepts Mapping QTL by association relies on linkage disequilibrium in the population; LD can be caused by close linkage between a QTL and marker (= good) or by
(Genome-wide) association analysis 1 Key concepts Mapping QTL by association relies on linkage disequilibrium in the population; LD can be caused by close linkage between a QTL and marker (= good) or by
Lecture 2: Genetic Association Testing with Quantitative Traits. Summer Institute in Statistical Genetics 2017
 Lecture 2: Genetic Association Testing with Quantitative Traits Instructors: Timothy Thornton and Michael Wu Summer Institute in Statistical Genetics 2017 1 / 29 Introduction to Quantitative Trait Mapping
Association Testing with Quantitative Traits: Common and Rare Variants. Summer Institute in Statistical Genetics 2014 Module 10 Lecture 5
 Association Testing with Quantitative Traits: Common and Rare Variants Timothy Thornton and Katie Kerr Summer Institute in Statistical Genetics 2014 Module 10 Lecture 5 1 / 41 Introduction to Quantitative
1 Springer. Nan M. Laird Christoph Lange. The Fundamentals of Modern Statistical Genetics
 1 Springer Nan M. Laird Christoph Lange The Fundamentals of Modern Statistical Genetics 1 Introduction to Statistical Genetics and Background in Molecular Genetics 0 0 1 0 0 0 0 0 0 0 0 0 0 0 0 0 0 0 0
Proportional Variance Explained by QLT and Statistical Power. Proportional Variance Explained by QTL and Statistical Power
 Proportional Variance Explained by QTL and Statistical Power Partitioning the Genetic Variance We previously focused on obtaining variance components of a quantitative trait to determine the proportion
Case-Control Association Testing. Case-Control Association Testing
 Introduction Association mapping is now routinely being used to identify loci that are involved with complex traits. Technological advances have made it feasible to perform case-control association studies
Efficient Bayesian mixed model analysis increases association power in large cohorts
 Linear regression Existing mixed model methods New method: BOLT-LMM Time O(MM) O(MN 2 ) O MN 1.5 Corrects for confounding? Power Efficient Bayesian mixed model analysis increases association power in large
Lecture 1: Case-Control Association Testing. Summer Institute in Statistical Genetics 2015
 Timothy Thornton and Michael Wu Summer Institute in Statistical Genetics 2015 1 / 1 Introduction Association mapping is now routinely being used to identify loci that are involved with complex traits.
MODEL-FREE LINKAGE AND ASSOCIATION MAPPING OF COMPLEX TRAITS USING QUANTITATIVE ENDOPHENOTYPES
 MODEL-FREE LINKAGE AND ASSOCIATION MAPPING OF COMPLEX TRAITS USING QUANTITATIVE ENDOPHENOTYPES Saurabh Ghosh Human Genetics Unit Indian Statistical Institute, Kolkata Most common diseases are caused by
Supplementary Figures
 Supplementary Figures Supplementary Figure 1 Principal components analysis (PCA) of all samples analyzed in the discovery phase. Colors represent the phenotype of study populations. a) The first sample
Friday Harbor From Genetics to GWAS (Genome-wide Association Study) Sept David Fardo
 Sept David Fardo") Friday Harbor 2017 From Genetics to GWAS (Genome-wide Association Study) Sept 7 2017 David Fardo Purpose: prepare for tomorrow s tutorial Genetic Variants Quality Control Imputation Association Visualization
Friday Harbor 2017 From Genetics to GWAS (Genome-wide Association Study) Sept 7 2017 David Fardo Purpose: prepare for tomorrow s tutorial Genetic Variants Quality Control Imputation Association Visualization
1. Understand the methods for analyzing population structure in genomes
 MSCBIO 2070/02-710: Computational Genomics, Spring 2016 HW3: Population Genetics Due: 24:00 EST, April 4, 2016 by autolab Your goals in this assignment are to 1. Understand the methods for analyzing population
Binomial Mixture Model-based Association Tests under Genetic Heterogeneity
 Binomial Mixture Model-based Association Tests under Genetic Heterogeneity Hui Zhou, Wei Pan Division of Biostatistics, School of Public Health, University of Minnesota, Minneapolis, MN 55455 April 30,
HERITABILITY ESTIMATION USING A REGULARIZED REGRESSION APPROACH (HERRA)
") BIRS 016 1 HERITABILITY ESTIMATION USING A REGULARIZED REGRESSION APPROACH (HERRA) Malka Gorfine, Tel Aviv University, Israel Joint work with Li Hsu, FHCRC, Seattle, USA BIRS 016 The concept of heritability
BIRS 016 1 HERITABILITY ESTIMATION USING A REGULARIZED REGRESSION APPROACH (HERRA) Malka Gorfine, Tel Aviv University, Israel Joint work with Li Hsu, FHCRC, Seattle, USA BIRS 016 The concept of heritability
Linear Regression (1/1/17)
") STA613/CBB540: Statistical methods in computational biology Linear Regression (1/1/17) Lecturer: Barbara Engelhardt Scribe: Ethan Hada 1. Linear regression 1.1. Linear regression basics. Linear regression
STA613/CBB540: Statistical methods in computational biology Linear Regression (1/1/17) Lecturer: Barbara Engelhardt Scribe: Ethan Hada 1. Linear regression 1.1. Linear regression basics. Linear regression
Introduction to Linkage Disequilibrium
 Introduction to September 10, 2014 Suppose we have two genes on a single chromosome gene A and gene B such that each gene has only two alleles Aalleles : A 1 and A 2 Balleles : B 1 and B 2 Suppose we have
Common Variants near MBNL1 and NKX2-5 are Associated with Infantile Hypertrophic Pyloric Stenosis
 Supplementary Information: Common Variants near MBNL1 and NKX2-5 are Associated with Infantile Hypertrophic Pyloric Stenosis Bjarke Feenstra 1*, Frank Geller 1*, Camilla Krogh 1, Mads V. Hollegaard 2,
Theoretical and computational aspects of association tests: application in case-control genome-wide association studies.
 Theoretical and computational aspects of association tests: application in case-control genome-wide association studies Mathieu Emily November 18, 2014 Caen mathieu.emily@agrocampus-ouest.fr - Agrocampus
Genotype Imputation. Biostatistics 666
 Genotype Imputation Biostatistics 666 Previously Hidden Markov Models for Relative Pairs Linkage analysis using affected sibling pairs Estimation of pairwise relationships Identity-by-Descent Relatives
EXERCISES FOR CHAPTER 3. Exercise 3.2. Why is the random mating theorem so important?
 Statistical Genetics Agronomy 65 W. E. Nyquist March 004 EXERCISES FOR CHAPTER 3 Exercise 3.. a. Define random mating. b. Discuss what random mating as defined in (a) above means in a single infinite population
I Have the Power in QTL linkage: single and multilocus analysis
 I Have the Power in QTL linkage: single and multilocus analysis Benjamin Neale 1, Sir Shaun Purcell 2 & Pak Sham 13 1 SGDP, IoP, London, UK 2 Harvard School of Public Health, Cambridge, MA, USA 3 Department
Expression QTLs and Mapping of Complex Trait Loci. Paul Schliekelman Statistics Department University of Georgia
 Expression QTLs and Mapping of Complex Trait Loci Paul Schliekelman Statistics Department University of Georgia Definitions: Genes, Loci and Alleles A gene codes for a protein. Proteins due everything.
Population Genetics. with implications for Linkage Disequilibrium. Chiara Sabatti, Human Genetics 6357a Gonda
 1 Population Genetics with implications for Linkage Disequilibrium Chiara Sabatti, Human Genetics 6357a Gonda csabatti@mednet.ucla.edu 2 Hardy-Weinberg Hypotheses: infinite populations; no inbreeding;
The Quantitative TDT
 The Quantitative TDT (Quantitative Transmission Disequilibrium Test) Warren J. Ewens NUS, Singapore 10 June, 2009 The initial aim of the (QUALITATIVE) TDT was to test for linkage between a marker locus
A novel fuzzy set based multifactor dimensionality reduction method for detecting gene-gene interaction
 A novel fuzzy set based multifactor dimensionality reduction method for detecting gene-gene interaction Sangseob Leem, Hye-Young Jung, Sungyoung Lee and Taesung Park Bioinformatics and Biostatistics lab
STAT 536: Genetic Statistics
 STAT 536: Genetic Statistics Tests for Hardy Weinberg Equilibrium Karin S. Dorman Department of Statistics Iowa State University September 7, 2006 Statistical Hypothesis Testing Identify a hypothesis,
Bayesian Inference of Interactions and Associations
 Bayesian Inference of Interactions and Associations Jun Liu Department of Statistics Harvard University http://www.fas.harvard.edu/~junliu Based on collaborations with Yu Zhang, Jing Zhang, Yuan Yuan,
Probability of Detecting Disease-Associated SNPs in Case-Control Genome-Wide Association Studies
 Probability of Detecting Disease-Associated SNPs in Case-Control Genome-Wide Association Studies Ruth Pfeiffer, Ph.D. Mitchell Gail Biostatistics Branch Division of Cancer Epidemiology&Genetics National
Backward Genotype-Trait Association. in Case-Control Designs
 Backward Genotype-Trait Association (BGTA)-Based Dissection of Complex Traits in Case-Control Designs Tian Zheng, Hui Wang and Shaw-Hwa Lo Department of Statistics, Columbia University, New York, New York,
Introduction to Statistical Genetics (BST227) Lecture 6: Population Substructure in Association Studies
 Lecture 6: Population Substructure in Association Studies") Introduction to Statistical Genetics (BST227) Lecture 6: Population Substructure in Association Studies Confounding in gene+c associa+on studies q What is it? q What is the effect? q How to detect it?
Introduction to Statistical Genetics (BST227) Lecture 6: Population Substructure in Association Studies Confounding in gene+c associa+on studies q What is it? q What is the effect? q How to detect it?
Cover Page. The handle holds various files of this Leiden University dissertation
 Cover Page The handle http://hdl.handle.net/1887/35195 holds various files of this Leiden University dissertation Author: Balliu, Brunilda Title: Statistical methods for genetic association studies with
Variance Components: Phenotypic, Environmental and Genetic
 Variance Components: Phenotypic, Environmental and Genetic You should keep in mind that the Simplified Model for Polygenic Traits presented above is very simplified. In many cases, polygenic or quantitative
Linkage and Linkage Disequilibrium
 Linkage and Linkage Disequilibrium Summer Institute in Statistical Genetics 2014 Module 10 Topic 3 Linkage in a simple genetic cross Linkage In the early 1900 s Bateson and Punnet conducted genetic studies
Quantitative Genomics and Genetics BTRY 4830/6830; PBSB
 Quantitative Genomics and Genetics BTRY 4830/6830; PBSB.5201.01 Lecture 20: Epistasis and Alternative Tests in GWAS Jason Mezey jgm45@cornell.edu April 16, 2016 (Th) 8:40-9:55 None Announcements Summary
Quantitative Genomics and Genetics BTRY 4830/6830; PBSB
 Quantitative Genomics and Genetics BTRY 4830/6830; PBSB.5201.01 Lecture16: Population structure and logistic regression I Jason Mezey jgm45@cornell.edu April 11, 2017 (T) 8:40-9:55 Announcements I April
Test for interactions between a genetic marker set and environment in generalized linear models Supplementary Materials
 Biostatistics (2013), pp. 1 31 doi:10.1093/biostatistics/kxt006 Test for interactions between a genetic marker set and environment in generalized linear models Supplementary Materials XINYI LIN, SEUNGGUEN
Exam Applied Statistical Regression. Good Luck!
 Dr. M. Dettling Summer 2011 Exam Applied Statistical Regression Approved: Tables: Note: Any written material, calculator (without communication facility). Attached. All tests have to be done at the 5%-level.
On the limiting distribution of the likelihood ratio test in nucleotide mapping of complex disease
 On the limiting distribution of the likelihood ratio test in nucleotide mapping of complex disease Yuehua Cui 1 and Dong-Yun Kim 2 1 Department of Statistics and Probability, Michigan State University,
Outline of lectures 3-6
 GENOME 453 J. Felsenstein Evolutionary Genetics Autumn, 007 Population genetics Outline of lectures 3-6 1. We want to know what theory says about the reproduction of genotypes in a population. This results
HYPOTHESIS TESTING: THE CHI-SQUARE STATISTIC
 1 HYPOTHESIS TESTING: THE CHI-SQUARE STATISTIC 7 steps of Hypothesis Testing 1. State the hypotheses 2. Identify level of significant 3. Identify the critical values 4. Calculate test statistics 5. Compare
Biometrical Genetics
 Biometrical Genetics 2016 International Workshop on Statistical Genetic Methods for Human Complex Traits Boulder, CO. Lindon Eaves, VIPBG, Richmond VA. March 2016 Biometrical Genetics How do genes contribute
Statistical Methods in Mapping Complex Diseases
 University of Pennsylvania ScholarlyCommons Publicly Accessible Penn Dissertations Summer 8-12-2011 Statistical Methods in Mapping Complex Diseases Jing He University of Pennsylvania, jinghe@mail.med.upenn.edu
SUPPLEMENTARY INFORMATION
 doi:10.1038/nature25973 Power Simulations We performed extensive power simulations to demonstrate that the analyses carried out in our study are well powered. Our simulations indicate very high power for
Lecture WS Evolutionary Genetics Part I 1
 Quantitative genetics Quantitative genetics is the study of the inheritance of quantitative/continuous phenotypic traits, like human height and body size, grain colour in winter wheat or beak depth in
Biometrical Genetics. Lindon Eaves, VIPBG Richmond. Boulder CO, 2012
 Biometrical Genetics Lindon Eaves, VIPBG Richmond Boulder CO, 2012 Biometrical Genetics How do genes contribute to statistics (e.g. means, variances,skewness, kurtosis)? Some Literature: Jinks JL, Fulker
Modeling IBD for Pairs of Relatives. Biostatistics 666 Lecture 17
 Modeling IBD for Pairs of Relatives Biostatistics 666 Lecture 7 Previously Linkage Analysis of Relative Pairs IBS Methods Compare observed and expected sharing IBD Methods Account for frequency of shared
2. Map genetic distance between markers
 Chapter 5. Linkage Analysis Linkage is an important tool for the mapping of genetic loci and a method for mapping disease loci. With the availability of numerous DNA markers throughout the human genome,
Marginal Screening and Post-Selection Inference
 Marginal Screening and Post-Selection Inference Ian McKeague August 13, 2017 Ian McKeague (Columbia University) Marginal Screening August 13, 2017 1 / 29 Outline 1 Background on Marginal Screening 2 2
Package LBLGXE. R topics documented: July 20, Type Package
 Type Package Package LBLGXE July 20, 2015 Title Bayesian Lasso for detecting Rare (or Common) Haplotype Association and their interactions with Environmental Covariates Version 1.2 Date 2015-07-09 Author
Introduction to Analysis of Genomic Data Using R Lecture 6: Review Statistics (Part II)
") 1/45 Introduction to Analysis of Genomic Data Using R Lecture 6: Review Statistics (Part II) Dr. Yen-Yi Ho (hoyen@stat.sc.edu) Feb 9, 2018 2/45 Objectives of Lecture 6 Association between Variables Goodness
1/45 Introduction to Analysis of Genomic Data Using R Lecture 6: Review Statistics (Part II) Dr. Yen-Yi Ho (hoyen@stat.sc.edu) Feb 9, 2018 2/45 Objectives of Lecture 6 Association between Variables Goodness
Normal distribution We have a random sample from N(m, υ). The sample mean is Ȳ and the corrected sum of squares is S yy. After some simplification,
. The sample mean is Ȳ and the corrected sum of squares is S yy. After some simplification,") Likelihood Let P (D H) be the probability an experiment produces data D, given hypothesis H. Usually H is regarded as fixed and D variable. Before the experiment, the data D are unknown, and the probability
Likelihood Let P (D H) be the probability an experiment produces data D, given hypothesis H. Usually H is regarded as fixed and D variable. Before the experiment, the data D are unknown, and the probability
BTRY 7210: Topics in Quantitative Genomics and Genetics
 BTRY 7210: Topics in Quantitative Genomics and Genetics Jason Mezey Biological Statistics and Computational Biology (BSCB) Department of Genetic Medicine jgm45@cornell.edu February 12, 2015 Lecture 3:
Improved linear mixed models for genome-wide association studies
 Nature Methods Improved linear mixed models for genome-wide association studies Jennifer Listgarten, Christoph Lippert, Carl M Kadie, Robert I Davidson, Eleazar Eskin & David Heckerman Supplementary File
Quantitative Genomics and Genetics BTRY 4830/6830; PBSB
 Quantitative Genomics and Genetics BTRY 4830/6830; PBSB.5201.01 Lecture 18: Introduction to covariates, the QQ plot, and population structure II + minimal GWAS steps Jason Mezey jgm45@cornell.edu April
Outline of lectures 3-6
 GENOME 453 J. Felsenstein Evolutionary Genetics Autumn, 009 Population genetics Outline of lectures 3-6 1. We want to know what theory says about the reproduction of genotypes in a population. This results
Computational Systems Biology: Biology X
 Bud Mishra Room 1002, 715 Broadway, Courant Institute, NYU, New York, USA L#7:(Mar-23-2010) Genome Wide Association Studies 1 The law of causality... is a relic of a bygone age, surviving, like the monarchy,
Package ESPRESSO. August 29, 2013
 Package ESPRESSO August 29, 2013 Type Package Title Power Analysis and Sample Size Calculation Version 1.1 Date 2011-04-01 Author Amadou Gaye, Paul Burton Maintainer Amadou Gaye The package
Analyzing metabolomics data for association with genotypes using two-component Gaussian mixture distributions
 Analyzing metabolomics data for association with genotypes using two-component Gaussian mixture distributions Jason Westra Department of Statistics, Iowa State University Ames, IA 50011, United States
Weierstraß-Institut. für Angewandte Analysis und Stochastik. Leibniz-Institut im Forschungsverbund Berlin e. V. Preprint ISSN
 Weierstraß-Institut für Angewandte Analysis und Stochastik Leibniz-Institut im Forschungsverbund Berlin e. V. Preprint ISSN 2198-5855 On an extended interpretation of linkage disequilibrium in genetic
Supplementary Materials for Molecular QTL Discovery Incorporating Genomic Annotations using Bayesian False Discovery Rate Control
 Supplementary Materials for Molecular QTL Discovery Incorporating Genomic Annotations using Bayesian False Discovery Rate Control Xiaoquan Wen Department of Biostatistics, University of Michigan A Model
Lecture 9. QTL Mapping 2: Outbred Populations
 Lecture 9 QTL Mapping 2: Outbred Populations Bruce Walsh. Aug 2004. Royal Veterinary and Agricultural University, Denmark The major difference between QTL analysis using inbred-line crosses vs. outbred
Lecture 9. Short-Term Selection Response: Breeder s equation. Bruce Walsh lecture notes Synbreed course version 3 July 2013
 Lecture 9 Short-Term Selection Response: Breeder s equation Bruce Walsh lecture notes Synbreed course version 3 July 2013 1 Response to Selection Selection can change the distribution of phenotypes, and
Solutions to Problem Set 4
 Question 1 Solutions to 7.014 Problem Set 4 Because you have not read much scientific literature, you decide to study the genetics of garden peas. You have two pure breeding pea strains. One that is tall
SNP Association Studies with Case-Parent Trios
 SNP Association Studies with Case-Parent Trios Department of Biostatistics Johns Hopkins Bloomberg School of Public Health September 3, 2009 Population-based Association Studies Balding (2006). Nature
Guided Notes Unit 6: Classical Genetics
 Name: Date: Block: Chapter 6: Meiosis and Mendel I. Concept 6.1: Chromosomes and Meiosis Guided Notes Unit 6: Classical Genetics a. Meiosis: i. (In animals, meiosis occurs in the sex organs the testes
Genetic Association Studies in the Presence of Population Structure and Admixture
 Genetic Association Studies in the Presence of Population Structure and Admixture Purushottam W. Laud and Nicholas M. Pajewski Division of Biostatistics Department of Population Health Medical College
Supplementary Information for: Detection and interpretation of shared genetic influences on 42 human traits
 Supplementary Information for: Detection and interpretation of shared genetic influences on 42 human traits Joseph K. Pickrell 1,2,, Tomaz Berisa 1, Jimmy Z. Liu 1, Laure Segurel 3, Joyce Y. Tung 4, David
Natural Selection. Population Dynamics. The Origins of Genetic Variation. The Origins of Genetic Variation. Intergenerational Mutation Rate
 Natural Selection Population Dynamics Humans, Sickle-cell Disease, and Malaria How does a population of humans become resistant to malaria? Overproduction Environmental pressure/competition Pre-existing
Chapter 17: Population Genetics and Speciation
 Chapter 17: Population Genetics and Speciation Section 1: Genetic Variation Population Genetics: Normal Distribution: a line graph showing the general trends in a set of data of which most values are near
BTRY 4830/6830: Quantitative Genomics and Genetics
 BTRY 4830/6830: Quantitative Genomics and Genetics Lecture 23: Alternative tests in GWAS / (Brief) Introduction to Bayesian Inference Jason Mezey jgm45@cornell.edu Nov. 13, 2014 (Th) 8:40-9:55 Announcements
For 5% confidence χ 2 with 1 degree of freedom should exceed 3.841, so there is clear evidence for disequilibrium between S and M.
 STAT 550 Howework 6 Anton Amirov 1. This question relates to the same study you saw in Homework-4, by Dr. Arno Motulsky and coworkers, and published in Thompson et al. (1988; Am.J.Hum.Genet, 42, 113-124).
Person-Time Data. Incidence. Cumulative Incidence: Example. Cumulative Incidence. Person-Time Data. Person-Time Data
 Person-Time Data CF Jeff Lin, MD., PhD. Incidence 1. Cumulative incidence (incidence proportion) 2. Incidence density (incidence rate) December 14, 2005 c Jeff Lin, MD., PhD. c Jeff Lin, MD., PhD. Person-Time
Methods for Cryptic Structure. Methods for Cryptic Structure
 Case-Control Association Testing Review Consider testing for association between a disease and a genetic marker Idea is to look for an association by comparing allele/genotype frequencies between the cases
Solutions to Even-Numbered Exercises to accompany An Introduction to Population Genetics: Theory and Applications Rasmus Nielsen Montgomery Slatkin
 Solutions to Even-Numbered Exercises to accompany An Introduction to Population Genetics: Theory and Applications Rasmus Nielsen Montgomery Slatkin CHAPTER 1 1.2 The expected homozygosity, given allele
Supplementary Information for Efficient Bayesian mixed model analysis increases association power in large cohorts
 Supplementary Information for Efficient Bayesian mixed model analysis increases association power in large cohorts Po-Ru Loh, George Tucker, Brendan K Bulik-Sullivan, Bjarni J Vilhjálmsson, Hilary K Finucane,
SNP-SNP Interactions in Case-Parent Trios
 Detection of SNP-SNP Interactions in Case-Parent Trios Department of Biostatistics Johns Hopkins Bloomberg School of Public Health June 2, 2009 Karyotypes http://ghr.nlm.nih.gov/ Single Nucleotide Polymphisms
NIH Public Access Author Manuscript Stat Sin. Author manuscript; available in PMC 2013 August 15.
 NIH Public Access Author Manuscript Published in final edited form as: Stat Sin. 2012 ; 22: 1041 1074. ON MODEL SELECTION STRATEGIES TO IDENTIFY GENES UNDERLYING BINARY TRAITS USING GENOME-WIDE ASSOCIATION
Evolution of phenotypic traits
 Quantitative genetics Evolution of phenotypic traits Very few phenotypic traits are controlled by one locus, as in our previous discussion of genetics and evolution Quantitative genetics considers characters
1.5.1 ESTIMATION OF HAPLOTYPE FREQUENCIES:
 .5. ESTIMATION OF HAPLOTYPE FREQUENCIES: Chapter - 8 For SNPs, alleles A j,b j at locus j there are 4 haplotypes: A A, A B, B A and B B frequencies q,q,q 3,q 4. Assume HWE at haplotype level. Only the
Prediction of the Confidence Interval of Quantitative Trait Loci Location
 Behavior Genetics, Vol. 34, No. 4, July 2004 ( 2004) Prediction of the Confidence Interval of Quantitative Trait Loci Location Peter M. Visscher 1,3 and Mike E. Goddard 2 Received 4 Sept. 2003 Final 28
Quantitative characters II: heritability
 Quantitative characters II: heritability The variance of a trait (x) is the average squared deviation of x from its mean: V P = (1/n)Σ(x-m x ) 2 This total phenotypic variance can be partitioned into components:
STAT 526 Spring Midterm 1. Wednesday February 2, 2011
 STAT 526 Spring 2011 Midterm 1 Wednesday February 2, 2011 Time: 2 hours Name (please print): Show all your work and calculations. Partial credit will be given for work that is partially correct. Points
The supplementary document of LLR: A latent low-rank approach to colocalizing genetic risk variants in multiple GWAS
 The supplementary document of LLR: A latent low-rank approach to colocalizing genetic risk variants in multiple GWAS Jin Liu 1, Xiang Wan 2, Chaolong Wang 3, Chao Yang 4, Xiaowei Zhou 5, and Can Yang 6
Heritability estimation in modern genetics and connections to some new results for quadratic forms in statistics
 Heritability estimation in modern genetics and connections to some new results for quadratic forms in statistics Lee H. Dicker Rutgers University and Amazon, NYC Based on joint work with Ruijun Ma (Rutgers),
The universal validity of the possible triangle constraint for Affected-Sib-Pairs
 The Canadian Journal of Statistics Vol. 31, No.?, 2003, Pages???-??? La revue canadienne de statistique The universal validity of the possible triangle constraint for Affected-Sib-Pairs Zeny Z. Feng, Jiahua
A Robust Test for Two-Stage Design in Genome-Wide Association Studies
 Biometrics Supplementary Materials A Robust Test for Two-Stage Design in Genome-Wide Association Studies Minjung Kwak, Jungnam Joo and Gang Zheng Appendix A: Calculations of the thresholds D 1 and D The
Multiple regression. CM226: Machine Learning for Bioinformatics. Fall Sriram Sankararaman Acknowledgments: Fei Sha, Ameet Talwalkar
 Multiple regression CM226: Machine Learning for Bioinformatics. Fall 2016 Sriram Sankararaman Acknowledgments: Fei Sha, Ameet Talwalkar Multiple regression 1 / 36 Previous two lectures Linear and logistic
Affected Sibling Pairs. Biostatistics 666
 Affected Sibling airs Biostatistics 666 Today Discussion of linkage analysis using affected sibling pairs Our exploration will include several components we have seen before: A simple disease model IBD
Régression en grande dimension et épistasie par blocs pour les études d association
 Régression en grande dimension et épistasie par blocs pour les études d association V. Stanislas, C. Dalmasso, C. Ambroise Laboratoire de Mathématiques et Modélisation d Évry "Statistique et Génome" 1
Case Studies in Ecology and Evolution
 3 Non-random mating, Inbreeding and Population Structure. Jewelweed, Impatiens capensis, is a common woodland flower in the Eastern US. You may have seen the swollen seed pods that explosively pop when
Resemblance among relatives
 Resemblance among relatives Introduction Just as individuals may differ from one another in phenotype because they have different genotypes, because they developed in different environments, or both, relatives
. Also, in this case, p i = N1 ) T, (2) where. I γ C N(N 2 2 F + N1 2 Q)
 T, (2) where. I γ C N(N 2 2 F + N1 2 Q)") Supplementary information S7 Testing for association at imputed SPs puted SPs Score tests A Score Test needs calculations of the observed data score and information matrix only under the null hypothesis,
Supplementary information S7 Testing for association at imputed SPs puted SPs Score tests A Score Test needs calculations of the observed data score and information matrix only under the null hypothesis,
Discrete Multivariate Statistics
 Discrete Multivariate Statistics Univariate Discrete Random variables Let X be a discrete random variable which, in this module, will be assumed to take a finite number of t different values which are
Lecture 7: Interaction Analysis. Summer Institute in Statistical Genetics 2017
 Lecture 7: Interaction Analysis Timothy Thornton and Michael Wu Summer Institute in Statistical Genetics 2017 1 / 39 Lecture Outline Beyond main SNP effects Introduction to Concept of Statistical Interaction
Analysis of Categorical Data Three-Way Contingency Table
 Yu Lecture 4 p. 1/17 Analysis of Categorical Data Three-Way Contingency Table Yu Lecture 4 p. 2/17 Outline Three way contingency tables Simpson s paradox Marginal vs. conditional independence Homogeneous
Asymptotic distribution of the largest eigenvalue with application to genetic data
 Asymptotic distribution of the largest eigenvalue with application to genetic data Chong Wu University of Minnesota September 30, 2016 T32 Journal Club Chong Wu 1 / 25 Table of Contents 1 Background Gene-gene
Chapter 6 Linkage Disequilibrium & Gene Mapping (Recombination)
") 12/5/14 Chapter 6 Linkage Disequilibrium & Gene Mapping (Recombination) Linkage Disequilibrium Genealogical Interpretation of LD Association Mapping 1 Linkage and Recombination v linkage equilibrium ²
12/5/14 Chapter 6 Linkage Disequilibrium & Gene Mapping (Recombination) Linkage Disequilibrium Genealogical Interpretation of LD Association Mapping 1 Linkage and Recombination v linkage equilibrium ²
Efficient designs of gene environment interaction studies: implications of Hardy Weinberg equilibrium and gene environment independence
 Special Issue Paper Received 7 January 20, Accepted 28 September 20 Published online 24 February 202 in Wiley Online Library (wileyonlinelibrary.com) DOI: 0.002/sim.4460 Efficient designs of gene environment
Statistical Power of Model Selection Strategies for Genome-Wide Association Studies
 Statistical Power of Model Selection Strategies for Genome-Wide Association Studies Zheyang Wu 1, Hongyu Zhao 1,2 * 1 Department of Epidemiology and Public Health, Yale University School of Medicine, New
How to analyze many contingency tables simultaneously?
 How to analyze many contingency tables simultaneously? Thorsten Dickhaus Humboldt-Universität zu Berlin Beuth Hochschule für Technik Berlin, 31.10.2012 Outline Motivation: Genetic association studies Statistical