Probability of Detecting Disease-Associated SNPs in Case-Control Genome-Wide Association Studies
|
|
|
- Claud Hardy
- 5 years ago
- Views:
Transcription

1 Probability of Detecting Disease-Associated SNPs in Case-Control Genome-Wide Association Studies Ruth Pfeiffer, Ph.D. Mitchell Gail Biostatistics Branch Division of Cancer Epidemiology&Genetics National Cancer Institute, NIH, USA William Wheeler, David Pee Information Management Systems, Silver Spring, USA
2 Outline Genetics background Case-control Genome-Wide Association Study (GWAS) Ranking and selection procedures Performance criteria Detection probability Positive proportion Analytic results & simulations Extnesions: two stage designs Conclusions
: alterations in single nucelotide e.g. AAGGC -> ATGGC For variation to be considered a SNP, it must occur in >= 1% of population.")
3 The Human Genome Four DNA bases (nucleotides): A (adenine), T (thymine), G (guanine), C (cytosine) 3 billion base pairs 22+2 chromosomes > 99% of human DNA sequences identical ~8,000,000 single nucleotide polymorphims (SNPs): alterations in single nucelotide e.g. AAGGC -> ATGGC For variation to be considered a SNP, it must occur in >= 1% of population. SNPs occur every bases, in coding (gene) and noncoding regions Find disease genes: study variation in SNPs
4 Linkage Disequilibrium Genotyping all loci is not possible (not yet!) => Utilization of correlation of alleles at two loci Marker locus a: 10% (p a ) Disease locus G: 1% (p G ) A: 90% g: 99% D
5 Linkage Disequilibrium Bi-allelic disease locus: disease allele G (p G ), wild type allele g (p g ); Bi-allelic marker: a, A (p a, p A ) Linkage disequilibrium (LD) defined as D = P(A, G ) p A p G D =D/D max =D / min(p G p a,p g p a ) for D>0 r 2 =(D ) 2 p a p G /p A p g D is upper bound of r 2
6 Genome wide approaches Try to get closer to disease locus by high density SNP coverage: tag SNPs tag SNP: representative SNP in region of genome with high LD (r 2 >0.8) with untyped SNPs in that region (HapMap project) Typically: 550, ,000 tag SNPs/subject Still estimated that 25% of SNPs not captured adequately by tag SNPs
7 Case-control Genome Wide Association Studies Retrospective sample of unrelated cases (diseased) & controls (non-diseased) Exposure: tagsnps covering genome Assess correlation between SNP genotypes and disease status Common SNPs (minor allele frequencies>5%) Complex diseases (e.g. cancer) Small/moderate genetic effects (OR~1.3)
8 Genetic Association Disease outcome Y=1 or 0 Tag SNP Alleles A, a a: 10% (p a ) Disease Locus G: 1% (p G )
9 Observed data for cases and controls Cases Controls SNP i Genotype aa aa AA total r 0 r 1 r 2 s 0 s 1 s 2 R S Total counts n 0 n 1 n 2 N
10 Assumed Penetrance Model 1, diseased individual Y= 0, healthy individual P(Y=1 X i) exp[ X i] 1 exp[ X i] X i is a score attached to genotype of SNP i additive model: X i=# of A alleles (0,1,2) dominant model: X i=1 if {aa, AA}; = 0 if {aa} recessive model: X i=1 if {AA}; =0 if {aa,aa}
11 Tests for Association based on Test H 0: WaldTest : tag SNP 0 using W i 2 i / Var( i) ScoreTest : S U 2 / Var ˆ ( U ) i i 0 i n ˆ ˆ ˆ where U X (1 ) X i i i cases controls n
12 Remark on the null hypothesis H 0: no association between SNP i and disease is true if either one of the following 1. Disease has no genetic component 2. D=0 (true disease locus not in LD with observed SNP)
13 Factors causing false positive Population Stratification associations Confounding by ethnicity (bias) Cryptic relatedness Variance distortion Genomic control methods (Devlin & Roeder, 1999) Differential genotyping error (Clayton et al, Nature Genetics, 2005) Failure to call genotype not independent of case-control status Multiple comparison: test 550,000 hypotheses
14 Controlling for Multiplicity Control experiment-wise Type I error Bonferroni correction: α/n=10-7 Refinements (e.g. Simes Test) Adaptations for two-phase designs (Skol et al., 2006) Control false discovery rate (FDR) (Benjamini and Hochberg, 1995) Ranking and Selection
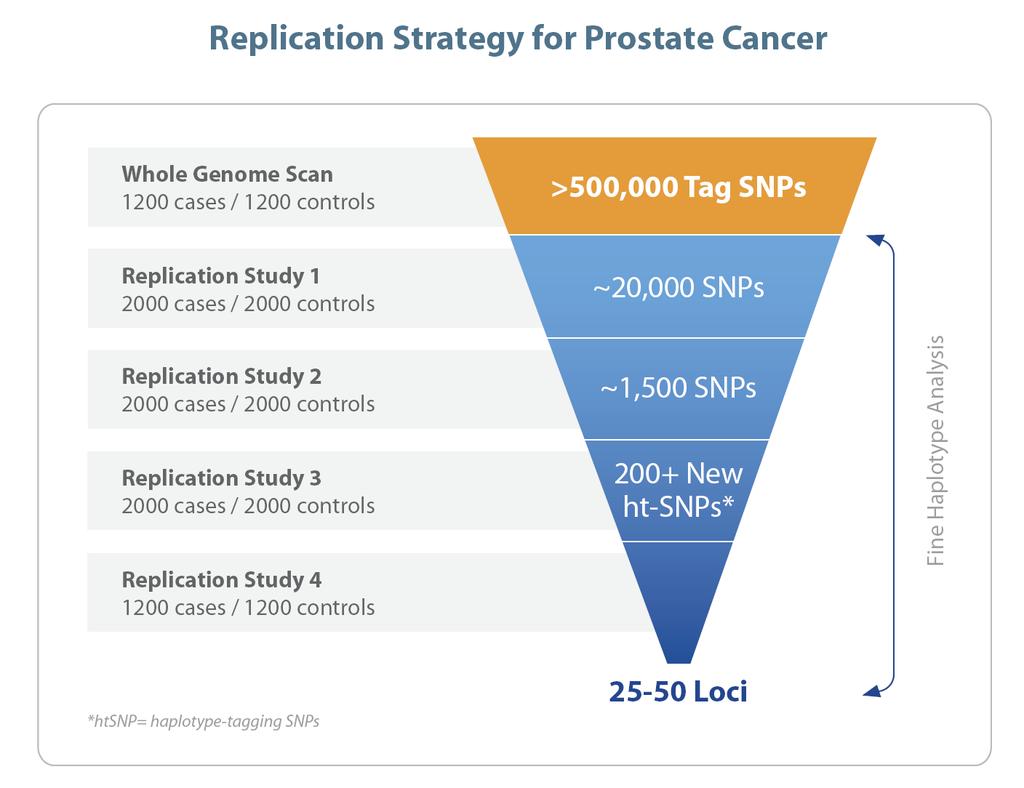
15 Motivating Example: Cancer Genetic Markers of Susceptibility (CGEMS) A three-year, $14 million initiative Outcome: Prostate cancer (finished), breast cancer (ongoing) Combine data from 5 large studies 550K chip: measures N=550,000 tag SNPs Yeager M, et al. Nature Genetics, 2007.
16
17 GWAS Designs Single stage design: all markers measured on all samples Two stage design: Stage 1: Proportion of available samples genotyped on large number of markers Stage 2: Proportion of these markers are followed up by genotyping them on remaining samples
18 Ranking and Selection for Single Stage Designs Sample n unrelated cases (Y=1) and n controls (Y=0) For each subject, measure X i =0,1,2, the number of minor alleles at SNP i for i=1,.. N.
19 Models for Genetic Effects in Source Population X i =0,1,2, - number of minor alleles at ith SNP SNPs 1,2,..., M disease-associated SNPs M+1,...,N non-disease associated Probability of disease in source population given by M exp( i X i ) P( Y 1 X,..., X ) i 1 1 N M 1exp( i X i ) i 1
20 Models for the genetic effects Fixed Effects Model: β i = β for i=1,2,..., M β i = 0 for i=m+1,..., N Random Effects Model: β i ~N(0,τ 2 ) for i=1,2,..., M β i = 0 for i=m+1,..., N E β i = 1/2 (2/ ) 0.798
21 Chi-Square Statistics for WaldTest : ScoreTest : Detecting Disease W Association i ˆ2 / Var ˆ ( ˆ i) 2 S U / Var ˆ ( U ) i i 0 i where U 0.5( X X ) n i i i i cases controls Use 2-sided test with additive scores, X =0,1,2, both tests unchanged by assignment of minor allele. n
22 Definitions for Ranking and Selection in One Stage Design SNP i T-selected if W i in top T values, i.e. rank(w i ) >N-T Detection probability (DP): probability that a disease SNP will be T-selected Proportion positive (PP): proportion of true disease SNPs among T selected SNPs
23 Show: use of marginal model in cases and controls appropriate Assumption: tagsnps independent in source population, i.e. X 1 independent of X 2,,X N For rare disease, P( Y 1 X) exp( ixi) For a single disease SNP, say SNP 1, i1 P( Y 1 X ) exp( X ) * where * log{ E exp( X )} M M i2 i i
24 Marginal model in cases and controls In case-control population, logit{ P( Y 1 X )} X ** ** * where log( 1/ 0) i P(sampled Y i), i 0,1 ˆi
25 If tagsnps independent in source population, then tagsnps independent in cases and controls Let P( X k) ki g P( X k Y 0) i ki i ki g P( X k, X l Y 0) klih i h ki lh f P( X k Y 1) exp( k){ exp( l)} ki i ki i li i l0 f P( X k, X l Y 1) klih i h ki lh exp( ik hl){ s exp( 1i s2h is1 hs2)} fki flh s s
26 Properties of test statistics W i Based on independence of genotypes in cases and controls, we compute expected values of prospective estimating equations and their cross products using the retrospective sampling distributions and show that scores are uncorrelated Estimating each β i using separate logistic models yields independent estimates of β i, thus W i are independent Similar results for score test S i ˆi
27 Generalizes to different G i for various disease SNPs with differing allele frequencies and β i Analytic Calculation of DP and PP Special Case: disease SNPs have same allele frequency and β Then W i ~ G for i=1, M: non-central chi-square with non centrality β 2 /Var(β) for fixed effects model W i ~ F, central chi-square (1df), i=m=1,.n DP M 1 N M [ g( c) G( c) {1 G( c)} {1 F( c)} { F( c)} ] dc min( M1, T1) Tm1 M 1 m m s NM s 0 m0 m s0 s PP=(M/T)(DP)
28 Approximation for M=1 Disease SNP 1 DP 1 G{ F (1 T / N)} In this case, DP equivalent to power of a test with same non-centrality but with type I error (alpha-level) T/N
29 Simulations Brute force simulation not feasible; use analytic results including independence For each simulation (ISIM) NSIM=10,000 For SNPs i=1,2, M obtain fixed or random β i For SNPs i=m+1,... N let β i =0 For each SNP: Draw random minor allele frequency (MAF) from distribution of MAFs in CGEMS controls (MAF 0.05): mean=0.276, median=0.26, IQR: Solve for μ ** such that P(Y=1)=0.5 Compute information matrix from case-control logistic model, using retrospective sampling distributions Compute Var( ˆi ) Sample from N(, Var( )) ˆi i ˆi Compute W i = ˆ2 ˆ / Var( ) i i
30 Simulated Estimates of DP and PP Define I(m, ISIM,T)=1 if rank(w m )> N-T, 0 otherwise M NSIM 1 1 ˆDP NSIM M I( m, ISIM, T) m1isim 1 Probability a given disease SNP is T-selected Proportion of disease SNPs selected PP=(M)(DP)/T ˆ ˆ
31 Results for Fixed Effects Model
32 DP for Fixed Effects Model. n=1000 black; n=8000 red. Odds ratios 1.1, 1.2, 1.3, 1.5, 2.0. T on log scale.
33 PP on log scale versus T on log scale. M=1 black; M=100 red. Odds ratios 1.2, 1.3, 1.5, 2.0.
34 Results for Random Effects Model
35 DP for Random Effects Model. n=1000 black; n=8000 red τ=log of 1.1, 1.2, 1.3, 1.5, 2.0. T on log scale.
36 Summary: single stage design DP and PP are useful criteria for ranking Related work: Zaykin & Zhivotovsky, 2005; Satagopan et al, 2004 For OR=1.2, large T required to assure adequate DP. T=25,000 yields DP=0.69 (fixed effects model) DP larger for fixed effects than random effects model DP is decreased by increasing M for M>T PP decreases with T for T>M. Increasing T to increase DP decreases PP and is futile if n is too small.
37
38 Extension: two stage designs Stage 1: π samples genotyped on 550,000 SNPs Stage 2: T 1 SNPs largest chi-square statistics followed up by genotyping on remaining samples. Replication analysis: view stage 2 as a replication study; final selection of the SNPs depended on ranking only the chi-square statistics in stage2 Joint analysis: for each of the T 1 SNPs selected in stage 1, compute λ C 1 + (1-λ)C 2, λ =0.0, 0.05, 0.1,., 1.0 C i chi-square statistic observed in stage i For each value of λ estimate DP, present maximal DP with corresponding λ. Skol et al, Nature genetics, 2006
39 Two stage designs, cont. Compute probability that exactly M 2 disease SNPs selected after stage 1, given that T 1 SNPs were selected and there were K 1 non-disease SNPs and M 1 disease SNPs Use joint densities of the (M 1 -M 2 +1)th and (M 1 -M 2 )th order statistic of M 1 disease SNPs, and (K 1 -T 1 -M 2 +1)th and (K 1 - T 1 -M 2 )th order statistic of the K 1 non-disease SNPs. W 1 (i) - order statistics of disease SNPs W 0 (i) - order statistics of non-disase SNPS
40 Analytic expression Fixed effects model, same allele frequencies for all disease SNPs P(exactly M disease SNPs chosen after stage1) w1 w P( W W ; W W ) ( M1M21) ( M1M21) ( K1T 1M21) ( M1M2 ) 1 1 P( W w2; w1 W ) dg( w1, w2) min( x1, w1) 0 0 w2 0 ( M1M21) ( M1M2 ) K1! M1! ( K T M 1)!( T M 1)! ( M M 1)!( M 1)! M2 1 T1 M2 1 K1 T1 M2 1 {1 ( )} ( ) ( ){1 ( )} ( ) ( ) ( ) Gw M ( 2) G w g w g w F x F x f x f x dx dx dw dw M 1 2 1
41 Special case: M 2 =0 Special cases 0 1 P(zero disease SNPs chosen after stage1) P( W W ) y 0 0 K1! ( K T )!( T 1)! ( K1T1 1) ( K1T1 1) T1 1 K1 T1 1 M11 {1 ( )} ( ) ( ) ( ) ( ) F y F y f y M G x g x dxdy 1 Special cases: M 2 =M P(all disease SNPs chosen after stage1) P( W W ) 0 y K1! ( K T M 1)!( T M )! (1) ( K1T 1M1) K1 T1 M11 T1 M1 M11 {1 ( )} ( ) ( ) (1 ( )) ( ) F y F y f y M G x g x dxdy 1 Special case M 2 =T P(all disease SNPs chosen after stage1) P( W W ) M! ( M1M 21) ( K1) K 1 M M M ( M1 M2)!( M2 1)! y K F( y) 1 f ( y) 1 G( x) 1 2{1 G( x)} 2 g( x) dxdy
42 Probability of detecting a disease SNP (DP) and optimal stage1 weight for fixed effects model with log odds ratio per allele β= log(1.2) for 8000 cases and 8000 controls Analysis sample Number of disease SNPs, M0 1 T T1 25,000 T2 1 T2 100 T2 1 T Replicate Joint opt 0.25 Replicate Joint opt 0.50 Replicate Joint opt 1.00 Onestage a
43 Summary, two stage design A small first stage can only partially be compensated for by selecting a large number of SNPs for further testing Even joint analysis does not improve DP much if π sample 0.25 As the cost per genotype for stage1 drops, compared to later stages, economic incentives for multi-stage designs decrease Advantage of one-stage design: offers unbiased estimates of genetic effects that can be combined easily with those from other studies; multi-stage designs introduce selection biases that complicate meta-analyses.
44 References Gail MH, Pfeiffer RM, Wheeler W, Pee D, Probability of Detecting Disease- Associated Single Nucleotide Polymorphisms in Case-Control Studies with Whole Genome Scans, in press, Biostatistics. Pfeiffer R, Gail MH, Genetic Epidemiology, 25 (2), pp , Skol et al Nature Genetics, 38: Dudridge 2006, Am J of Hum Genetics. 78: Marchini et al Nature Genetics, 2005: Freedman et al Nature Genetics, 36: Marchini et al Nature Genetics, 36: Campbell et al Nature Genetics, 37: Devlin and Roeder, Biometrics, 55: Price et al Nature Genetics, 38: Pritchard JK et al Genetics, 155: Reich and Goldstein, Genetic Epidemiology, 20: 4-16 Satten GA et al Am J. Hum. Genet. 68:
45 Platforms & SNP Chips Affymetrix 100K Affymetrix 500K } essentially random set of SNPs Illumina 317K Illumina 550K } designed using Hapmap Illumina 650Y (550K+100K YRI fill in)
Probability of detecting disease-associated single nucleotide polymorphisms in case-control genome-wide association studies
 Biostatistics Advance Access published September 14, 2007 Biostatistics (2007), 0, 0, pp. 1 15 doi:10.1093/biostatistics/kxm032 Probability of detecting disease-associated single nucleotide polymorphisms
Genotype Imputation. Biostatistics 666
 Genotype Imputation Biostatistics 666 Previously Hidden Markov Models for Relative Pairs Linkage analysis using affected sibling pairs Estimation of pairwise relationships Identity-by-Descent Relatives
NIH Public Access Author Manuscript Stat Sin. Author manuscript; available in PMC 2013 August 15.
 NIH Public Access Author Manuscript Published in final edited form as: Stat Sin. 2012 ; 22: 1041 1074. ON MODEL SELECTION STRATEGIES TO IDENTIFY GENES UNDERLYING BINARY TRAITS USING GENOME-WIDE ASSOCIATION
Methods for Cryptic Structure. Methods for Cryptic Structure
 Case-Control Association Testing Review Consider testing for association between a disease and a genetic marker Idea is to look for an association by comparing allele/genotype frequencies between the cases
Theoretical and computational aspects of association tests: application in case-control genome-wide association studies.
 Theoretical and computational aspects of association tests: application in case-control genome-wide association studies Mathieu Emily November 18, 2014 Caen mathieu.emily@agrocampus-ouest.fr - Agrocampus
Expression QTLs and Mapping of Complex Trait Loci. Paul Schliekelman Statistics Department University of Georgia
 Expression QTLs and Mapping of Complex Trait Loci Paul Schliekelman Statistics Department University of Georgia Definitions: Genes, Loci and Alleles A gene codes for a protein. Proteins due everything.
Quantitative Genomics and Genetics BTRY 4830/6830; PBSB
 Quantitative Genomics and Genetics BTRY 4830/6830; PBSB.5201.01 Lecture 20: Epistasis and Alternative Tests in GWAS Jason Mezey jgm45@cornell.edu April 16, 2016 (Th) 8:40-9:55 None Announcements Summary
p(d g A,g B )p(g B ), g B
p(g B ), g B") Supplementary Note Marginal effects for two-locus models Here we derive the marginal effect size of the three models given in Figure 1 of the main text. For each model we assume the two loci (A and B)
Supplementary Note Marginal effects for two-locus models Here we derive the marginal effect size of the three models given in Figure 1 of the main text. For each model we assume the two loci (A and B)
Binomial Mixture Model-based Association Tests under Genetic Heterogeneity
 Binomial Mixture Model-based Association Tests under Genetic Heterogeneity Hui Zhou, Wei Pan Division of Biostatistics, School of Public Health, University of Minnesota, Minneapolis, MN 55455 April 30,
HERITABILITY ESTIMATION USING A REGULARIZED REGRESSION APPROACH (HERRA)
") BIRS 016 1 HERITABILITY ESTIMATION USING A REGULARIZED REGRESSION APPROACH (HERRA) Malka Gorfine, Tel Aviv University, Israel Joint work with Li Hsu, FHCRC, Seattle, USA BIRS 016 The concept of heritability
BIRS 016 1 HERITABILITY ESTIMATION USING A REGULARIZED REGRESSION APPROACH (HERRA) Malka Gorfine, Tel Aviv University, Israel Joint work with Li Hsu, FHCRC, Seattle, USA BIRS 016 The concept of heritability
(Genome-wide) association analysis
 association analysis") (Genome-wide) association analysis 1 Key concepts Mapping QTL by association relies on linkage disequilibrium in the population; LD can be caused by close linkage between a QTL and marker (= good) or by
(Genome-wide) association analysis 1 Key concepts Mapping QTL by association relies on linkage disequilibrium in the population; LD can be caused by close linkage between a QTL and marker (= good) or by
Association studies and regression
 Association studies and regression CM226: Machine Learning for Bioinformatics. Fall 2016 Sriram Sankararaman Acknowledgments: Fei Sha, Ameet Talwalkar Association studies and regression 1 / 104 Administration
Bayesian Inference of Interactions and Associations
 Bayesian Inference of Interactions and Associations Jun Liu Department of Statistics Harvard University http://www.fas.harvard.edu/~junliu Based on collaborations with Yu Zhang, Jing Zhang, Yuan Yuan,
BTRY 7210: Topics in Quantitative Genomics and Genetics
 BTRY 7210: Topics in Quantitative Genomics and Genetics Jason Mezey Biological Statistics and Computational Biology (BSCB) Department of Genetic Medicine jgm45@cornell.edu February 12, 2015 Lecture 3:
Modeling IBD for Pairs of Relatives. Biostatistics 666 Lecture 17
 Modeling IBD for Pairs of Relatives Biostatistics 666 Lecture 7 Previously Linkage Analysis of Relative Pairs IBS Methods Compare observed and expected sharing IBD Methods Account for frequency of shared
Nature Genetics: doi: /ng Supplementary Figure 1. Number of cases and proxy cases required to detect association at designs.
 Supplementary Figure 1 Number of cases and proxy cases required to detect association at designs. = 5 10 8 for case control and proxy case control The ratio of controls to cases (or proxy cases) is 1.
Lecture 1: Case-Control Association Testing. Summer Institute in Statistical Genetics 2015
 Timothy Thornton and Michael Wu Summer Institute in Statistical Genetics 2015 1 / 1 Introduction Association mapping is now routinely being used to identify loci that are involved with complex traits.
How to analyze many contingency tables simultaneously?
 How to analyze many contingency tables simultaneously? Thorsten Dickhaus Humboldt-Universität zu Berlin Beuth Hochschule für Technik Berlin, 31.10.2012 Outline Motivation: Genetic association studies Statistical
Non-specific filtering and control of false positives
 Non-specific filtering and control of false positives Richard Bourgon 16 June 2009 bourgon@ebi.ac.uk EBI is an outstation of the European Molecular Biology Laboratory Outline Multiple testing I: overview
Case-Control Association Testing. Case-Control Association Testing
 Introduction Association mapping is now routinely being used to identify loci that are involved with complex traits. Technological advances have made it feasible to perform case-control association studies
COMBI - Combining high-dimensional classification and multiple hypotheses testing for the analysis of big data in genetics
 COMBI - Combining high-dimensional classification and multiple hypotheses testing for the analysis of big data in genetics Thorsten Dickhaus University of Bremen Institute for Statistics AG DANK Herbsttagung
Friday Harbor From Genetics to GWAS (Genome-wide Association Study) Sept David Fardo
 Sept David Fardo") Friday Harbor 2017 From Genetics to GWAS (Genome-wide Association Study) Sept 7 2017 David Fardo Purpose: prepare for tomorrow s tutorial Genetic Variants Quality Control Imputation Association Visualization
Friday Harbor 2017 From Genetics to GWAS (Genome-wide Association Study) Sept 7 2017 David Fardo Purpose: prepare for tomorrow s tutorial Genetic Variants Quality Control Imputation Association Visualization
Computational Systems Biology: Biology X
 Bud Mishra Room 1002, 715 Broadway, Courant Institute, NYU, New York, USA L#7:(Mar-23-2010) Genome Wide Association Studies 1 The law of causality... is a relic of a bygone age, surviving, like the monarchy,
Introduction to Statistical Genetics (BST227) Lecture 6: Population Substructure in Association Studies
 Lecture 6: Population Substructure in Association Studies") Introduction to Statistical Genetics (BST227) Lecture 6: Population Substructure in Association Studies Confounding in gene+c associa+on studies q What is it? q What is the effect? q How to detect it?
Introduction to Statistical Genetics (BST227) Lecture 6: Population Substructure in Association Studies Confounding in gene+c associa+on studies q What is it? q What is the effect? q How to detect it?
Statistical Methods in Mapping Complex Diseases
 University of Pennsylvania ScholarlyCommons Publicly Accessible Penn Dissertations Summer 8-12-2011 Statistical Methods in Mapping Complex Diseases Jing He University of Pennsylvania, jinghe@mail.med.upenn.edu
Lecture 7: Interaction Analysis. Summer Institute in Statistical Genetics 2017
 Lecture 7: Interaction Analysis Timothy Thornton and Michael Wu Summer Institute in Statistical Genetics 2017 1 / 39 Lecture Outline Beyond main SNP effects Introduction to Concept of Statistical Interaction
Test for interactions between a genetic marker set and environment in generalized linear models Supplementary Materials
 Biostatistics (2013), pp. 1 31 doi:10.1093/biostatistics/kxt006 Test for interactions between a genetic marker set and environment in generalized linear models Supplementary Materials XINYI LIN, SEUNGGUEN
Association Testing with Quantitative Traits: Common and Rare Variants. Summer Institute in Statistical Genetics 2014 Module 10 Lecture 5
 Association Testing with Quantitative Traits: Common and Rare Variants Timothy Thornton and Katie Kerr Summer Institute in Statistical Genetics 2014 Module 10 Lecture 5 1 / 41 Introduction to Quantitative
A novel fuzzy set based multifactor dimensionality reduction method for detecting gene-gene interaction
 A novel fuzzy set based multifactor dimensionality reduction method for detecting gene-gene interaction Sangseob Leem, Hye-Young Jung, Sungyoung Lee and Taesung Park Bioinformatics and Biostatistics lab
Linkage and Linkage Disequilibrium
 Linkage and Linkage Disequilibrium Summer Institute in Statistical Genetics 2014 Module 10 Topic 3 Linkage in a simple genetic cross Linkage In the early 1900 s Bateson and Punnet conducted genetic studies
1 Springer. Nan M. Laird Christoph Lange. The Fundamentals of Modern Statistical Genetics
 1 Springer Nan M. Laird Christoph Lange The Fundamentals of Modern Statistical Genetics 1 Introduction to Statistical Genetics and Background in Molecular Genetics 0 0 1 0 0 0 0 0 0 0 0 0 0 0 0 0 0 0 0
The Generalized Higher Criticism for Testing SNP-sets in Genetic Association Studies
 The Generalized Higher Criticism for Testing SNP-sets in Genetic Association Studies Ian Barnett, Rajarshi Mukherjee & Xihong Lin Harvard University ibarnett@hsph.harvard.edu June 24, 2014 Ian Barnett
Cover Page. The handle holds various files of this Leiden University dissertation
 Cover Page The handle http://hdl.handle.net/1887/35195 holds various files of this Leiden University dissertation Author: Balliu, Brunilda Title: Statistical methods for genetic association studies with
1. Understand the methods for analyzing population structure in genomes
 MSCBIO 2070/02-710: Computational Genomics, Spring 2016 HW3: Population Genetics Due: 24:00 EST, April 4, 2016 by autolab Your goals in this assignment are to 1. Understand the methods for analyzing population
Genotype Imputation. Class Discussion for January 19, 2016
 Genotype Imputation Class Discussion for January 19, 2016 Intuition Patterns of genetic variation in one individual guide our interpretation of the genomes of other individuals Imputation uses previously
Introduction to Linkage Disequilibrium
 Introduction to September 10, 2014 Suppose we have two genes on a single chromosome gene A and gene B such that each gene has only two alleles Aalleles : A 1 and A 2 Balleles : B 1 and B 2 Suppose we have
Efficient designs of gene environment interaction studies: implications of Hardy Weinberg equilibrium and gene environment independence
 Special Issue Paper Received 7 January 20, Accepted 28 September 20 Published online 24 February 202 in Wiley Online Library (wileyonlinelibrary.com) DOI: 0.002/sim.4460 Efficient designs of gene environment
Looking at the Other Side of Bonferroni
 Department of Biostatistics University of Washington 24 May 2012 Multiple Testing: Control the Type I Error Rate When analyzing genetic data, one will commonly perform over 1 million (and growing) hypothesis
Genetic Association Studies in the Presence of Population Structure and Admixture
 Genetic Association Studies in the Presence of Population Structure and Admixture Purushottam W. Laud and Nicholas M. Pajewski Division of Biostatistics Department of Population Health Medical College
Proportional Variance Explained by QLT and Statistical Power. Proportional Variance Explained by QTL and Statistical Power
 Proportional Variance Explained by QTL and Statistical Power Partitioning the Genetic Variance We previously focused on obtaining variance components of a quantitative trait to determine the proportion
High-Throughput Sequencing Course. Introduction. Introduction. Multiple Testing. Biostatistics and Bioinformatics. Summer 2018
 High-Throughput Sequencing Course Multiple Testing Biostatistics and Bioinformatics Summer 2018 Introduction You have previously considered the significance of a single gene Introduction You have previously
CS 4491/CS 7990 SPECIAL TOPICS IN BIOINFORMATICS
 CS 4491/CS 7990 SPECIAL TOPICS IN BIOINFORMATICS * Some contents are adapted from Dr. Hung Huang and Dr. Chengkai Li at UT Arlington Mingon Kang, Ph.D. Computer Science, Kennesaw State University Problems
Statistical Power of Model Selection Strategies for Genome-Wide Association Studies
 Statistical Power of Model Selection Strategies for Genome-Wide Association Studies Zheyang Wu 1, Hongyu Zhao 1,2 * 1 Department of Epidemiology and Public Health, Yale University School of Medicine, New
Supplementary Materials for Molecular QTL Discovery Incorporating Genomic Annotations using Bayesian False Discovery Rate Control
 Supplementary Materials for Molecular QTL Discovery Incorporating Genomic Annotations using Bayesian False Discovery Rate Control Xiaoquan Wen Department of Biostatistics, University of Michigan A Model
The E-M Algorithm in Genetics. Biostatistics 666 Lecture 8
 The E-M Algorithm in Genetics Biostatistics 666 Lecture 8 Maximum Likelihood Estimation of Allele Frequencies Find parameter estimates which make observed data most likely General approach, as long as
Asymptotic distribution of the largest eigenvalue with application to genetic data
 Asymptotic distribution of the largest eigenvalue with application to genetic data Chong Wu University of Minnesota September 30, 2016 T32 Journal Club Chong Wu 1 / 25 Table of Contents 1 Background Gene-gene
Powerful multi-locus tests for genetic association in the presence of gene-gene and gene-environment interactions
 Powerful multi-locus tests for genetic association in the presence of gene-gene and gene-environment interactions Nilanjan Chatterjee, Zeynep Kalaylioglu 2, Roxana Moslehi, Ulrike Peters 3, Sholom Wacholder
CSci 8980: Advanced Topics in Graphical Models Analysis of Genetic Variation
 CSci 8980: Advanced Topics in Graphical Models Analysis of Genetic Variation Instructor: Arindam Banerjee November 26, 2007 Genetic Polymorphism Single nucleotide polymorphism (SNP) Genetic Polymorphism
Régression en grande dimension et épistasie par blocs pour les études d association
 Régression en grande dimension et épistasie par blocs pour les études d association V. Stanislas, C. Dalmasso, C. Ambroise Laboratoire de Mathématiques et Modélisation d Évry "Statistique et Génome" 1
Affected Sibling Pairs. Biostatistics 666
 Affected Sibling airs Biostatistics 666 Today Discussion of linkage analysis using affected sibling pairs Our exploration will include several components we have seen before: A simple disease model IBD
Population Genetics. with implications for Linkage Disequilibrium. Chiara Sabatti, Human Genetics 6357a Gonda
 1 Population Genetics with implications for Linkage Disequilibrium Chiara Sabatti, Human Genetics 6357a Gonda csabatti@mednet.ucla.edu 2 Hardy-Weinberg Hypotheses: infinite populations; no inbreeding;
The Generalized Higher Criticism for Testing SNP-sets in Genetic Association Studies
 The Generalized Higher Criticism for Testing SNP-sets in Genetic Association Studies Ian Barnett, Rajarshi Mukherjee & Xihong Lin Harvard University ibarnett@hsph.harvard.edu August 5, 2014 Ian Barnett
MODEL-FREE LINKAGE AND ASSOCIATION MAPPING OF COMPLEX TRAITS USING QUANTITATIVE ENDOPHENOTYPES
 MODEL-FREE LINKAGE AND ASSOCIATION MAPPING OF COMPLEX TRAITS USING QUANTITATIVE ENDOPHENOTYPES Saurabh Ghosh Human Genetics Unit Indian Statistical Institute, Kolkata Most common diseases are caused by
Lecture WS Evolutionary Genetics Part I 1
 Quantitative genetics Quantitative genetics is the study of the inheritance of quantitative/continuous phenotypic traits, like human height and body size, grain colour in winter wheat or beak depth in
Learning Your Identity and Disease from Research Papers: Information Leaks in Genome-Wide Association Study
 Learning Your Identity and Disease from Research Papers: Information Leaks in Genome-Wide Association Study Rui Wang, Yong Li, XiaoFeng Wang, Haixu Tang and Xiaoyong Zhou Indiana University at Bloomington
Pairwise rank based likelihood for estimating the relationship between two homogeneous populations and their mixture proportion
 Pairwise rank based likelihood for estimating the relationship between two homogeneous populations and their mixture proportion Glenn Heller and Jing Qin Department of Epidemiology and Biostatistics Memorial
Variance Component Models for Quantitative Traits. Biostatistics 666
 Variance Component Models for Quantitative Traits Biostatistics 666 Today Analysis of quantitative traits Modeling covariance for pairs of individuals estimating heritability Extending the model beyond
The Quantitative TDT
 The Quantitative TDT (Quantitative Transmission Disequilibrium Test) Warren J. Ewens NUS, Singapore 10 June, 2009 The initial aim of the (QUALITATIVE) TDT was to test for linkage between a marker locus
Relationship between Genomic Distance-Based Regression and Kernel Machine Regression for Multi-marker Association Testing
 Relationship between Genomic Distance-Based Regression and Kernel Machine Regression for Multi-marker Association Testing Wei Pan Division of Biostatistics, School of Public Health, University of Minnesota,
BTRY 4830/6830: Quantitative Genomics and Genetics
 BTRY 4830/6830: Quantitative Genomics and Genetics Lecture 23: Alternative tests in GWAS / (Brief) Introduction to Bayesian Inference Jason Mezey jgm45@cornell.edu Nov. 13, 2014 (Th) 8:40-9:55 Announcements
Multiple testing: Intro & FWER 1
 Multiple testing: Intro & FWER 1 Mark van de Wiel mark.vdwiel@vumc.nl Dep of Epidemiology & Biostatistics,VUmc, Amsterdam Dep of Mathematics, VU 1 Some slides courtesy of Jelle Goeman 1 Practical notes
2. Map genetic distance between markers
 Chapter 5. Linkage Analysis Linkage is an important tool for the mapping of genetic loci and a method for mapping disease loci. With the availability of numerous DNA markers throughout the human genome,
Statistical Analysis of Haplotypes, Untyped SNPs, and CNVs in Genome-Wide Association Studies
 Statistical Analysis of Haplotypes, Untyped SNPs, and CNVs in Genome-Wide Association Studies by Yijuan Hu A dissertation submitted to the faculty of the University of North Carolina at Chapel Hill in
PCA vignette Principal components analysis with snpstats
 PCA vignette Principal components analysis with snpstats David Clayton October 30, 2018 Principal components analysis has been widely used in population genetics in order to study population structure
Parts 2. Modeling chromosome segregation
 Genome 371, Autumn 2018 Quiz Section 2 Meiosis Goals: To increase your familiarity with the molecular control of meiosis, outcomes of meiosis, and the important role of crossing over in generating genetic
Logistic Regression Model for Analyzing Extended Haplotype Data
 Genetic Epidemiology 15:173 181 (1998) Logistic Regression Model for Analyzing Extended Haplotype Data Sylvan Wallenstein, 1 * Susan E. Hodge, 3 and Ainsley Weston 2 1 Department of Biomathematical Sciences,
Lecture 6 April
 Stats 300C: Theory of Statistics Spring 2017 Lecture 6 April 14 2017 Prof. Emmanuel Candes Scribe: S. Wager, E. Candes 1 Outline Agenda: From global testing to multiple testing 1. Testing the global null
Multiple Change-Point Detection and Analysis of Chromosome Copy Number Variations
 Multiple Change-Point Detection and Analysis of Chromosome Copy Number Variations Yale School of Public Health Joint work with Ning Hao, Yue S. Niu presented @Tsinghua University Outline 1 The Problem
Chapter 6 Linkage Disequilibrium & Gene Mapping (Recombination)
") 12/5/14 Chapter 6 Linkage Disequilibrium & Gene Mapping (Recombination) Linkage Disequilibrium Genealogical Interpretation of LD Association Mapping 1 Linkage and Recombination v linkage equilibrium ²
12/5/14 Chapter 6 Linkage Disequilibrium & Gene Mapping (Recombination) Linkage Disequilibrium Genealogical Interpretation of LD Association Mapping 1 Linkage and Recombination v linkage equilibrium ²
SNP Association Studies with Case-Parent Trios
 SNP Association Studies with Case-Parent Trios Department of Biostatistics Johns Hopkins Bloomberg School of Public Health September 3, 2009 Population-based Association Studies Balding (2006). Nature
Lecture 28. Ingo Ruczinski. December 3, Department of Biostatistics Johns Hopkins Bloomberg School of Public Health Johns Hopkins University
 Lecture 28 Department of Biostatistics Johns Hopkins Bloomberg School of Public Health Johns Hopkins University December 3, 2015 1 2 3 4 5 1 Familywise error rates 2 procedure 3 Performance of with multiple
Lecture 2: Genetic Association Testing with Quantitative Traits. Summer Institute in Statistical Genetics 2017
 Lecture 2: Genetic Association Testing with Quantitative Traits Instructors: Timothy Thornton and Michael Wu Summer Institute in Statistical Genetics 2017 1 / 29 Introduction to Quantitative Trait Mapping
Dr. Junchao Xia Center of Biophysics and Computational Biology. Fall /8/2016 1/38
 BIO5312 Biostatistics Lecture 11: Multisample Hypothesis Testing II Dr. Junchao Xia Center of Biophysics and Computational Biology Fall 2016 11/8/2016 1/38 Outline In this lecture, we will continue to
Statistical testing. Samantha Kleinberg. October 20, 2009
 October 20, 2009 Intro to significance testing Significance testing and bioinformatics Gene expression: Frequently have microarray data for some group of subjects with/without the disease. Want to find
Estimating the Marginal Odds Ratio in Observational Studies
 Estimating the Marginal Odds Ratio in Observational Studies Travis Loux Christiana Drake Department of Statistics University of California, Davis June 20, 2011 Outline The Counterfactual Model Odds Ratios
Statistical inference on the penetrances of rare genetic mutations based on a case family design
 Biostatistics (2010), 11, 3, pp. 519 532 doi:10.1093/biostatistics/kxq009 Advance Access publication on February 23, 2010 Statistical inference on the penetrances of rare genetic mutations based on a case
Tests for the Odds Ratio in a Matched Case-Control Design with a Quantitative X
 Chapter 157 Tests for the Odds Ratio in a Matched Case-Control Design with a Quantitative X Introduction This procedure calculates the power and sample size necessary in a matched case-control study designed
X Chromosome Association Testing in Genome-Wide Association Studies
 X Chromosome Association Testing in Genome-Wide Association Studies Honours Thesis November 6, 009 Peter Hickey Department of Mathematics and Statistics, The University of Melbourne Bioinformatics Division,
Linear Regression (1/1/17)
") STA613/CBB540: Statistical methods in computational biology Linear Regression (1/1/17) Lecturer: Barbara Engelhardt Scribe: Ethan Hada 1. Linear regression 1.1. Linear regression basics. Linear regression
STA613/CBB540: Statistical methods in computational biology Linear Regression (1/1/17) Lecturer: Barbara Engelhardt Scribe: Ethan Hada 1. Linear regression 1.1. Linear regression basics. Linear regression
Harvard University. Harvard University Biostatistics Working Paper Series
 Harvard University Harvard University Biostatistics Working Paper Series Year 2014 Paper 174 Control Function Assisted IPW Estimation with a Secondary Outcome in Case-Control Studies Tamar Sofer Marilyn
Tutorial Session 2. MCMC for the analysis of genetic data on pedigrees:
 MCMC for the analysis of genetic data on pedigrees: Tutorial Session 2 Elizabeth Thompson University of Washington Genetic mapping and linkage lod scores Monte Carlo likelihood and likelihood ratio estimation
Research Article Sample Size Calculation for Controlling False Discovery Proportion
 Probability and Statistics Volume 2012, Article ID 817948, 13 pages doi:10.1155/2012/817948 Research Article Sample Size Calculation for Controlling False Discovery Proportion Shulian Shang, 1 Qianhe Zhou,
Conditions under which genome-wide association studies will be positively misleading
 Genetics: Published Articles Ahead of Print, published on September 2, 2010 as 10.1534/genetics.110.121665 Conditions under which genome-wide association studies will be positively misleading Alexander
Statistical Applications in Genetics and Molecular Biology
 Statistical Applications in Genetics and Molecular Biology Volume 5, Issue 1 2006 Article 28 A Two-Step Multiple Comparison Procedure for a Large Number of Tests and Multiple Treatments Hongmei Jiang Rebecca
Marginal Screening and Post-Selection Inference
 Marginal Screening and Post-Selection Inference Ian McKeague August 13, 2017 Ian McKeague (Columbia University) Marginal Screening August 13, 2017 1 / 29 Outline 1 Background on Marginal Screening 2 2
Empirical Bayes Moderation of Asymptotically Linear Parameters
 Empirical Bayes Moderation of Asymptotically Linear Parameters Nima Hejazi Division of Biostatistics University of California, Berkeley stat.berkeley.edu/~nhejazi nimahejazi.org twitter/@nshejazi github/nhejazi
Backward Genotype-Trait Association. in Case-Control Designs
 Backward Genotype-Trait Association (BGTA)-Based Dissection of Complex Traits in Case-Control Designs Tian Zheng, Hui Wang and Shaw-Hwa Lo Department of Statistics, Columbia University, New York, New York,
Lecture 3: Basic Statistical Tools. Bruce Walsh lecture notes Tucson Winter Institute 7-9 Jan 2013
 Lecture 3: Basic Statistical Tools Bruce Walsh lecture notes Tucson Winter Institute 7-9 Jan 2013 1 Basic probability Events are possible outcomes from some random process e.g., a genotype is AA, a phenotype
Haplotyping. Biostatistics 666
 Haplotyping Biostatistics 666 Previously Introduction to te E-M algoritm Approac for likeliood optimization Examples related to gene counting Allele frequency estimation recessive disorder Allele frequency
Learning gene regulatory networks Statistical methods for haplotype inference Part I
 Learning gene regulatory networks Statistical methods for haplotype inference Part I Input: Measurement of mrn levels of all genes from microarray or rna sequencing Samples (e.g. 200 patients with lung
Lecture 9. QTL Mapping 2: Outbred Populations
 Lecture 9 QTL Mapping 2: Outbred Populations Bruce Walsh. Aug 2004. Royal Veterinary and Agricultural University, Denmark The major difference between QTL analysis using inbred-line crosses vs. outbred
High-Throughput Sequencing Course
 High-Throughput Sequencing Course DESeq Model for RNA-Seq Biostatistics and Bioinformatics Summer 2017 Outline Review: Standard linear regression model (e.g., to model gene expression as function of an
Parts 2. Modeling chromosome segregation
 Genome 371, Autumn 2017 Quiz Section 2 Meiosis Goals: To increase your familiarity with the molecular control of meiosis, outcomes of meiosis, and the important role of crossing over in generating genetic
Lesson 4: Understanding Genetics
 Lesson 4: Understanding Genetics 1 Terms Alleles Chromosome Co dominance Crossover Deoxyribonucleic acid DNA Dominant Genetic code Genome Genotype Heredity Heritability Heritability estimate Heterozygous
Family-wise Error Rate Control in QTL Mapping and Gene Ontology Graphs
 Family-wise Error Rate Control in QTL Mapping and Gene Ontology Graphs with Remarks on Family Selection Dissertation Defense April 5, 204 Contents Dissertation Defense Introduction 2 FWER Control within
Power and sample size calculations for designing rare variant sequencing association studies.
 Power and sample size calculations for designing rare variant sequencing association studies. Seunggeun Lee 1, Michael C. Wu 2, Tianxi Cai 1, Yun Li 2,3, Michael Boehnke 4 and Xihong Lin 1 1 Department
SNP-SNP Interactions in Case-Parent Trios
 Detection of SNP-SNP Interactions in Case-Parent Trios Department of Biostatistics Johns Hopkins Bloomberg School of Public Health June 2, 2009 Karyotypes http://ghr.nlm.nih.gov/ Single Nucleotide Polymphisms
ABC Fax Original Paper
 Original Paper Hum Hered 2003;55:27 36 DOI: 10.1159/000071807 Received: October 23, 2002 Accepted after revision: March 27, 2003 Choosing Haplotype-Tagging SNPS Based on Unphased Genotype Data Using a
Computational Systems Biology: Biology X
 Bud Mishra Room 1002, 715 Broadway, Courant Institute, NYU, New York, USA L#5:(Mar-21-2010) Genome Wide Association Studies 1 Experiments on Garden Peas Statistical Significance 2 The law of causality...
One-week Course on Genetic Analysis and Plant Breeding January 2013, CIMMYT, Mexico LOD Threshold and QTL Detection Power Simulation
 One-week Course on Genetic Analysis and Plant Breeding 21-2 January 213, CIMMYT, Mexico LOD Threshold and QTL Detection Power Simulation Jiankang Wang, CIMMYT China and CAAS E-mail: jkwang@cgiar.org; wangjiankang@caas.cn