Statistical issues in QTL mapping in mice
|
|
|
- Clemence Bradley
- 6 years ago
- Views:
Transcription
1 Statistical issues in QTL mapping in mice Karl W Broman Department of Biostatistics Johns Hopkins University Outline Overview of QTL mapping The X chromosome Mapping multiple QTLs Recombinant inbred lines Heterogeneous stock and 8-way RILs 2 1

2 The intercross 3 The data Phenotypes, y i Genotypes, x ij = AA/AB/BB, at genetic markers A genetic map, giving the locations of the markers. 4 2

3 Goals Identify genomic regions (QTLs) that contribute to variation in the trait. Obtain interval estimates of the QTL locations. Estimate the effects of the QTLs. 5 Phenotypes 133 females (NOD B6) (NOD B6) 6 3

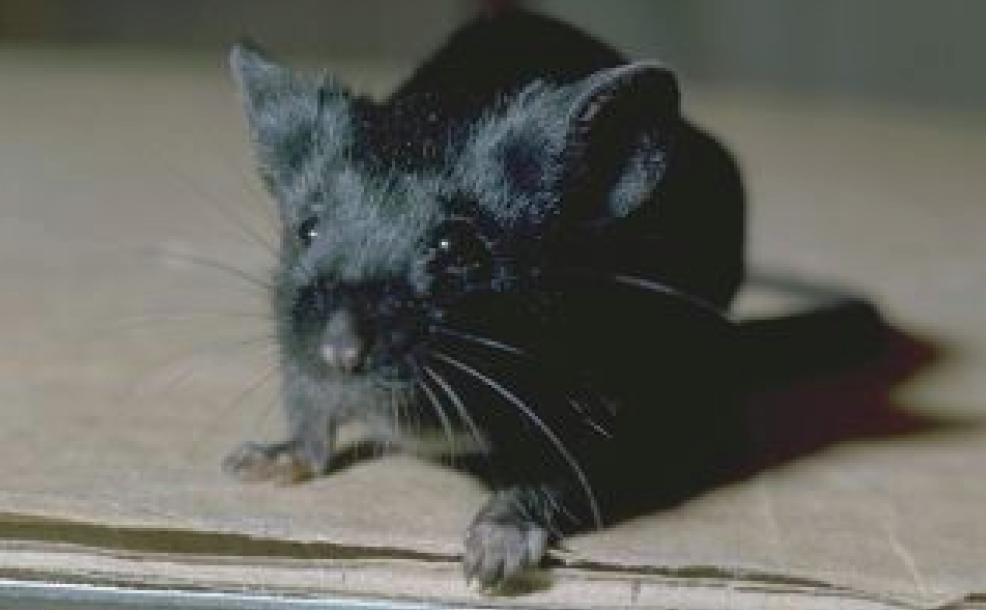
4 NOD 7 C57BL/6 8 4


5 Agouti coat 9 Genetic map 10 5

6 Genotype data 11 Goals Identify genomic regions (QTLs) that contribute to variation in the trait. Obtain interval estimates of the QTL locations. Estimate the effects of the QTLs. 12 6

7 Statistical structure Missing data: markers QTL Model selection: genotypes phenotype 13 Models: recombination No crossover interference Locations of breakpoints according to a Poisson process. Genotypes along chromosome follow a Markov chain. Clearly wrong, but super convenient. 14 7
8 Models: gen phe Phenotype = y, whole-genome genotype = g Imagine that p sites are all that matter. E(y g) = m(g 1,,g p ) SD(y g) = s(g 1,,g p ) Simplifying assumptions: SD(y g) = s, independent of g y g ~ normal( m(g 1,,g p ), s ) m(g 1,,g p ) = m + a j 1{g j = AB} + b j 1{g j = BB} 15 Interval mapping Lander and Botstein 1989 Imagine that there is a single QTL, at position z. Let q i = genotype of mouse i at the QTL, and assume y i q i ~ normal( m(q i ), s ) We won t know q i, but we can calculate p ig = Pr(q i = g marker data) y i, given the marker data, follows a mixture of normal distributions with known mixing proportions (the p ig ). Use an EM algorithm to get MLEs of q = (m AA, m AB, m BB, s). Measure the evidence for a QTL via the LOD score, which is the log 10 likelihood ratio comparing the hypothesis of a single QTL at position z to the hypothesis of no QTL anywhere. 16 8
.")
9 LOD curves 17 LOD thresholds To account for the genome-wide search, compare the observed LOD scores to the distribution of the maximum LOD score, genome-wide, that would be obtained if there were no QTL anywhere. The 95th percentile of this distribution is used as a significance threshold. Such a threshold may be estimated via permutations (Churchill and Doerge 1994). 18 9


10 Permutation test Shuffle the phenotypes relative to the genotypes. Calculate M* = max LOD*, with the shuffled data. Repeat many times. LOD threshold = 95th percentile of M*. P-value = Pr(M* M) 19 Permutation distribution 20 10

11 Chr 9 and Non-normal traits 22 11

12 Non-normal traits Standard interval mapping assumes that the residual variation is normally distributed (and so the phenotype distribution follows a mixture of normal distributions). In reality: we see binary traits, counts, skewed distributions, outliers, and all sorts of odd things. Interval mapping, with LOD thresholds derived via permutation tests, often performs fine anyway. Alternatives to consider: Nonparametric linkage analysis (Kruglyak and Lander 1995). Transformations (e.g., log or square root). Specially-tailored models (e.g., a generalized linear model, the Cox proportional hazards model, the model of Broman 2003). 23 Split by sex 24 12

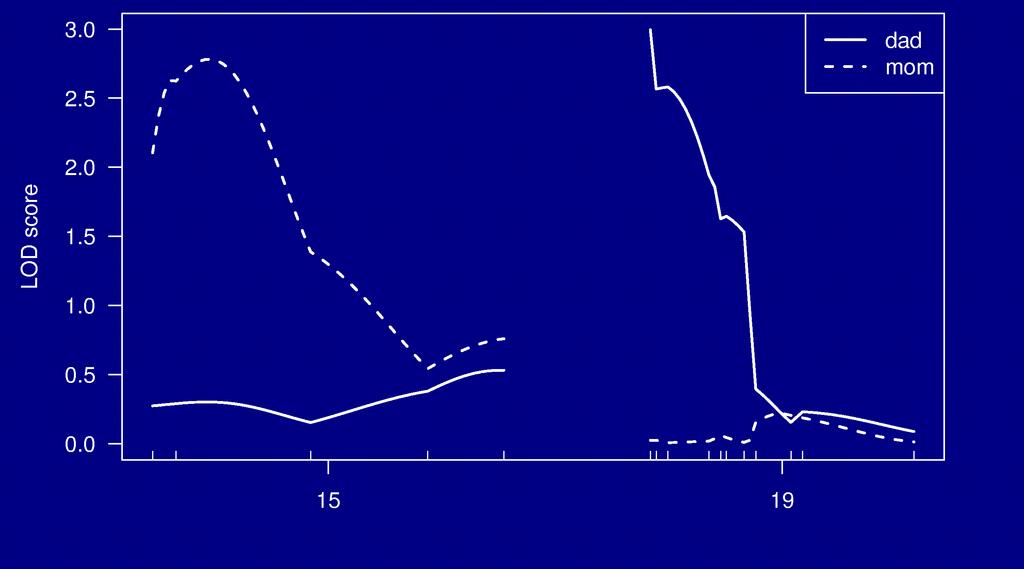
13 Split by sex 25 Split by parent-of-origin 26 13
 (N B) (B N) (B N) 28")
14 Split by parent-of-origin Percent of individuals with phenotype Genotype at D15Mit252 Genotype at D19Mit59 P-O-O AA AB AA AB Dad 63% 54% 75% 43% Mom 57% 23% 38% 40% 27 The X chromosome (N B) (N B) (B N) (B N) 28 14
15 The X chromosome BB BY? NN NY? Different degrees of freedom Autosome NN : NB : BB Females, one direction NN : NB Both sexes, both dir. NY : NN : NB : BB : BY fi Need an X-chr-specific LOD threshold. Null model should include a sex effect. 29 Chr 9 and
.")
16 Epistasis 31 Going after multiple QTLs Greater ability to detect QTLs. Separate linked QTLs. Learn about interactions between QTLs (epistasis)
17 Model selection Choose a class of models. Additive; pairwise interactions; regression trees Fit a model (allow for missing genotype data). Linear regression; ML via EM; Bayes via MCMC Search model space. Forward/backward/stepwise selection; MCMC Compare models. BIC d (g) = log L(g) + (d/2) g log n Miss important loci include extraneous loci. 33 Special features Relationship among the covariates. Missing covariate information. Identify the key players vs. minimize prediction error

18 Opportunities for improvements Each individual is unique. Must genotype each mouse. Unable to obtain multiple invasive phenotypes (e.g., in multiple environmental conditions) on the same genotype. Relatively low mapping precision. Æ Design a set of inbred mouse strains. Genotype once. Study multiple phenotypes on the same genotype. 35 Recombinant inbred lines 36 18


19 AXB/BXA panel 37 AXB/BXA panel 38 19
20 The usual analysis Calculate the phenotype average within each strain. Use these strain averages for QTL mapping as with a backcross (taking account of the map expansion in RILs). Can we do better? With the above data: Ave. no. mice per strain = 15.8 (SD = 8.4) Range of no. mice per strain = A simple model for RILs y si = m + b x s + h s + e si x s = 0 or 1, according to genotype at putative QTL s s 2 h s = strain (polygenic) effect ~ normal(0, ) s e 2 e si = residual environment effect ~ normal(0, ) y s = Â i y si n s var(y s ) = s s 2 +s e 2 n s 40 20
 y s { } Equal n s : The usual analysis is fine. h 2 large: Weight the strains equally. h 2 small: Weight the strains by n s.")
21 RIL analysis If and were known: s s 2 s e 2 Work with the strain averages, Weight by Equivalently, weight by n s n s h 2 + (1- h 2 ) where 1 { s 2 +s 2 e n s } h 2 = s s 2 (s s 2 +s e 2 ) y s { } Equal n s : The usual analysis is fine. h 2 large: Weight the strains equally. h 2 small: Weight the strains by n s. 41 LOD curves 42 21

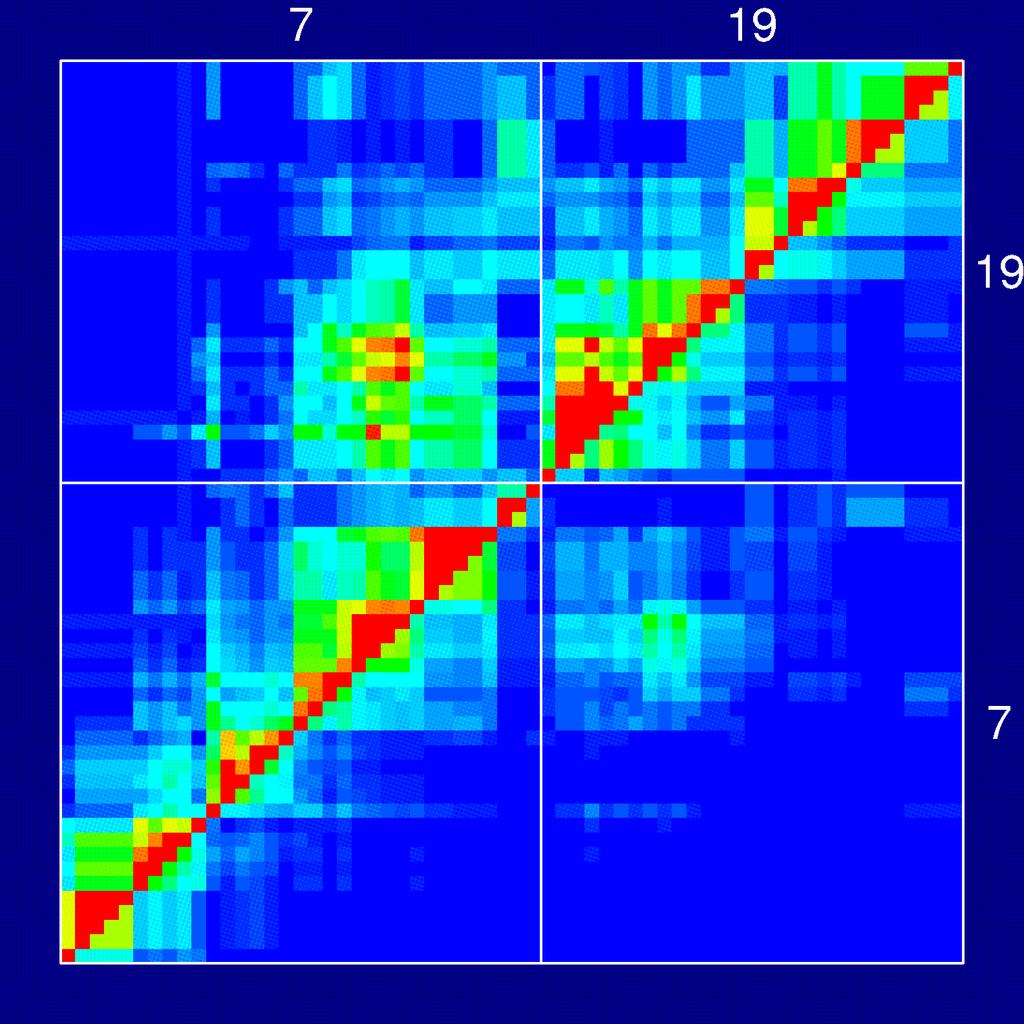
22 Chr 7 and Recombination fractions 44 22
.")
23 Chr 7 and RI lines Advantages Each strain is a eternal resource. Only need to genotype once. Reduce individual variation by phenotyping multiple individuals from each strain. Study multiple phenotypes on the same genotype. Greater mapping precision. Disadvantages Time and expense. Available panels are generally too small (10-30 lines). Can learn only about 2 particular alleles. All individuals homozygous
.")
24 The RIX design 47 Heterogeneous stock McClearn et al. (1970) Mott et al. (2000); Mott and Flint (2002) Start with 8 inbred strains. Randomly breed 40 pairs. Repeat the random breeding of 40 pairs for each of ~60 generations (30 years). The genealogy (and protocol) is not completely known

25 Heterogeneous stock 49 Heterogeneous stock Advantages Disadvantages Great mapping precision. Learn about 8 alleles. Time. Each individual is unique. Need extremely dense markers


26 The Collaborative Cross 51 Genome of an 8-way RI 52 26
27 The Collaborative Cross Advantages Great mapping precision. Eternal resource. Genotype only once. Study multiple invasive phenotypes on the same genotype. Barriers Advantages not widely appreciated. Ask one question at a time, or Ask many questions at once? Time. Expense. Requires large-scale collaboration. 53 To be worked out Breakpoint process along an 8-way RI chromosome. Reconstruction of genotypes given multipoint marker data. Single-QTL analyses. Mixed models, with random effects for strains and genotypes/alleles. Power and precision (relative to an intercross)
28 Haldane & Waddington 1930 r = recombination fraction per meiosis between two loci Autosomes Pr(G 1 =AA) = Pr(G 1 =BB) = 1/2 Pr(G 2 =BB G 1 =AA) = Pr(G 2 =AA G 1 =BB) = 4r / (1+6r) X chromosome Pr(G 1 =AA) = 2/3 Pr(G 1 =BB) = 1/3 Pr(G 2 =BB G 1 =AA) = 2r / (1+4r) Pr(G 2 =AA G 1 =BB) = 4r / (1+4r) Pr(G 2 G 1 ) = (8/3) r / (1+4r) 55 8-way RILs Autosomes Pr(G 1 = i) = 1/8 Pr(G 2 = j G 1 = i) = r / (1+6r) for i j Pr(G 2 G 1 ) = 7r / (1+6r) X chromosome Pr(G 1 =AA) = Pr(G 1 =BB) = Pr(G 1 =EE) = Pr(G 1 =FF) =1/6 Pr(G 1 =CC) = 1/3 Pr(G 2 =AA G 1 =CC) = r / (1+4r) Pr(G 2 =CC G 1 =AA) = 2r / (1+4r) Pr(G 2 =BB G 1 =AA) = r / (1+4r) Pr(G 2 G 1 ) = (14/3) r / (1+4r) 56 28
29 Acknowledgments Terry Speed, Univ. of California, Berkeley and WEHI Tom Brodnicki, WEHI Gary Churchill, The Jackson Laboratory Joe Nadeau, Case Western Reserve Univ
Gene mapping in model organisms
 Gene mapping in model organisms Karl W Broman Department of Biostatistics Johns Hopkins University http://www.biostat.jhsph.edu/~kbroman Goal Identify genes that contribute to common human diseases. 2
Introduction to QTL mapping in model organisms
 Human vs mouse Introduction to QTL mapping in model organisms Karl W Broman Department of Biostatistics Johns Hopkins University www.biostat.jhsph.edu/~kbroman [ Teaching Miscellaneous lectures] www.daviddeen.com
Introduction to QTL mapping in model organisms
 Introduction to QTL mapping in model organisms Karl W Broman Department of Biostatistics Johns Hopkins University kbroman@jhsph.edu www.biostat.jhsph.edu/ kbroman Outline Experiments and data Models ANOVA
Mapping multiple QTL in experimental crosses
 Human vs mouse Mapping multiple QTL in experimental crosses Karl W Broman Department of Biostatistics & Medical Informatics University of Wisconsin Madison www.biostat.wisc.edu/~kbroman www.daviddeen.com
Introduction to QTL mapping in model organisms
 Introduction to QTL mapping in model organisms Karl W Broman Department of Biostatistics Johns Hopkins University kbroman@jhsph.edu www.biostat.jhsph.edu/ kbroman Outline Experiments and data Models ANOVA
The genomes of recombinant inbred lines
 The genomes of recombinant inbred lines Karl W Broman Department of Biostatistics Johns Hopkins University http://www.biostat.jhsph.edu/~kbroman C57BL/6 2 1 Recombinant inbred lines (by sibling mating)
Introduction to QTL mapping in model organisms
 Introduction to QTL mapping in model organisms Karl W Broman Department of Biostatistics and Medical Informatics University of Wisconsin Madison www.biostat.wisc.edu/~kbroman [ Teaching Miscellaneous lectures]
Introduction to QTL mapping in model organisms
 Introduction to QTL mapping in model organisms Karl Broman Biostatistics and Medical Informatics University of Wisconsin Madison kbroman.org github.com/kbroman @kwbroman Backcross P 1 P 2 P 1 F 1 BC 4
Mapping multiple QTL in experimental crosses
 Mapping multiple QTL in experimental crosses Karl W Broman Department of Biostatistics and Medical Informatics University of Wisconsin Madison www.biostat.wisc.edu/~kbroman [ Teaching Miscellaneous lectures]
R/qtl workshop. (part 2) Karl Broman. Biostatistics and Medical Informatics University of Wisconsin Madison. kbroman.org
 Karl Broman. Biostatistics and Medical Informatics University of Wisconsin Madison. kbroman.org") R/qtl workshop (part 2) Karl Broman Biostatistics and Medical Informatics University of Wisconsin Madison kbroman.org github.com/kbroman @kwbroman Example Sugiyama et al. Genomics 71:70-77, 2001 250 male
R/qtl workshop (part 2) Karl Broman Biostatistics and Medical Informatics University of Wisconsin Madison kbroman.org github.com/kbroman @kwbroman Example Sugiyama et al. Genomics 71:70-77, 2001 250 male
Multiple QTL mapping
 Multiple QTL mapping Karl W Broman Department of Biostatistics Johns Hopkins University www.biostat.jhsph.edu/~kbroman [ Teaching Miscellaneous lectures] 1 Why? Reduce residual variation = increased power
Use of hidden Markov models for QTL mapping
 Use of hidden Markov models for QTL mapping Karl W Broman Department of Biostatistics, Johns Hopkins University December 5, 2006 An important aspect of the QTL mapping problem is the treatment of missing
Mapping QTL to a phylogenetic tree
 Mapping QTL to a phylogenetic tree Karl W Broman Department of Biostatistics & Medical Informatics University of Wisconsin Madison www.biostat.wisc.edu/~kbroman Human vs mouse www.daviddeen.com 3 Intercross
Lecture 8. QTL Mapping 1: Overview and Using Inbred Lines
 Lecture 8 QTL Mapping 1: Overview and Using Inbred Lines Bruce Walsh. jbwalsh@u.arizona.edu. University of Arizona. Notes from a short course taught Jan-Feb 2012 at University of Uppsala While the machinery
QTL Mapping I: Overview and using Inbred Lines
 QTL Mapping I: Overview and using Inbred Lines Key idea: Looking for marker-trait associations in collections of relatives If (say) the mean trait value for marker genotype MM is statisically different
Linkage Mapping. Reading: Mather K (1951) The measurement of linkage in heredity. 2nd Ed. John Wiley and Sons, New York. Chapters 5 and 6.
 The measurement of linkage in heredity. 2nd Ed. John Wiley and Sons, New York. Chapters 5 and 6.") Linkage Mapping Reading: Mather K (1951) The measurement of linkage in heredity. 2nd Ed. John Wiley and Sons, New York. Chapters 5 and 6. Genetic maps The relative positions of genes on a chromosome can
Linkage Mapping Reading: Mather K (1951) The measurement of linkage in heredity. 2nd Ed. John Wiley and Sons, New York. Chapters 5 and 6. Genetic maps The relative positions of genes on a chromosome can
Overview. Background
 Overview Implementation of robust methods for locating quantitative trait loci in R Introduction to QTL mapping Andreas Baierl and Andreas Futschik Institute of Statistics and Decision Support Systems
An applied statistician does probability:
 An applied statistician does probability: It s not pretty Karl W Broman Department of Biostatistics & Medical Informatics University of Wisconsin Madison www.biostat.wisc.edu/~kbroman An applied statistician
Affected Sibling Pairs. Biostatistics 666
 Affected Sibling airs Biostatistics 666 Today Discussion of linkage analysis using affected sibling pairs Our exploration will include several components we have seen before: A simple disease model IBD
Tutorial Session 2. MCMC for the analysis of genetic data on pedigrees:
 MCMC for the analysis of genetic data on pedigrees: Tutorial Session 2 Elizabeth Thompson University of Washington Genetic mapping and linkage lod scores Monte Carlo likelihood and likelihood ratio estimation
Prediction of the Confidence Interval of Quantitative Trait Loci Location
 Behavior Genetics, Vol. 34, No. 4, July 2004 ( 2004) Prediction of the Confidence Interval of Quantitative Trait Loci Location Peter M. Visscher 1,3 and Mike E. Goddard 2 Received 4 Sept. 2003 Final 28
Binary trait mapping in experimental crosses with selective genotyping
 Genetics: Published Articles Ahead of Print, published on May 4, 2009 as 10.1534/genetics.108.098913 Binary trait mapping in experimental crosses with selective genotyping Ani Manichaikul,1 and Karl W.
56th Annual EAAP Meeting Uppsala, 2005
 56th Annual EAAP Meeting Uppsala, 2005 G7.5 The Map Expansion Obtained with Recombinant Inbred Strains and Intermated Recombinant Inbred Populations for Finite Generation Designs F. Teuscher *, V. Guiard
QTL Model Search. Brian S. Yandell, UW-Madison January 2017
 QTL Model Search Brian S. Yandell, UW-Madison January 2017 evolution of QTL models original ideas focused on rare & costly markers models & methods refined as technology advanced single marker regression
Lecture 6. QTL Mapping
 Lecture 6 QTL Mapping Bruce Walsh. Aug 2003. Nordic Summer Course MAPPING USING INBRED LINE CROSSES We start by considering crosses between inbred lines. The analysis of such crosses illustrates many of
Methods for QTL analysis
 Methods for QTL analysis Julius van der Werf METHODS FOR QTL ANALYSIS... 44 SINGLE VERSUS MULTIPLE MARKERS... 45 DETERMINING ASSOCIATIONS BETWEEN GENETIC MARKERS AND QTL WITH TWO MARKERS... 45 INTERVAL
Eiji Yamamoto 1,2, Hiroyoshi Iwata 3, Takanari Tanabata 4, Ritsuko Mizobuchi 1, Jun-ichi Yonemaru 1,ToshioYamamoto 1* and Masahiro Yano 5,6
 Yamamoto et al. BMC Genetics 2014, 15:50 METHODOLOGY ARTICLE Open Access Effect of advanced intercrossing on genome structure and on the power to detect linked quantitative trait loci in a multi-parent
Inferring Genetic Architecture of Complex Biological Processes
 Inferring Genetic Architecture of Complex Biological Processes BioPharmaceutical Technology Center Institute (BTCI) Brian S. Yandell University of Wisconsin-Madison http://www.stat.wisc.edu/~yandell/statgen
Lecture 11: Multiple trait models for QTL analysis
 Lecture 11: Multiple trait models for QTL analysis Julius van der Werf Multiple trait mapping of QTL...99 Increased power of QTL detection...99 Testing for linked QTL vs pleiotropic QTL...100 Multiple
Causal Graphical Models in Systems Genetics
 1 Causal Graphical Models in Systems Genetics 2013 Network Analysis Short Course - UCLA Human Genetics Elias Chaibub Neto and Brian S Yandell July 17, 2013 Motivation and basic concepts 2 3 Motivation
MULTIPLE-TRAIT MULTIPLE-INTERVAL MAPPING OF QUANTITATIVE-TRAIT LOCI ROBY JOEHANES
 MULTIPLE-TRAIT MULTIPLE-INTERVAL MAPPING OF QUANTITATIVE-TRAIT LOCI by ROBY JOEHANES B.S., Universitas Pelita Harapan, Indonesia, 1999 M.S., Kansas State University, 2002 A REPORT submitted in partial
Model Selection for Multiple QTL
 Model Selection for Multiple TL 1. reality of multiple TL 3-8. selecting a class of TL models 9-15 3. comparing TL models 16-4 TL model selection criteria issues of detecting epistasis 4. simulations and
Causal Model Selection Hypothesis Tests in Systems Genetics
 1 Causal Model Selection Hypothesis Tests in Systems Genetics Elias Chaibub Neto and Brian S Yandell SISG 2012 July 13, 2012 2 Correlation and Causation The old view of cause and effect... could only fail;
Lecture 9. QTL Mapping 2: Outbred Populations
 Lecture 9 QTL Mapping 2: Outbred Populations Bruce Walsh. Aug 2004. Royal Veterinary and Agricultural University, Denmark The major difference between QTL analysis using inbred-line crosses vs. outbred
Linkage analysis and QTL mapping in autotetraploid species. Christine Hackett Biomathematics and Statistics Scotland Dundee DD2 5DA
 Linkage analysis and QTL mapping in autotetraploid species Christine Hackett Biomathematics and Statistics Scotland Dundee DD2 5DA Collaborators John Bradshaw Zewei Luo Iain Milne Jim McNicol Data and
BAYESIAN MAPPING OF MULTIPLE QUANTITATIVE TRAIT LOCI
 BAYESIAN MAPPING OF MULTIPLE QUANTITATIVE TRAIT LOCI By DÁMARIS SANTANA MORANT A DISSERTATION PRESENTED TO THE GRADUATE SCHOOL OF THE UNIVERSITY OF FLORIDA IN PARTIAL FULFILLMENT OF THE REQUIREMENTS FOR
Calculation of IBD probabilities
 Calculation of IBD probabilities David Evans University of Bristol This Session Identity by Descent (IBD) vs Identity by state (IBS) Why is IBD important? Calculating IBD probabilities Lander-Green Algorithm
QTL model selection: key players
 Bayesian Interval Mapping. Bayesian strategy -9. Markov chain sampling 0-7. sampling genetic architectures 8-5 4. criteria for model selection 6-44 QTL : Bayes Seattle SISG: Yandell 008 QTL model selection:
A Statistical Framework for Expression Trait Loci (ETL) Mapping. Meng Chen
 Mapping. Meng Chen") A Statistical Framework for Expression Trait Loci (ETL) Mapping Meng Chen Prelim Paper in partial fulfillment of the requirements for the Ph.D. program in the Department of Statistics University of Wisconsin-Madison
A Statistical Framework for Expression Trait Loci (ETL) Mapping Meng Chen Prelim Paper in partial fulfillment of the requirements for the Ph.D. program in the Department of Statistics University of Wisconsin-Madison
Solutions to Problem Set 4
 Question 1 Solutions to 7.014 Problem Set 4 Because you have not read much scientific literature, you decide to study the genetics of garden peas. You have two pure breeding pea strains. One that is tall
Calculation of IBD probabilities
 Calculation of IBD probabilities David Evans and Stacey Cherny University of Oxford Wellcome Trust Centre for Human Genetics This Session IBD vs IBS Why is IBD important? Calculating IBD probabilities
The Genomes of Recombinant Inbred Lines: The Gory Details
 Johns Hopkins University, Dept. of Biostatistics Working Papers 8-2-2004 The Genomes of Recombinant Inbred Lines: The Gory Details Karl W. Broman The Johns Hopkins Bloomberg School of Public Health, kbroman@biostat.wisc.edu
Fast Bayesian Methods for Genetic Mapping Applicable for High-Throughput Datasets
 Fast Bayesian Methods for Genetic Mapping Applicable for High-Throughput Datasets Yu-Ling Chang A dissertation submitted to the faculty of the University of North Carolina at Chapel Hill in partial fulfillment
For 5% confidence χ 2 with 1 degree of freedom should exceed 3.841, so there is clear evidence for disequilibrium between S and M.
 STAT 550 Howework 6 Anton Amirov 1. This question relates to the same study you saw in Homework-4, by Dr. Arno Motulsky and coworkers, and published in Thompson et al. (1988; Am.J.Hum.Genet, 42, 113-124).
Genotype Imputation. Biostatistics 666
 Genotype Imputation Biostatistics 666 Previously Hidden Markov Models for Relative Pairs Linkage analysis using affected sibling pairs Estimation of pairwise relationships Identity-by-Descent Relatives
One-week Course on Genetic Analysis and Plant Breeding January 2013, CIMMYT, Mexico LOD Threshold and QTL Detection Power Simulation
 One-week Course on Genetic Analysis and Plant Breeding 21-2 January 213, CIMMYT, Mexico LOD Threshold and QTL Detection Power Simulation Jiankang Wang, CIMMYT China and CAAS E-mail: jkwang@cgiar.org; wangjiankang@caas.cn
Quantitative Genetics. February 16, 2010
 Quantitative Genetics February 16, 2010 A General Model y ij z ij y ij y ij = y i(j) = g j + ε ij 2 1 [zij =j]f ij ( complete likelihood ) j=0 2 ω ij f ij j=0 ( likelihood ) ω i0 = Pr[z ij = j] = q 2 =
Anumber of statistical methods are available for map- 1995) in some standard designs. For backcross populations,
 in some standard designs. For backcross populations,") Copyright 2004 by the Genetics Society of America DOI: 10.1534/genetics.104.031427 An Efficient Resampling Method for Assessing Genome-Wide Statistical Significance in Mapping Quantitative Trait Loci Fei
Copyright 2004 by the Genetics Society of America DOI: 10.1534/genetics.104.031427 An Efficient Resampling Method for Assessing Genome-Wide Statistical Significance in Mapping Quantitative Trait Loci Fei
Homework Assignment, Evolutionary Systems Biology, Spring Homework Part I: Phylogenetics:
 Homework Assignment, Evolutionary Systems Biology, Spring 2009. Homework Part I: Phylogenetics: Introduction. The objective of this assignment is to understand the basics of phylogenetic relationships
Mixture Cure Model with an Application to Interval Mapping of Quantitative Trait Loci
 Mixture Cure Model with an Application to Interval Mapping of Quantitative Trait Loci Abstract. When censored time-to-event data are used to map quantitative trait loci (QTL), the existence of nonsusceptible
Association Testing with Quantitative Traits: Common and Rare Variants. Summer Institute in Statistical Genetics 2014 Module 10 Lecture 5
 Association Testing with Quantitative Traits: Common and Rare Variants Timothy Thornton and Katie Kerr Summer Institute in Statistical Genetics 2014 Module 10 Lecture 5 1 / 41 Introduction to Quantitative
The Admixture Model in Linkage Analysis
 The Admixture Model in Linkage Analysis Jie Peng D. Siegmund Department of Statistics, Stanford University, Stanford, CA 94305 SUMMARY We study an appropriate version of the score statistic to test the
Variance Component Models for Quantitative Traits. Biostatistics 666
 Variance Component Models for Quantitative Traits Biostatistics 666 Today Analysis of quantitative traits Modeling covariance for pairs of individuals estimating heritability Extending the model beyond
The Lander-Green Algorithm. Biostatistics 666 Lecture 22
 The Lander-Green Algorithm Biostatistics 666 Lecture Last Lecture Relationship Inferrence Likelihood of genotype data Adapt calculation to different relationships Siblings Half-Siblings Unrelated individuals
MODEL-FREE LINKAGE AND ASSOCIATION MAPPING OF COMPLEX TRAITS USING QUANTITATIVE ENDOPHENOTYPES
 MODEL-FREE LINKAGE AND ASSOCIATION MAPPING OF COMPLEX TRAITS USING QUANTITATIVE ENDOPHENOTYPES Saurabh Ghosh Human Genetics Unit Indian Statistical Institute, Kolkata Most common diseases are caused by
(Genome-wide) association analysis
 association analysis") (Genome-wide) association analysis 1 Key concepts Mapping QTL by association relies on linkage disequilibrium in the population; LD can be caused by close linkage between a QTL and marker (= good) or by
(Genome-wide) association analysis 1 Key concepts Mapping QTL by association relies on linkage disequilibrium in the population; LD can be caused by close linkage between a QTL and marker (= good) or by
Lecture 2: Genetic Association Testing with Quantitative Traits. Summer Institute in Statistical Genetics 2017
 Lecture 2: Genetic Association Testing with Quantitative Traits Instructors: Timothy Thornton and Michael Wu Summer Institute in Statistical Genetics 2017 1 / 29 Introduction to Quantitative Trait Mapping
DISSECTING the genetic architecture of complex traits is
 MULTIPARENTAL POPULATIONS A General Modeling Framework for Genome Ancestral Origins in Multiparental Populations Chaozhi Zheng, Martin P. Boer, and Fred A. van Eeuwijk Biometris, Wageningen University
theta H H H H H H H H H H H K K K K K K K K K K centimorgans
 Linkage Phase Recall that the recombination fraction ρ for two loci denotes the probability of a recombination event between those two loci. For loci on different chromosomes, ρ = 1=2. For loci on the
Locating multiple interacting quantitative trait. loci using rank-based model selection
 Genetics: Published Articles Ahead of Print, published on May 16, 2007 as 10.1534/genetics.106.068031 Locating multiple interacting quantitative trait loci using rank-based model selection, 1 Ma lgorzata
Module 4: Bayesian Methods Lecture 9 A: Default prior selection. Outline
 Module 4: Bayesian Methods Lecture 9 A: Default prior selection Peter Ho Departments of Statistics and Biostatistics University of Washington Outline Je reys prior Unit information priors Empirical Bayes
Teachers Guide. Overview
 Teachers Guide Overview BioLogica is multilevel courseware for genetics. All the levels are linked so that changes in one level are reflected in all the other levels. The BioLogica activities guide learners
Quantile based Permutation Thresholds for QTL Hotspots. Brian S Yandell and Elias Chaibub Neto 17 March 2012
 Quantile based Permutation Thresholds for QTL Hotspots Brian S Yandell and Elias Chaibub Neto 17 March 2012 2012 Yandell 1 Fisher on inference We may at once admit that any inference from the particular
Quantitative Genomics and Genetics BTRY 4830/6830; PBSB
 Quantitative Genomics and Genetics BTRY 4830/6830; PBSB.5201.01 Lecture16: Population structure and logistic regression I Jason Mezey jgm45@cornell.edu April 11, 2017 (T) 8:40-9:55 Announcements I April
BS 50 Genetics and Genomics Week of Oct 3 Additional Practice Problems for Section. A/a ; B/B ; d/d X A/a ; b/b ; D/d
 BS 50 Genetics and Genomics Week of Oct 3 Additional Practice Problems for Section 1. In the following cross, all genes are on separate chromosomes. A is dominant to a, B is dominant to b and D is dominant
UNIT 8 BIOLOGY: Meiosis and Heredity Page 148
 UNIT 8 BIOLOGY: Meiosis and Heredity Page 148 CP: CHAPTER 6, Sections 1-6; CHAPTER 7, Sections 1-4; HN: CHAPTER 11, Section 1-5 Standard B-4: The student will demonstrate an understanding of the molecular
Quantitative Genetics I: Traits controlled my many loci. Quantitative Genetics: Traits controlled my many loci
 Quantitative Genetics: Traits controlled my many loci So far in our discussions, we have focused on understanding how selection works on a small number of loci (1 or 2). However in many cases, evolutionary
I Have the Power in QTL linkage: single and multilocus analysis
 I Have the Power in QTL linkage: single and multilocus analysis Benjamin Neale 1, Sir Shaun Purcell 2 & Pak Sham 13 1 SGDP, IoP, London, UK 2 Harvard School of Public Health, Cambridge, MA, USA 3 Department
Unit 3 - Molecular Biology & Genetics - Review Packet
 Name Date Hour Unit 3 - Molecular Biology & Genetics - Review Packet True / False Questions - Indicate True or False for the following statements. 1. Eye color, hair color and the shape of your ears can
Principles of QTL Mapping. M.Imtiaz
 Principles of QTL Mapping M.Imtiaz Introduction Definitions of terminology Reasons for QTL mapping Principles of QTL mapping Requirements For QTL Mapping Demonstration with experimental data Merit of QTL
Detection of multiple QTL with epistatic effects under a mixed inheritance model in an outbred population
 Genet. Sel. Evol. 36 (2004) 415 433 415 c INRA, EDP Sciences, 2004 DOI: 10.1051/gse:2004009 Original article Detection of multiple QTL with epistatic effects under a mixed inheritance model in an outbred
Case-Control Association Testing. Case-Control Association Testing
 Introduction Association mapping is now routinely being used to identify loci that are involved with complex traits. Technological advances have made it feasible to perform case-control association studies
Lesson 4: Understanding Genetics
 Lesson 4: Understanding Genetics 1 Terms Alleles Chromosome Co dominance Crossover Deoxyribonucleic acid DNA Dominant Genetic code Genome Genotype Heredity Heritability Heritability estimate Heterozygous
Linear Regression (1/1/17)
") STA613/CBB540: Statistical methods in computational biology Linear Regression (1/1/17) Lecturer: Barbara Engelhardt Scribe: Ethan Hada 1. Linear regression 1.1. Linear regression basics. Linear regression
STA613/CBB540: Statistical methods in computational biology Linear Regression (1/1/17) Lecturer: Barbara Engelhardt Scribe: Ethan Hada 1. Linear regression 1.1. Linear regression basics. Linear regression
Outline. P o purple % x white & white % x purple& F 1 all purple all purple. F purple, 224 white 781 purple, 263 white
 Outline - segregation of alleles in single trait crosses - independent assortment of alleles - using probability to predict outcomes - statistical analysis of hypotheses - conditional probability in multi-generation
Users Manual of QTL IciMapping v3.1
 8 6 4 2 0 0 0 0 0 0 0 0 0 0 0 0 0 Users Manual of QTL IciMapping v3.1 Jiankang Wang, Huihui Li, Luyan Zhang, Chunhui Li and Lei Meng QZ10 QZ9 QZ8 QZ7 QZ6 QZ5 QZ4 QZ3 QZ2 QZ1 L 120 90 60 30 0 120 90 60
The E-M Algorithm in Genetics. Biostatistics 666 Lecture 8
 The E-M Algorithm in Genetics Biostatistics 666 Lecture 8 Maximum Likelihood Estimation of Allele Frequencies Find parameter estimates which make observed data most likely General approach, as long as
Expression QTLs and Mapping of Complex Trait Loci. Paul Schliekelman Statistics Department University of Georgia
 Expression QTLs and Mapping of Complex Trait Loci Paul Schliekelman Statistics Department University of Georgia Definitions: Genes, Loci and Alleles A gene codes for a protein. Proteins due everything.
Chapter 13 Meiosis and Sexual Reproduction
 Biology 110 Sec. 11 J. Greg Doheny Chapter 13 Meiosis and Sexual Reproduction Quiz Questions: 1. What word do you use to describe a chromosome or gene allele that we inherit from our Mother? From our Father?
QTL model selection: key players
 QTL Model Selection. Bayesian strategy. Markov chain sampling 3. sampling genetic architectures 4. criteria for model selection Model Selection Seattle SISG: Yandell 0 QTL model selection: key players
Meiosis. ~ fragmentation - pieces split off and each piece becomes a new organism - starfish
 ** We are starting with section 3 because in order to understand Genetics, we must first understand how the cells and chromosomes divide to form the gametes! Meiosis 5 3 Just know the ones that are highlighted!
Inferring Causal Phenotype Networks from Segregating Populat
 Inferring Causal Phenotype Networks from Segregating Populations Elias Chaibub Neto chaibub@stat.wisc.edu Statistics Department, University of Wisconsin - Madison July 15, 2008 Overview Introduction Description
Users Guide for New BC s F t Tools for R/qtl
 Users Guide for New C s F t Tools for R/qtl Laura M. Shannon rian S. Yandell Karl roman 9 January 13 Introduction Historically QTL mapping studies have employed a variety of crossing schemes including:
2. Map genetic distance between markers
 Chapter 5. Linkage Analysis Linkage is an important tool for the mapping of genetic loci and a method for mapping disease loci. With the availability of numerous DNA markers throughout the human genome,
Quantitative characters II: heritability
 Quantitative characters II: heritability The variance of a trait (x) is the average squared deviation of x from its mean: V P = (1/n)Σ(x-m x ) 2 This total phenotypic variance can be partitioned into components:
On the mapping of quantitative trait loci at marker and non-marker locations
 Genet. Res., Camb. (2002), 79, pp. 97 106. With 3 figures. 2002 Cambridge University Press DOI: 10.1017 S0016672301005420 Printed in the United Kingdom 97 On the mapping of quantitative trait loci at marker
THE problem of identifying the genetic factors un- QTL models because of their ability to separate linked
 Copyright 2001 by the Genetics Society of America A Statistical Framework for Quantitative Trait Mapping Śaunak Sen and Gary A. Churchill The Jackson Laboratory, Bar Harbor, Maine 04609 Manuscript received
Chapter 11 INTRODUCTION TO GENETICS
 Chapter 11 INTRODUCTION TO GENETICS 11-1 The Work of Gregor Mendel I. Gregor Mendel A. Studied pea plants 1. Reproduce sexually (have two sex cells = gametes) 2. Uniting of male and female gametes = Fertilization
Statistical Genetics I: STAT/BIOST 550 Spring Quarter, 2014
 Overview - 1 Statistical Genetics I: STAT/BIOST 550 Spring Quarter, 2014 Elizabeth Thompson University of Washington Seattle, WA, USA MWF 8:30-9:20; THO 211 Web page: www.stat.washington.edu/ thompson/stat550/
InGen: Dino Genetics Lab Post-Lab Activity: DNA and Genetics
 InGen: Dino Genetics Lab Post-Lab Activity: DNA and Genetics This activity is meant to extend your students knowledge of the topics covered in our DNA and Genetics lab. Through this activity, pairs of
Meiosis and Mendel. Chapter 6
 Meiosis and Mendel Chapter 6 6.1 CHROMOSOMES AND MEIOSIS Key Concept Gametes have half the number of chromosomes that body cells have. Body Cells vs. Gametes You have body cells and gametes body cells
MANY agriculturally and biomedically important
 Copyright Ó 007 by the Genetics Society of America DOI: 10.1534/genetics.106.059808 Mapping Temporally Varying Quantitative Trait Loci in Time-to-Failure Experiments Frank Johannes 1 Center for Developmental
1 Springer. Nan M. Laird Christoph Lange. The Fundamentals of Modern Statistical Genetics
 1 Springer Nan M. Laird Christoph Lange The Fundamentals of Modern Statistical Genetics 1 Introduction to Statistical Genetics and Background in Molecular Genetics 0 0 1 0 0 0 0 0 0 0 0 0 0 0 0 0 0 0 0
Lecture 5: BLUP (Best Linear Unbiased Predictors) of genetic values. Bruce Walsh lecture notes Tucson Winter Institute 9-11 Jan 2013
 of genetic values. Bruce Walsh lecture notes Tucson Winter Institute 9-11 Jan 2013") Lecture 5: BLUP (Best Linear Unbiased Predictors) of genetic values Bruce Walsh lecture notes Tucson Winter Institute 9-11 Jan 013 1 Estimation of Var(A) and Breeding Values in General Pedigrees The classic
Lecture 5: BLUP (Best Linear Unbiased Predictors) of genetic values Bruce Walsh lecture notes Tucson Winter Institute 9-11 Jan 013 1 Estimation of Var(A) and Breeding Values in General Pedigrees The classic
Solutions to Even-Numbered Exercises to accompany An Introduction to Population Genetics: Theory and Applications Rasmus Nielsen Montgomery Slatkin
 Solutions to Even-Numbered Exercises to accompany An Introduction to Population Genetics: Theory and Applications Rasmus Nielsen Montgomery Slatkin CHAPTER 1 1.2 The expected homozygosity, given allele
EXERCISES FOR CHAPTER 3. Exercise 3.2. Why is the random mating theorem so important?
 Statistical Genetics Agronomy 65 W. E. Nyquist March 004 EXERCISES FOR CHAPTER 3 Exercise 3.. a. Define random mating. b. Discuss what random mating as defined in (a) above means in a single infinite population
arxiv: v4 [stat.me] 2 May 2015
![arxiv: v4 [stat.me] 2 May 2015](/thumbs/85/92388341.jpg "arxiv: v4 [stat.me] 2 May 2015") Submitted to the Annals of Statistics arxiv: arxiv:0000.0000 BAYESIAN NONPARAMETRIC TESTS VIA SLICED INVERSE MODELING By Bo Jiang, Chao Ye and Jun S. Liu Harvard University, Tsinghua University and Harvard
Submitted to the Annals of Statistics arxiv: arxiv:0000.0000 BAYESIAN NONPARAMETRIC TESTS VIA SLICED INVERSE MODELING By Bo Jiang, Chao Ye and Jun S. Liu Harvard University, Tsinghua University and Harvard
QTL mapping of Poisson traits: a simulation study
 AO Ribeiro et al. Crop Breeding and Applied Biotechnology 5:310-317, 2005 Brazilian Society of Plant Breeding. Printed in Brazil QTL mapping of Poisson traits: a simulation study Alex de Oliveira Ribeiro
. Also, in this case, p i = N1 ) T, (2) where. I γ C N(N 2 2 F + N1 2 Q)
 T, (2) where. I γ C N(N 2 2 F + N1 2 Q)") Supplementary information S7 Testing for association at imputed SPs puted SPs Score tests A Score Test needs calculations of the observed data score and information matrix only under the null hypothesis,
Supplementary information S7 Testing for association at imputed SPs puted SPs Score tests A Score Test needs calculations of the observed data score and information matrix only under the null hypothesis,
Modeling IBD for Pairs of Relatives. Biostatistics 666 Lecture 17
 Modeling IBD for Pairs of Relatives Biostatistics 666 Lecture 7 Previously Linkage Analysis of Relative Pairs IBS Methods Compare observed and expected sharing IBD Methods Account for frequency of shared