Calculation of IBD probabilities
|
|
|
- Ethan Robinson
- 5 years ago
- Views:
Transcription


1 Calculation of IBD probabilities David Evans University of Bristol
2 This Session Identity by Descent (IBD) vs Identity by state (IBS) Why is IBD important? Calculating IBD probabilities Lander-Green Algorithm (MERLIN) Single locus probabilities Hidden Markov Model > Multipoint IBD Other ways of calculating IBD status Elston-Stewart Algorithm MCMC approaches MERLIN Practical Example IBD determination Information content mapping SNPs vs micro-satellite markers?
3 Identity By Descent (IBD) Identical by Descent Identical by state only Two alleles are IBD if they are descended from the same ancestral allele
4 Example: IBD in Siblings Consider a mating between mother AB x father CD: Sib 2 Sib AC AD BC BD AC 2 0 AD 2 0 BC 0 2 BD 0 2 IBD 0 : : 2 25% : 50% : 25%
5 Why is IBD Sharing Important? 3/4 /2 3/4 /3 2/4 /4 4/4 Affected relatives not only share disease alleles IBD, but also tend to share marker alleles close to the disease locus IBD more often than chance 4/4 /4 IBD sharing forms the basis of nonparametric linkage statistics
6 Crossing over between homologous chromosomes
7 Cosegregation > Linkage A Q Parental genotype A Q Non-recombinant Parental genotypes (many, θ) A 2 Q 2 A Q 2 A 2 Q 2 Recombinant genotypes (few, θ) A 2 Q Alleles close together on the same chromosome tend to stay together in meiosis; therefore they tend be co-transmitted.
8 Segregating Chromosomes MARKER DISEASE GENE
9 Marker Shared Among Affecteds /2 3/4 3/4 /3 2/4 /4 4/4 4/4 /4 Genotypes for a marker with alleles {,2,3,4}
10 Linkage between QTL and marker QTL Marker IBD 0 IBD IBD 2
11 NO Linkage between QTL and marker Marker
12 IBD can be trivial / 2 / 2 IBD0 / 2 / 2
13 Two Other Simple Cases / 2 / 2 / 2 / 2 IBD2 / / 2 2 / 2 2 /
14 A little more complicated / 2 2 / 2 IBD (50% chance) / 2 / 2 IBD2 (50% chance)
15 And even more complicated IBD? / /
16 Bayes Theorem for IBD Probabilities j0,,2 j IBD G P j IBD P i IBD G P i IBD P G P i IBD G P i IBD P G P G i G i IBD P ) ( ) ( ) ( ) ( ) ( ) ( ) ( ) ( ), P(IBD ) (
17 P(Genotype IBD State) Sib Sib 2 P(observing genotypes k alleles IBD) k0 k k2 A A A A p 4 p 3 p 2 A A A A 2 2p 3 p 2 p 2 p 2 0 A A A 2 A 2 p 2 p A A 2 A A 2p 3 p 2 p 2 p 2 0 A A 2 A A 2 4p 2 p 2 2 p p 2 2p p 2 A A 2 A 2 A 2 2p p 3 2 p p A 2 A 2 A A p 2 p A 2 A 2 A A 2 2p p 3 2 p p A 2 A 2 A 2 A 2 p 4 2 p 3 2 p 2 2
18 Worked Example p 0.5 P( G IBD 0) P( G IBD ) P( G IBD 2) P( G) P( IBD 0 G) / P( IBD G) / P( IBD 2 G)
19 Worked Example / / 9 4 ) ( 4 ) 2 ( 9 4 ) ( 2 ) ( 9 ) ( 4 ) 0 ( ) ( 4 2) ( 8 ) ( 6 0) ( G P p G IBD P G P p G IBD P G P p G IBD P p p p G P p IBD G P p IBD G P p IBD G P p
20 For ANY PEDIGREE the inheritance pattern at any point in the genome can be completely described by a binary inheritance vector of length 2n: v(x) (p, m, p 2, m 2,,p n,m n ) whose coordinates describe the outcome of the paternal and maternal meioses giving rise to the n non-founders in the pedigree p i (m i ) is 0 if the grandpaternal allele transmitted p i (m i ) is if the grandmaternal allele is transmitted a / b c / d v(x) [0,0,,] a / c b / d
21 Inheritance Vector In practice, it is not possible to determine the true inheritance vector at every point in the genome, rather we represent partial information as a probability distribution of the possible inheritance vectors a b 2 a c p m p 2 3 a b 5 a c 4 m 2 b b Inheritance vector Prior Posterior /6 /8 000 /6 /8 000 / / /6 /8 00 /6 /8 00 /6 0 0 / /6 /8 00 /6 /8 00 /6 0 0 / /6 /8 0 /6 /8 0 /6 0 /6 0
22 Computer Representation At each marker location l Define inheritance vector v l Meiotic outcomes specified in index bit Likelihood for each gene flow pattern Conditional on observed genotypes at location l 2 2n elements!!! L L L L L L L L L L L L L L L L
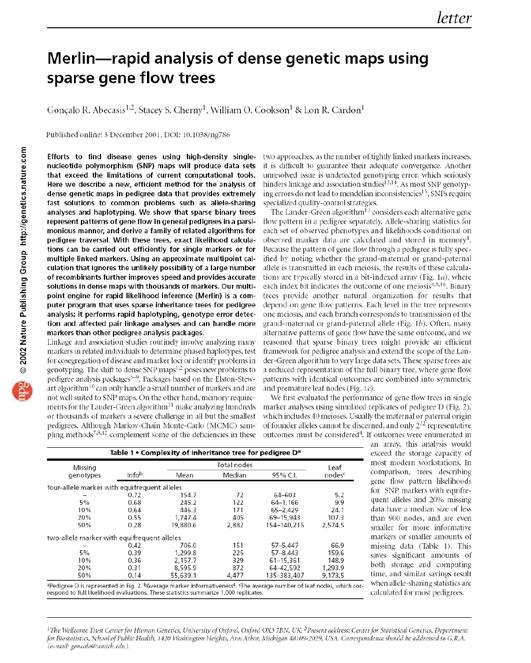
23 a) bit-indexed array L L 2 L L 2 L L 2 L L 2 b) packed tree L L 2 L L 2 L L 2 L L 2 c) sparse tree Legend Node with zero likelihood Node identical to sibling L L 2 L L 2 Likelihood for this branch Abecasis et al (2002) Nat Genet 30:97-0
24 Multipoint IBD IBD status may not be able to be ascertained with certainty because e.g. the mating is not informative, parental information is not available IBD information at uninformative loci can be made more precise by examining nearby linked loci
25 Multipoint IBD a / b / c / d 2 / IBD 0 a / c b / d / / 2 IBD 0 or IBD?
26 Complexity of the Problem in Larger Pedigrees For each person 2n meioses in pedigree with n non-founders Each meiosis has 2 possible outcomes Therefore 2 2n possibilities for each locus For each genetic locus One location for each of m genetic markers Distinct, non-independent meiotic outcomes Up to 4 nm distinct outcomes!!!
27 Example: Sib-pair Genotyped at 0 Markers Inheritance vector P(G 0000) ( θ) m 0 Marker (2 2xn ) m (2 2 x 2 ) 0 ~ 0 2 possible paths!!!
28 P(IBD) 2 at Marker Three IBD Inheritance vector (2) () () (2) m 0 Marker (L[0000] + L[00] + L[00] + L[] ) / L[ALL]
29 P(IBD) 2 at arbitrary position on the chromosome Inheritance vector m 0 Marker (L[0000] + L[00] + L[00] + L[] ) / L[ALL]
30 Lander-Green Algorithm The inheritance vector at a locus is conditionally independent of the inheritance vectors at all preceding loci given the inheritance vector at the immediately preceding locus ( Hidden Markov chain )
31 Lander-Green Algorithm Inheritance vector m 0 Marker M(2 2n ) 2 0 x calculations
32 Lander-Green Algorithm Summary Factorize likelihood by marker Complexity m e n Strengths Large number of markers Relatively small pedigrees
33 Elston-Stewart Algorithm Factorize likelihood by individual Complexity n e m Small number of markers Large pedigrees With little inbreeding VITESSE, FASTLINK etc
34 Other methods Number of MCMC methods proposed ~Linear on # markers ~Linear on # people Hard to guarantee convergence on very large datasets Many widely separated local minima E.g. SIMWALK

35 MERLIN-- Multipoint Engine for Rapid Likelihood Inference
36 Capabilities Linkage Analysis NPL and K&C LOD Variance Components Haplotypes Most likely Sampling All IBD and info content Error Detection Most SNP typing errors are Mendelian consistent Recombination No. of recombinants per family per interval can be controlled Simulation
37 MERLIN Website Reference FAQ Source Tutorial Linkage Haplotyping Simulation Error detection IBD calculation Binaries
38 Input Files Pedigree File Relationships Genotype data Phenotype data Data File Describes contents of pedigree file Map File Records location of genetic markers
39 Example Pedigree File <contents of example.ped> 0 0 x 3 3 x x x 4 4 x x x 2 x x x 4 3 x x <end of example.ped> Encodes family relationships, marker and phenotype information
40 Data File Field Codes Code M A T C Z S[n] Description Marker Genotype Affection Status. Quantitative Trait. Covariate. Zygosity. Skip n columns.
41 Example Data File <contents of example.dat> T some_trait_of_interest M some_marker M another_marker <end of example.dat> Provides information necessary to decode pedigree file
42 Example Map File <contents of example.map> CHROMOSOME MARKER POSITION 2 D2S D2S <end of example.map> Indicates location of individual markers, necessary to derive recombination fractions between them
43 Worked Example p 0.5 P( IBD 0 G) P( IBD G) P( IBD 2 G) / / merlin d example.dat p example.ped m example.map --ibd
44 Application: Information Content Mapping Information content: Provides a measure of how well a marker set approaches the goal of completely determining the inheritance outcome Based on concept of entropy E -ΣP i log 2 P i where P i is probability of the ith outcome I E (x) E(x)/E 0 Always lies between 0 and Does not depend on test for linkage Scales linearly with power
45 Application: Information Content Mapping Simulations ABI ( micro-satellite per 0cM) decode ( microsatellite per 3cM) Illumina ( SNP per 0.5cM) Affymetrix ( SNP per 0.2 cm) Which panel performs best in terms of extracting marker information? merlin d file.dat p file.ped m file.map --information
46 SNPs vs Microsatellites Information Content Densities SNP microsat 0.2 cm 3 cm 0.5 cm 0 cm Position (cm) SNPs + parents microsat + parents
Calculation of IBD probabilities
 Calculation of IBD probabilities David Evans and Stacey Cherny University of Oxford Wellcome Trust Centre for Human Genetics This Session IBD vs IBS Why is IBD important? Calculating IBD probabilities
The Lander-Green Algorithm. Biostatistics 666 Lecture 22
 The Lander-Green Algorithm Biostatistics 666 Lecture Last Lecture Relationship Inferrence Likelihood of genotype data Adapt calculation to different relationships Siblings Half-Siblings Unrelated individuals
Genotype Imputation. Biostatistics 666
 Genotype Imputation Biostatistics 666 Previously Hidden Markov Models for Relative Pairs Linkage analysis using affected sibling pairs Estimation of pairwise relationships Identity-by-Descent Relatives
Affected Sibling Pairs. Biostatistics 666
 Affected Sibling airs Biostatistics 666 Today Discussion of linkage analysis using affected sibling pairs Our exploration will include several components we have seen before: A simple disease model IBD
Tutorial Session 2. MCMC for the analysis of genetic data on pedigrees:
 MCMC for the analysis of genetic data on pedigrees: Tutorial Session 2 Elizabeth Thompson University of Washington Genetic mapping and linkage lod scores Monte Carlo likelihood and likelihood ratio estimation
MCMC IN THE ANALYSIS OF GENETIC DATA ON PEDIGREES
 MCMC IN THE ANALYSIS OF GENETIC DATA ON PEDIGREES Elizabeth A. Thompson Department of Statistics, University of Washington Box 354322, Seattle, WA 98195-4322, USA Email: thompson@stat.washington.edu This
Lecture 9. QTL Mapping 2: Outbred Populations
 Lecture 9 QTL Mapping 2: Outbred Populations Bruce Walsh. Aug 2004. Royal Veterinary and Agricultural University, Denmark The major difference between QTL analysis using inbred-line crosses vs. outbred
The Quantitative TDT
 The Quantitative TDT (Quantitative Transmission Disequilibrium Test) Warren J. Ewens NUS, Singapore 10 June, 2009 The initial aim of the (QUALITATIVE) TDT was to test for linkage between a marker locus
2. Map genetic distance between markers
 Chapter 5. Linkage Analysis Linkage is an important tool for the mapping of genetic loci and a method for mapping disease loci. With the availability of numerous DNA markers throughout the human genome,
For 5% confidence χ 2 with 1 degree of freedom should exceed 3.841, so there is clear evidence for disequilibrium between S and M.
 STAT 550 Howework 6 Anton Amirov 1. This question relates to the same study you saw in Homework-4, by Dr. Arno Motulsky and coworkers, and published in Thompson et al. (1988; Am.J.Hum.Genet, 42, 113-124).
Gene mapping, linkage analysis and computational challenges. Konstantin Strauch
 Gene mapping, linkage analysis an computational challenges Konstantin Strauch Institute for Meical Biometry, Informatics, an Epiemiology (IMBIE) University of Bonn E-mail: strauch@uni-bonn.e Genetics an
The universal validity of the possible triangle constraint for Affected-Sib-Pairs
 The Canadian Journal of Statistics Vol. 31, No.?, 2003, Pages???-??? La revue canadienne de statistique The universal validity of the possible triangle constraint for Affected-Sib-Pairs Zeny Z. Feng, Jiahua
1 Springer. Nan M. Laird Christoph Lange. The Fundamentals of Modern Statistical Genetics
 1 Springer Nan M. Laird Christoph Lange The Fundamentals of Modern Statistical Genetics 1 Introduction to Statistical Genetics and Background in Molecular Genetics 0 0 1 0 0 0 0 0 0 0 0 0 0 0 0 0 0 0 0
UNIT 8 BIOLOGY: Meiosis and Heredity Page 148
 UNIT 8 BIOLOGY: Meiosis and Heredity Page 148 CP: CHAPTER 6, Sections 1-6; CHAPTER 7, Sections 1-4; HN: CHAPTER 11, Section 1-5 Standard B-4: The student will demonstrate an understanding of the molecular
AFFECTED RELATIVE PAIR LINKAGE STATISTICS THAT MODEL RELATIONSHIP UNCERTAINTY
 AFFECTED RELATIVE PAIR LINKAGE STATISTICS THAT MODEL RELATIONSHIP UNCERTAINTY by Amrita Ray BSc, Presidency College, Calcutta, India, 2001 MStat, Indian Statistical Institute, Calcutta, India, 2003 Submitted
Inference on pedigree structure from genome screen data. Running title: Inference on pedigree structure. Mary Sara McPeek. The University of Chicago
 1 Inference on pedigree structure from genome screen data Running title: Inference on pedigree structure Mary Sara McPeek The University of Chicago Address for correspondence: Department of Statistics,
Breeding Values and Inbreeding. Breeding Values and Inbreeding
 Breeding Values and Inbreeding Genotypic Values For the bi-allelic single locus case, we previously defined the mean genotypic (or equivalently the mean phenotypic values) to be a if genotype is A 2 A
p(d g A,g B )p(g B ), g B
p(g B ), g B") Supplementary Note Marginal effects for two-locus models Here we derive the marginal effect size of the three models given in Figure 1 of the main text. For each model we assume the two loci (A and B)
Supplementary Note Marginal effects for two-locus models Here we derive the marginal effect size of the three models given in Figure 1 of the main text. For each model we assume the two loci (A and B)
The genomes of recombinant inbred lines
 The genomes of recombinant inbred lines Karl W Broman Department of Biostatistics Johns Hopkins University http://www.biostat.jhsph.edu/~kbroman C57BL/6 2 1 Recombinant inbred lines (by sibling mating)
Prediction of the Confidence Interval of Quantitative Trait Loci Location
 Behavior Genetics, Vol. 34, No. 4, July 2004 ( 2004) Prediction of the Confidence Interval of Quantitative Trait Loci Location Peter M. Visscher 1,3 and Mike E. Goddard 2 Received 4 Sept. 2003 Final 28
Natural Selection. Population Dynamics. The Origins of Genetic Variation. The Origins of Genetic Variation. Intergenerational Mutation Rate
 Natural Selection Population Dynamics Humans, Sickle-cell Disease, and Malaria How does a population of humans become resistant to malaria? Overproduction Environmental pressure/competition Pre-existing
Lecture 2: Genetic Association Testing with Quantitative Traits. Summer Institute in Statistical Genetics 2017
 Lecture 2: Genetic Association Testing with Quantitative Traits Instructors: Timothy Thornton and Michael Wu Summer Institute in Statistical Genetics 2017 1 / 29 Introduction to Quantitative Trait Mapping
Variance Component Models for Quantitative Traits. Biostatistics 666
 Variance Component Models for Quantitative Traits Biostatistics 666 Today Analysis of quantitative traits Modeling covariance for pairs of individuals estimating heritability Extending the model beyond
Resemblance between relatives
 Resemblance between relatives 1 Key concepts Model phenotypes by fixed effects and random effects including genetic value (additive, dominance, epistatic) Model covariance of genetic effects by relationship
MEIOSIS, THE BASIS OF SEXUAL REPRODUCTION
 MEIOSIS, THE BASIS OF SEXUAL REPRODUCTION Why do kids look different from the parents? How are they similar to their parents? Why aren t brothers or sisters more alike? Meiosis A process where the number
Lecture WS Evolutionary Genetics Part I 1
 Quantitative genetics Quantitative genetics is the study of the inheritance of quantitative/continuous phenotypic traits, like human height and body size, grain colour in winter wheat or beak depth in
Identification of Pedigree Relationship from Genome Sharing
 INVESTIGATION Identification of Pedigree Relationship from Genome Sharing William G. Hill 1 and Ian M. S. White Institute of Evolutionary Biology, School of Biological Sciences, University of Edinburgh,
Gene mapping in model organisms
 Gene mapping in model organisms Karl W Broman Department of Biostatistics Johns Hopkins University http://www.biostat.jhsph.edu/~kbroman Goal Identify genes that contribute to common human diseases. 2
Analytic power calculation for QTL linkage analysis of small pedigrees
 (2001) 9, 335 ± 340 ã 2001 Nature Publishing Group All rights reserved 1018-4813/01 $15.00 www.nature.com/ejhg ARTICLE for QTL linkage analysis of small pedigrees FruÈhling V Rijsdijk*,1, John K Hewitt
Objectives. Announcements. Comparison of mitosis and meiosis
 Announcements Colloquium sessions for which you can get credit posted on web site: Feb 20, 27 Mar 6, 13, 20 Apr 17, 24 May 15. Review study CD that came with text for lab this week (especially mitosis
genome a specific characteristic that varies from one individual to another gene the passing of traits from one generation to the next
 genetics the study of heredity heredity sequence of DNA that codes for a protein and thus determines a trait genome a specific characteristic that varies from one individual to another gene trait the passing
Mathematical models in population genetics II
 Mathematical models in population genetics II Anand Bhaskar Evolutionary Biology and Theory of Computing Bootcamp January 1, 014 Quick recap Large discrete-time randomly mating Wright-Fisher population
Statistical issues in QTL mapping in mice
 Statistical issues in QTL mapping in mice Karl W Broman Department of Biostatistics Johns Hopkins University http://www.biostat.jhsph.edu/~kbroman Outline Overview of QTL mapping The X chromosome Mapping
Chapter 6 Linkage Disequilibrium & Gene Mapping (Recombination)
") 12/5/14 Chapter 6 Linkage Disequilibrium & Gene Mapping (Recombination) Linkage Disequilibrium Genealogical Interpretation of LD Association Mapping 1 Linkage and Recombination v linkage equilibrium ²
12/5/14 Chapter 6 Linkage Disequilibrium & Gene Mapping (Recombination) Linkage Disequilibrium Genealogical Interpretation of LD Association Mapping 1 Linkage and Recombination v linkage equilibrium ²
GBLUP and G matrices 1
 GBLUP and G matrices 1 GBLUP from SNP-BLUP We have defined breeding values as sum of SNP effects:! = #$ To refer breeding values to an average value of 0, we adopt the centered coding for genotypes described
Lecture 6. QTL Mapping
 Lecture 6 QTL Mapping Bruce Walsh. Aug 2003. Nordic Summer Course MAPPING USING INBRED LINE CROSSES We start by considering crosses between inbred lines. The analysis of such crosses illustrates many of
Life Cycles, Meiosis and Genetic Variability24/02/2015 2:26 PM
 Life Cycles, Meiosis and Genetic Variability iclicker: 1. A chromosome just before mitosis contains two double stranded DNA molecules. 2. This replicated chromosome contains DNA from only one of your parents
Computational Approaches to Statistical Genetics
 Computational Approaches to Statistical Genetics GWAS I: Concepts and Probability Theory Christoph Lippert Dr. Oliver Stegle Prof. Dr. Karsten Borgwardt Max-Planck-Institutes Tübingen, Germany Tübingen
Evaluating the Performance of a Block Updating McMC Sampler in a Simple Genetic Application
 Evaluating the Performance of a Block Updating McMC Sampler in a Simple Genetic Application N.A. SHEEHAN B. GULDBRANDTSEN 1 D.A. SORENSEN 1 1 Markov chain Monte Carlo (McMC) methods have provided an enormous
I Have the Power in QTL linkage: single and multilocus analysis
 I Have the Power in QTL linkage: single and multilocus analysis Benjamin Neale 1, Sir Shaun Purcell 2 & Pak Sham 13 1 SGDP, IoP, London, UK 2 Harvard School of Public Health, Cambridge, MA, USA 3 Department
Complexity and Approximation of the Minimum Recombination Haplotype Configuration Problem
 Complexity and Approximation of the Minimum Recombination Haplotype Configuration Problem Lan Liu 1, Xi Chen 3, Jing Xiao 3, and Tao Jiang 1,2 1 Department of Computer Science and Engineering, University
SOLUTIONS TO EXERCISES FOR CHAPTER 9
 SOLUTIONS TO EXERCISES FOR CHPTER 9 gronomy 65 Statistical Genetics W. E. Nyquist March 00 Exercise 9.. a. lgebraic method for the grandparent-grandoffspring covariance (see parent-offspring covariance,
SNP Association Studies with Case-Parent Trios
 SNP Association Studies with Case-Parent Trios Department of Biostatistics Johns Hopkins Bloomberg School of Public Health September 3, 2009 Population-based Association Studies Balding (2006). Nature
TOPICS IN STATISTICAL METHODS FOR HUMAN GENE MAPPING
 TOPICS IN STATISTICAL METHODS FOR HUMAN GENE MAPPING by Chia-Ling Kuo MS, Biostatstics, National Taiwan University, Taipei, Taiwan, 003 BBA, Statistics, National Chengchi University, Taipei, Taiwan, 001
Solutions to Problem Set 4
 Question 1 Solutions to 7.014 Problem Set 4 Because you have not read much scientific literature, you decide to study the genetics of garden peas. You have two pure breeding pea strains. One that is tall
Introduction to population genetics & evolution
 Introduction to population genetics & evolution Course Organization Exam dates: Feb 19 March 1st Has everybody registered? Did you get the email with the exam schedule Summer seminar: Hot topics in Bioinformatics
Lecture 11: Multiple trait models for QTL analysis
 Lecture 11: Multiple trait models for QTL analysis Julius van der Werf Multiple trait mapping of QTL...99 Increased power of QTL detection...99 Testing for linked QTL vs pleiotropic QTL...100 Multiple
THEORETICAL ASPECTS OF PEDIGREE ANALYSIS
 THEORETICAL ASPECTS OF PEDIGREE ANALYSIS E. Ginsburg, I. Malkin, R.C. Elston THEORETICAL ASPECTS OF PEDIGREE ANALYSIS RAMOT PUBLISHING HOUSE TEL-AVIV UNIVERSITY, ISRAEL E. Ginsburg, I. Malkin, R.C. Elston
The E-M Algorithm in Genetics. Biostatistics 666 Lecture 8
 The E-M Algorithm in Genetics Biostatistics 666 Lecture 8 Maximum Likelihood Estimation of Allele Frequencies Find parameter estimates which make observed data most likely General approach, as long as
Linkage and Linkage Disequilibrium
 Linkage and Linkage Disequilibrium Summer Institute in Statistical Genetics 2014 Module 10 Topic 3 Linkage in a simple genetic cross Linkage In the early 1900 s Bateson and Punnet conducted genetic studies
Resultants in genetic linkage analysis
 Journal of Symbolic Computation 41 (2006) 125 137 www.elsevier.com/locate/jsc Resultants in genetic linkage analysis Ingileif B. Hallgrímsdóttir a,, Bernd Sturmfels b a Department of Statistics, University
Unit 6 Reading Guide: PART I Biology Part I Due: Monday/Tuesday, February 5 th /6 th
 Name: Date: Block: Chapter 6 Meiosis and Mendel Section 6.1 Chromosomes and Meiosis 1. How do gametes differ from somatic cells? Unit 6 Reading Guide: PART I Biology Part I Due: Monday/Tuesday, February
Homework Assignment, Evolutionary Systems Biology, Spring Homework Part I: Phylogenetics:
 Homework Assignment, Evolutionary Systems Biology, Spring 2009. Homework Part I: Phylogenetics: Introduction. The objective of this assignment is to understand the basics of phylogenetic relationships
Dropping Your Genes. A Simulation of Meiosis and Fertilization and An Introduction to Probability
 Dropping Your Genes A Simulation of Meiosis and Fertilization and An Introduction to To fully understand Mendelian genetics (and, eventually, population genetics), you need to understand certain aspects
F1 Parent Cell R R. Name Period. Concept 15.1 Mendelian inheritance has its physical basis in the behavior of chromosomes
 Name Period Concept 15.1 Mendelian inheritance has its physical basis in the behavior of chromosomes 1. What is the chromosome theory of inheritance? 2. Explain the law of segregation. Use two different
Population Genetics. with implications for Linkage Disequilibrium. Chiara Sabatti, Human Genetics 6357a Gonda
 1 Population Genetics with implications for Linkage Disequilibrium Chiara Sabatti, Human Genetics 6357a Gonda csabatti@mednet.ucla.edu 2 Hardy-Weinberg Hypotheses: infinite populations; no inbreeding;
Lesson 4: Understanding Genetics
 Lesson 4: Understanding Genetics 1 Terms Alleles Chromosome Co dominance Crossover Deoxyribonucleic acid DNA Dominant Genetic code Genome Genotype Heredity Heritability Heritability estimate Heterozygous
(Genome-wide) association analysis
 association analysis") (Genome-wide) association analysis 1 Key concepts Mapping QTL by association relies on linkage disequilibrium in the population; LD can be caused by close linkage between a QTL and marker (= good) or by
(Genome-wide) association analysis 1 Key concepts Mapping QTL by association relies on linkage disequilibrium in the population; LD can be caused by close linkage between a QTL and marker (= good) or by
Genetics (patterns of inheritance)
") MENDELIAN GENETICS branch of biology that studies how genetic characteristics are inherited MENDELIAN GENETICS Gregory Mendel, an Augustinian monk (1822-1884), was the first who systematically studied
MENDELIAN GENETICS branch of biology that studies how genetic characteristics are inherited MENDELIAN GENETICS Gregory Mendel, an Augustinian monk (1822-1884), was the first who systematically studied
MODEL-FREE LINKAGE AND ASSOCIATION MAPPING OF COMPLEX TRAITS USING QUANTITATIVE ENDOPHENOTYPES
 MODEL-FREE LINKAGE AND ASSOCIATION MAPPING OF COMPLEX TRAITS USING QUANTITATIVE ENDOPHENOTYPES Saurabh Ghosh Human Genetics Unit Indian Statistical Institute, Kolkata Most common diseases are caused by
Association Testing with Quantitative Traits: Common and Rare Variants. Summer Institute in Statistical Genetics 2014 Module 10 Lecture 5
 Association Testing with Quantitative Traits: Common and Rare Variants Timothy Thornton and Katie Kerr Summer Institute in Statistical Genetics 2014 Module 10 Lecture 5 1 / 41 Introduction to Quantitative
Notes on Population Genetics
 Notes on Population Genetics Graham Coop 1 1 Department of Evolution and Ecology & Center for Population Biology, University of California, Davis. To whom correspondence should be addressed: gmcoop@ucdavis.edu
Outline. P o purple % x white & white % x purple& F 1 all purple all purple. F purple, 224 white 781 purple, 263 white
 Outline - segregation of alleles in single trait crosses - independent assortment of alleles - using probability to predict outcomes - statistical analysis of hypotheses - conditional probability in multi-generation
Methods for QTL analysis
 Methods for QTL analysis Julius van der Werf METHODS FOR QTL ANALYSIS... 44 SINGLE VERSUS MULTIPLE MARKERS... 45 DETERMINING ASSOCIATIONS BETWEEN GENETIC MARKERS AND QTL WITH TWO MARKERS... 45 INTERVAL
Constructing a Pedigree
 Constructing a Pedigree Use the appropriate symbols: Unaffected Male Unaffected Female Affected Male Affected Female Male carrier of trait Mating of Offspring 2. Label each generation down the left hand
Use of hidden Markov models for QTL mapping
 Use of hidden Markov models for QTL mapping Karl W Broman Department of Biostatistics, Johns Hopkins University December 5, 2006 An important aspect of the QTL mapping problem is the treatment of missing
Optimal Allele-Sharing Statistics for Genetic Mapping Using Affected Relatives
 Genetic Epidemiology 16:225 249 (1999) Optimal Allele-Sharing Statistics for Genetic Mapping Using Affected Relatives Mary Sara McPeek* Department of Statistics, University of Chicago, Chicago, Illinois
Introduction to Genetics
 Introduction to Genetics We ve all heard of it, but What is genetics? Genetics: the study of gene structure and action and the patterns of inheritance of traits from parent to offspring. Ancient ideas
Methods for Cryptic Structure. Methods for Cryptic Structure
 Case-Control Association Testing Review Consider testing for association between a disease and a genetic marker Idea is to look for an association by comparing allele/genotype frequencies between the cases
Q Expected Coverage Achievement Merit Excellence. Punnett square completed with correct gametes and F2.
 NCEA Level 2 Biology (91157) 2018 page 1 of 6 Assessment Schedule 2018 Biology: Demonstrate understanding of genetic variation and change (91157) Evidence Q Expected Coverage Achievement Merit Excellence
Quantitative Genetics & Evolutionary Genetics
 Quantitative Genetics & Evolutionary Genetics (CHAPTER 24 & 26- Brooker Text) May 14, 2007 BIO 184 Dr. Tom Peavy Quantitative genetics (the study of traits that can be described numerically) is important
Concept 15.1 Mendelian inheritance has its physical basis in the behavior of chromosomes
 r Chapter 15: The Chromosomal Basis of Inheritance Name Period Chapter 15: The Chromosomal Basis of Inheritance Concept 15.1 Mendelian inheritance has its physical basis in the behavior of chromosomes
On Computation of P-values in Parametric Linkage Analysis
 On Computation of P-values in Parametric Linkage Analysis Azra Kurbašić Centre for Mathematical Sciences Mathematical Statistics Lund University p.1/22 Parametric (v. Nonparametric) Analysis The genetic
Modeling IBD for Pairs of Relatives. Biostatistics 666 Lecture 17
 Modeling IBD for Pairs of Relatives Biostatistics 666 Lecture 7 Previously Linkage Analysis of Relative Pairs IBS Methods Compare observed and expected sharing IBD Methods Account for frequency of shared
Quantitative Genetics
 Bruce Walsh, University of Arizona, Tucson, Arizona, USA Almost any trait that can be defined shows variation, both within and between populations. Quantitative genetics is concerned with the analysis
MIXED MODELS THE GENERAL MIXED MODEL
 MIXED MODELS This chapter introduces best linear unbiased prediction (BLUP), a general method for predicting random effects, while Chapter 27 is concerned with the estimation of variances by restricted
QTL mapping under ascertainment
 QTL mapping under ascertainment J. PENG Department of Statistics, University of California, Davis, CA 95616 D. SIEGMUND Department of Statistics, Stanford University, Stanford, CA 94305 February 15, 2006
Computation of Multilocus Prior Probability of Autozygosity for Complex Inbred Pedigrees
 Genetic Epidemiology 14:1 15 (1997) Computation of Multilocus Prior Probability of Autozygosity for Complex Inbred Pedigrees Sun-Wei Guo* Department of Biostatistics, University of Michigan, Ann Arbor
Introduction to Genetics
 Introduction to Genetics We ve all heard of it, but What is genetics? Genetics: the study of gene structure and action and the patterns of inheritance of traits from parent to offspring. Ancient ideas
Covariance between relatives
 UNIVERSIDADE DE SÃO PAULO ESCOLA SUPERIOR DE AGRICULTURA LUIZ DE QUEIROZ DEPARTAMENTO DE GENÉTICA LGN5825 Genética e Melhoramento de Espécies Alógamas Covariance between relatives Prof. Roberto Fritsche-Neto
Univariate Linkage in Mx. Boulder, TC 18, March 2005 Posthuma, Maes, Neale
 Univariate Linkage in Mx Boulder, TC 18, March 2005 Posthuma, Maes, Neale VC analysis of Linkage Incorporating IBD Coefficients Covariance might differ according to sharing at a particular locus. Sharing
Linkage analysis and QTL mapping in autotetraploid species. Christine Hackett Biomathematics and Statistics Scotland Dundee DD2 5DA
 Linkage analysis and QTL mapping in autotetraploid species Christine Hackett Biomathematics and Statistics Scotland Dundee DD2 5DA Collaborators John Bradshaw Zewei Luo Iain Milne Jim McNicol Data and
A mixed model based QTL / AM analysis of interactions (G by G, G by E, G by treatment) for plant breeding
 for plant breeding") Professur Pflanzenzüchtung Professur Pflanzenzüchtung A mixed model based QTL / AM analysis of interactions (G by G, G by E, G by treatment) for plant breeding Jens Léon 4. November 2014, Oulu Workshop
Professur Pflanzenzüchtung Professur Pflanzenzüchtung A mixed model based QTL / AM analysis of interactions (G by G, G by E, G by treatment) for plant breeding Jens Léon 4. November 2014, Oulu Workshop
Introduc)on to Gene)cs How to Analyze Your Own Genome Fall 2013
on to Gene)cs How to Analyze Your Own Genome Fall 2013") Introduc)on to Gene)cs 02-223 How to Analyze Your Own Genome Fall 2013 Overview Primer on gene
Introduc)on to Gene)cs 02-223 How to Analyze Your Own Genome Fall 2013 Overview Primer on gene
Meiosis vs Mitosis. How many times did it go through prophase-metaphase-anaphase-telophase?
 Meiosis vs Mitosis Mitosis produces identical copies of cells for growth or repair. Meiosis produces egg cells or sperm cells. Look at the diagram of meiosis: What happened during prophase I? How many
MOLECULAR MAPS AND MARKERS FOR DIPLOID ROSES
 MOLECULAR MAPS AND MARKERS FOR DIPLOID ROSES Patricia E Klein, Mandy Yan, Ellen Young, Jeekin Lau, Stella Kang, Natalie Patterson, Natalie Anderson and David Byrne Department of Horticultural Sciences,
Mapping quantitative trait loci in oligogenic models
 Biostatistics (2001), 2, 2,pp. 147 162 Printed in Great Britain Mapping quantitative trait loci in oligogenic models HSIU-KHUERN TANG, D. SIEGMUND Department of Statistics, 390 Serra Mall, Sequoia Hall,
Genetic Association Studies in the Presence of Population Structure and Admixture
 Genetic Association Studies in the Presence of Population Structure and Admixture Purushottam W. Laud and Nicholas M. Pajewski Division of Biostatistics Department of Population Health Medical College
Proportional Variance Explained by QLT and Statistical Power. Proportional Variance Explained by QTL and Statistical Power
 Proportional Variance Explained by QTL and Statistical Power Partitioning the Genetic Variance We previously focused on obtaining variance components of a quantitative trait to determine the proportion
Introduction to QTL mapping in model organisms
 Introduction to QTL mapping in model organisms Karl W Broman Department of Biostatistics Johns Hopkins University kbroman@jhsph.edu www.biostat.jhsph.edu/ kbroman Outline Experiments and data Models ANOVA
Lander-Green Algorithm. Biostatistics 666
 Lander-Green Algorith Biostatistics 666 Identity-by-Descent (IBD) A roerty o chroosoe stretches that descend ro the sae ancestor Two alleles are IBD i they descend ro the sae ounder chroosoe For a air
Biol. 303 EXAM I 9/22/08 Name
 Biol. 303 EXAM I 9/22/08 Name -------------------------------------------------------------------------------------------------------------- This exam consists of 40 multiple choice questions worth 2.5
Parts 2. Modeling chromosome segregation
 Genome 371, Autumn 2017 Quiz Section 2 Meiosis Goals: To increase your familiarity with the molecular control of meiosis, outcomes of meiosis, and the important role of crossing over in generating genetic
BIOLOGY LTF DIAGNOSTIC TEST MEIOSIS & MENDELIAN GENETICS
 016064 BIOLOGY LTF DIAGNOSTIC TEST MEIOSIS & MENDELIAN GENETICS TEST CODE: 016064 Directions: Each of the questions or incomplete statements below is followed by five suggested answers or completions.
Bayesian Inference of Interactions and Associations
 Bayesian Inference of Interactions and Associations Jun Liu Department of Statistics Harvard University http://www.fas.harvard.edu/~junliu Based on collaborations with Yu Zhang, Jing Zhang, Yuan Yuan,
CSci 8980: Advanced Topics in Graphical Models Analysis of Genetic Variation
 CSci 8980: Advanced Topics in Graphical Models Analysis of Genetic Variation Instructor: Arindam Banerjee November 26, 2007 Genetic Polymorphism Single nucleotide polymorphism (SNP) Genetic Polymorphism
Guided Notes Unit 6: Classical Genetics
 Name: Date: Block: Chapter 6: Meiosis and Mendel I. Concept 6.1: Chromosomes and Meiosis Guided Notes Unit 6: Classical Genetics a. Meiosis: i. (In animals, meiosis occurs in the sex organs the testes
Lecture 3: Probability
 Lecture 3: Probability 28th of October 2015 Lecture 3: Probability 28th of October 2015 1 / 36 Summary of previous lecture Define chance experiment, sample space and event Introduce the concept of the
Heredity and Genetics WKSH
 Chapter 6, Section 3 Heredity and Genetics WKSH KEY CONCEPT Mendel s research showed that traits are inherited as discrete units. Vocabulary trait purebred law of segregation genetics cross MAIN IDEA:
Causal Graphical Models in Systems Genetics
 1 Causal Graphical Models in Systems Genetics 2013 Network Analysis Short Course - UCLA Human Genetics Elias Chaibub Neto and Brian S Yandell July 17, 2013 Motivation and basic concepts 2 3 Motivation