A mixed model based QTL / AM analysis of interactions (G by G, G by E, G by treatment) for plant breeding
|
|
|
- Gerard Skinner
- 6 years ago
- Views:
Transcription
1 Professur Pflanzenzüchtung Professur Pflanzenzüchtung A mixed model based QTL / AM analysis of interactions (G by G, G by E, G by treatment) for plant breeding Jens Léon 4. November 2014, Oulu Workshop Animal models with applications in ecology
2 Professur Pflanzenzüchtung QTL and Association Mapping Goal: genomic locations (map positions) and effects (or variance) of genes underlying quantitative trait variation QTL mapping Using linkage information on a set of known relatives Association mapping Using very fine scale LD to map genes in a set of random individuals from a population
3 Professur Pflanzenzüchtung Outline Introduction on Mixed linear modeling for QTL mapping Case studies on multi parent (NAM, MAGIC) populations Haplotypes, epistatic effects experiment with salt stress tolerance QTL by treatment interaction
4 Professur Pflanzenzüchtung Single Marker analysis (Mixed modeling) QTL mapping methods Interval Mapping (IM) Composite interval mapping (CIM) Same results as Single Marker Analysis With dense marker maps
5 Professur Pflanzenzüchtung Plant Breeding Testing identical genotypes/line/clones using specific experimental designs (replicated Block-, α-design etc.) Often more than one treatment (eg. Control vs. Stress) QTL by treatment interaction (fixed factor) Often in several environments QTL by environment interaction (random factor) Multiple alleles or haplotypes
6 Professur Pflanzenzüchtung Macro Mixed linear model for QTL detection in plant Breeding (SAS 9.2) Y ijk = μ + QTL + T l + B(T l ) + M i + M i * T l + L k (M i ) + ε ijk Y ijk = μ + QTL + M i + M j + M i * M j + L k (M i * M j ) + ε ijk As flexible as the statistical software is Advantages treatment/environment information (fixed or random factor) multi-locus analysis (forward/backward selection) cross validation permutation whole genome marker*marker or treatment by marker interaction shrinkage multi-trait analysis 6
 Kinship of entries is equal, no population structure pedigree unknown Many meioses (>10 4 ) Power: 10-5 Morgan (kbase) Kinship not equal between entries, population")
7 Pedigree Analysis & Association Mapping Professur Pflanzenzüchtung Pedigree Analysis: Association Mapping: Pedigree known Low number of Meioses (below or near 100) Power: cmorgan (MBase) Kinship of entries is equal, no population structure pedigree unknown Many meioses (>10 4 ) Power: 10-5 Morgan (kbase) Kinship not equal between entries, population structure
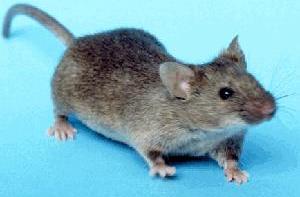
8 Professur Pflanzenzüchtung Association Mapping Q matrix to include the structure into an analysis Identifying several groups in which the members are in Hardy Weinberg equilibrium
9 Professur Pflanzenzüchtung Association Mapping Q matrix to include the structure into an analysis Kinship matrix to include possible genetic relationships between entries in a population Both can be easily included in SAS software
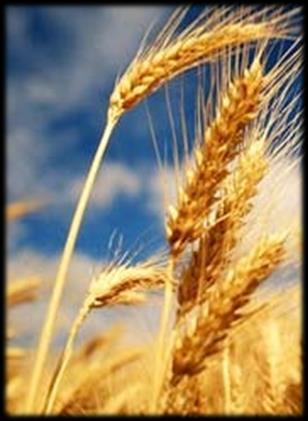
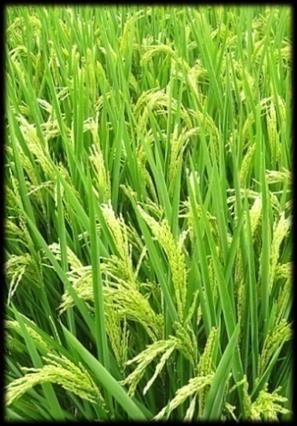
10 Professur Pflanzenzüchtung Case studies Wheat Oilseed rape barley

11 Evolution of hexaploid wheat Professur Pflanzenzüchtung Low agronomic characteristics High genetic diversity Disease resistance Abiotic stress tolerance Fully crossable with modern bread wheat (Lillemo, 2010) 12
12 Development of the synthetic backcrossed population Professur Pflanzenzüchtung Syn86 X Zentos Parents Zentos: F 1 X Zentos German elite winter wheat cultivar Syn86: BC 1 F 1 X Zentos Synthetic hexaploid wheat BC 2 F 1 Z86-population 150 lines BC 2 F 3 2 x selfing 3 x bulk propagation BC 2 F


13 Phenotyping for salt stress tolerance Professur Pflanzenzüchtung Studying effect of salt stress at 3 development stages of wheat: Germination stage Germination test on filter paper (NaCl/Na 2 SO 4) Seedling stage Hydroponics (NaCl/ Na 2 SO 4 ) Maturity stage Field trials in 4 countries in Asia with natural salinization: Uzbekistan, Turkmenistan, Kazakhstan and China Nonsaline Saline 14
14 Genotypic characterization Professur Pflanzenzüchtung Genotyping of testing populations by Illumina GoldenGate 90k SNP-chip at TraitGenetics (Germany) Population Bi-parental population Association panel Population size Kinship Polymorphic markers Average SNP Density 150 related cm 150 unrelated cm 15
15 QTL analysis for Shoot Fresh Weight Professur Pflanzenzüchtung
16 Professur Pflanzenzüchtung Shrinking approach in QTL region Nearby marker should give an similar signature than the QTL itself Walsh lecture on QTL
17 Professur Pflanzenzüchtung Shrinkage of marker effects Algorithm including cross validation and conditional analysis Important for further identification of regions of candidate genes Identification of covariables Epistatic effects or epistatic variance components as all epistatic effects have a trace in additive or dominance genetic variance (V A and V D ) Genomic selection procedures
18 Conditional analysis for Shoot FW Professur Pflanzenzüchtung
19 Professur Pflanzenzüchtung Interaction Gene by Gene Gene by environment Gene by treatment Example: Salt stress tolerance Analyzing each treatment separately Building a Stress index and analyse the index Marker by salt stress interaction
20 Gene by Treatment interaction (Shoot FW) Professur Pflanzenzüchtung
21 Gene by Treatment interaction (Shoot FW) Round 1 Professur Pflanzenzüchtung
22 Gene by Treatment interaction (Shoot FW) Round 2 Professur Pflanzenzüchtung
23 Gene by Treatment interaction (Shoot FW) Round 3 Professur Pflanzenzüchtung
24 QTL analysis and detection of candidate genes Professur Pflanzenzüchtung Gene by Treatment interaction (Shoot FW) R2: 18.7% R2: 9.1% R2: 15.9% 25


25 Professur Chair Pflanzenzüchtung of Plant Breeding Mapping population Association panel Collaborative Cross 2004 MAGIC population Barley Bi-parental population 26
26 recurrent parent Genotype 1 Genotype 2 Genotype 3 Genotype 4 Genotype 5 Genotype 6 Genotype 7 Genotype 8 Genotype 9 Genotype 10 Genotype 11 Genotype 12 Genotype 13 Genotype 14 Genotype 15 Genotype 16 Genotype 17 Genotype 18 Genotype 19 Genotype 20 Genotype 21 BnNAM-DH Pre-BreedYield parents X BnNam DHs 50 DH-Lines per cross 27

27 Erucic acid Pre-BreedYield 28
28 Introduction Material & Methods Results & Discussion Professur Chair Pflanzenzüchtung of Plant Breeding MAGIC-Population in barley Ack. Bavaria Barke Heils Franken Heines Hanna Pflugs Intensiv Ragusa Ack. Danubia Criewener 403 G 0 x x x x A B C D E F G H G 1 x x AB CD EF GH G 2 ABCD x EFGH G 3 x G 4 ABCDEFGH G 5 Doubled Haploid (DH) based on Cavanagh et al

29 Introduction Material & Methods Results & Discussion Professur Chair Pflanzenzüchtung of Plant Breeding Experimental approach 533 MAGIC DH lines Marker data 9k iselect SNP chip Phenotypic data Flowering time QTL Analysis Estimation of epistatic effects 30
30 Introduction Material & Methods Results & Discussion Professur Chair Pflanzenzüchtung of Plant Breeding Genetic approach Marker data (A/C/G/T) Matrix (0/1) Genetic map (R/mpMap) Haplotype approach Chromosome Position Marker Parent 1 DH 1 DH 2 DH 3 DH 4 DH 5 DH 6 DH 7 DH 8 DH 9 DH 10 1H 10.5 SNP H 11.7 SNP H 13.1 SNP H 14.1 SNP H 14.9 SNP H 16.4 SNP H 17.3 SNP H 20.1 SNP H 21.0 SNP H 21.9 SNP H 22.8 SNP
31 Introduction Material & Methods Results & Discussion Professur Chair Pflanzenzüchtung of Plant Breeding Genotypic characterization of MAGIC population Results r² 5117 SNP marker Chromosome 1H-7H cm position in cm (barley consensus map from Comadran et al. 2012) 32
32 Introduction Material & Methods Results & Discussion Professur Chair Pflanzenzüchtung of Plant Breeding Ten epistatic effects determined by haplotype approach Flowering time Epistatic effect SNP 1 SNP 2 position a position a -log 10 (p) AB/ AB/ AB/ B/ HF/ HF/ HH/ HH/ HH/ R/ R/ AD/ AD/ AD/ AB HF AD R HH R HF R AD HH R B HF R Diff Epi-HA-1 5H H NA NA NA NA NA 11.8 Epi-HA-2 2H H NA NA Epi-HA-3 3H H Epi-HA-4 2H H NA Epi-HA-5 1H H NA Epi-HA-6 3H H NA NA 12.5 Epi-HA-7 5H H NA 59.9 NA NA NA NA NA 9.4 Epi-HA-8 5H H NA NA NA 61.2 NA NA NA 53.3 NA NA 73.3 NA NA NA 20.0 Epi-HA-9 3H H NA NA NA NA Epi-HA-10 2H H NA NA NA NA NA 59.9 NA NA NA NA NA

33 Professur Pflanzenzüchtung Epistatic effects haplotype approach flowering time Trevaskis et al., 2007 multi-locus analysis (forward/backward selection) 34

34 Macro for Marker/Trait association Professur Pflanzenzüchtung SAS University Edition (free access). Testing population Phenotypic characterization Genotypic characterization Trait Marker/Trait association Marker QTL detection Validation of cand. genes Breeding process SAS macro (Léon, 2014) 35
35 Professur Pflanzenzüchtung Acknowledgements Data from W. Sannemann Tobias Kox Said Dashani Benedict Oyiga Agim Ballvora
Principles of QTL Mapping. M.Imtiaz
 Principles of QTL Mapping M.Imtiaz Introduction Definitions of terminology Reasons for QTL mapping Principles of QTL mapping Requirements For QTL Mapping Demonstration with experimental data Merit of QTL
1 Springer. Nan M. Laird Christoph Lange. The Fundamentals of Modern Statistical Genetics
 1 Springer Nan M. Laird Christoph Lange The Fundamentals of Modern Statistical Genetics 1 Introduction to Statistical Genetics and Background in Molecular Genetics 0 0 1 0 0 0 0 0 0 0 0 0 0 0 0 0 0 0 0
TASK 6.3 Modelling and data analysis support
 Wheat and barley Legacy for Breeding Improvement TASK 6.3 Modelling and data analysis support FP7 European Project Task 6.3: How can statistical models contribute to pre-breeding? Daniela Bustos-Korts
Lecture WS Evolutionary Genetics Part I 1
 Quantitative genetics Quantitative genetics is the study of the inheritance of quantitative/continuous phenotypic traits, like human height and body size, grain colour in winter wheat or beak depth in
Calculation of IBD probabilities
 Calculation of IBD probabilities David Evans University of Bristol This Session Identity by Descent (IBD) vs Identity by state (IBS) Why is IBD important? Calculating IBD probabilities Lander-Green Algorithm
How to connect to CGIAR wheat (CIMMYT and ICARDA) CRP??- Public wheat breeding for developing world
 CRP??- Public wheat breeding for developing world") Wheat breeding only exploits 10% of the diversity available The public sector can t breed elite varieties-how to connect to private sector breeders?? How to connect to CGIAR wheat (CIMMYT and ICARDA) CRP??-
Wheat breeding only exploits 10% of the diversity available The public sector can t breed elite varieties-how to connect to private sector breeders?? How to connect to CGIAR wheat (CIMMYT and ICARDA) CRP??-
Lecture 5: BLUP (Best Linear Unbiased Predictors) of genetic values. Bruce Walsh lecture notes Tucson Winter Institute 9-11 Jan 2013
 of genetic values. Bruce Walsh lecture notes Tucson Winter Institute 9-11 Jan 2013") Lecture 5: BLUP (Best Linear Unbiased Predictors) of genetic values Bruce Walsh lecture notes Tucson Winter Institute 9-11 Jan 013 1 Estimation of Var(A) and Breeding Values in General Pedigrees The classic
Lecture 5: BLUP (Best Linear Unbiased Predictors) of genetic values Bruce Walsh lecture notes Tucson Winter Institute 9-11 Jan 013 1 Estimation of Var(A) and Breeding Values in General Pedigrees The classic
Calculation of IBD probabilities
 Calculation of IBD probabilities David Evans and Stacey Cherny University of Oxford Wellcome Trust Centre for Human Genetics This Session IBD vs IBS Why is IBD important? Calculating IBD probabilities
Wheat Genetics and Molecular Genetics: Past and Future. Graham Moore
 Wheat Genetics and Molecular Genetics: Past and Future Graham Moore 1960s onwards Wheat traits genetically dissected Chromosome pairing and exchange (Ph1) Height (Rht) Vernalisation (Vrn1) Photoperiodism
Genotype Imputation. Biostatistics 666
 Genotype Imputation Biostatistics 666 Previously Hidden Markov Models for Relative Pairs Linkage analysis using affected sibling pairs Estimation of pairwise relationships Identity-by-Descent Relatives
Evolution of phenotypic traits
 Quantitative genetics Evolution of phenotypic traits Very few phenotypic traits are controlled by one locus, as in our previous discussion of genetics and evolution Quantitative genetics considers characters
Eiji Yamamoto 1,2, Hiroyoshi Iwata 3, Takanari Tanabata 4, Ritsuko Mizobuchi 1, Jun-ichi Yonemaru 1,ToshioYamamoto 1* and Masahiro Yano 5,6
 Yamamoto et al. BMC Genetics 2014, 15:50 METHODOLOGY ARTICLE Open Access Effect of advanced intercrossing on genome structure and on the power to detect linked quantitative trait loci in a multi-parent
Breeding Values and Inbreeding. Breeding Values and Inbreeding
 Breeding Values and Inbreeding Genotypic Values For the bi-allelic single locus case, we previously defined the mean genotypic (or equivalently the mean phenotypic values) to be a if genotype is A 2 A
Managing segregating populations
 Managing segregating populations Aim of the module At the end of the module, we should be able to: Apply the general principles of managing segregating populations generated from parental crossing; Describe
Mapping QTL for Seedling Root Traits in Common Wheat
 2005,38(10):1951-1957 Scientia Agricultura Sinica 1,2,3 1 1 1 2 1 / / 100081 2 050021 3 100039 DH 10 14 11 15 5A 4B 2D 6D 7D 3 2 3 3 2 2 2 3 2 1 3 1 3 DH Mapping for Seedling Root Traits in Common Wheat
Germplasm. Introduction to Plant Breeding. Germplasm 2/12/2013. Master Gardener Training. Start with a seed
 Introduction to Plant Breeding Master Gardener Training Start with a seed Germplasm Germplasm The greatest service which can be rendered to any country is to add a useful plant to its culture -Thomas Jefferson
Introduction to Plant Breeding. Master Gardener Training
 Introduction to Plant Breeding Master Gardener Training Start with a seed Germplasm Germplasm The greatest service which can be rendered to any country is to add a useful plant to its culture -Thomas Jefferson
Lecture 28: BLUP and Genomic Selection. Bruce Walsh lecture notes Synbreed course version 11 July 2013
 Lecture 28: BLUP and Genomic Selection Bruce Walsh lecture notes Synbreed course version 11 July 2013 1 BLUP Selection The idea behind BLUP selection is very straightforward: An appropriate mixed-model
Lecture 9. QTL Mapping 2: Outbred Populations
 Lecture 9 QTL Mapping 2: Outbred Populations Bruce Walsh. Aug 2004. Royal Veterinary and Agricultural University, Denmark The major difference between QTL analysis using inbred-line crosses vs. outbred
GENETICS - CLUTCH CH.1 INTRODUCTION TO GENETICS.
 !! www.clutchprep.com CONCEPT: HISTORY OF GENETICS The earliest use of genetics was through of plants and animals (8000-1000 B.C.) Selective breeding (artificial selection) is the process of breeding organisms
Chapter 6 Linkage Disequilibrium & Gene Mapping (Recombination)
") 12/5/14 Chapter 6 Linkage Disequilibrium & Gene Mapping (Recombination) Linkage Disequilibrium Genealogical Interpretation of LD Association Mapping 1 Linkage and Recombination v linkage equilibrium ²
12/5/14 Chapter 6 Linkage Disequilibrium & Gene Mapping (Recombination) Linkage Disequilibrium Genealogical Interpretation of LD Association Mapping 1 Linkage and Recombination v linkage equilibrium ²
Investigation of Correlation and Board Sense Heritability in Tritipyrum Lines under Normal and Drought Stress Conditions
 American-Eurasian J. Agric. & Environ. Sci., 3 (): 07-, 03 ISSN 88-6769 IDOSI Publications, 03 DOI: 0.589/idosi.aejaes.03.3.0.333 Investigation of Correlation and Board Sense Heritability in Tritipyrum
Lecture 11: Multiple trait models for QTL analysis
 Lecture 11: Multiple trait models for QTL analysis Julius van der Werf Multiple trait mapping of QTL...99 Increased power of QTL detection...99 Testing for linked QTL vs pleiotropic QTL...100 Multiple
G E INTERACTION USING JMP: AN OVERVIEW
 G E INTERACTION USING JMP: AN OVERVIEW Sukanta Dash I.A.S.R.I., Library Avenue, New Delhi-110012 sukanta@iasri.res.in 1. Introduction Genotype Environment interaction (G E) is a common phenomenon in agricultural
Introduction to Linkage Disequilibrium
 Introduction to September 10, 2014 Suppose we have two genes on a single chromosome gene A and gene B such that each gene has only two alleles Aalleles : A 1 and A 2 Balleles : B 1 and B 2 Suppose we have
Variance Component Models for Quantitative Traits. Biostatistics 666
 Variance Component Models for Quantitative Traits Biostatistics 666 Today Analysis of quantitative traits Modeling covariance for pairs of individuals estimating heritability Extending the model beyond
Introduction to QTL mapping in model organisms
 Introduction to QTL mapping in model organisms Karl W Broman Department of Biostatistics and Medical Informatics University of Wisconsin Madison www.biostat.wisc.edu/~kbroman [ Teaching Miscellaneous lectures]
Nature Genetics: doi: /ng Supplementary Figure 1. The phenotypes of PI , BR121, and Harosoy under short-day conditions.
 Supplementary Figure 1 The phenotypes of PI 159925, BR121, and Harosoy under short-day conditions. (a) Plant height. (b) Number of branches. (c) Average internode length. (d) Number of nodes. (e) Pods
GBLUP and G matrices 1
 GBLUP and G matrices 1 GBLUP from SNP-BLUP We have defined breeding values as sum of SNP effects:! = #$ To refer breeding values to an average value of 0, we adopt the centered coding for genotypes described
UNIT 8 BIOLOGY: Meiosis and Heredity Page 148
 UNIT 8 BIOLOGY: Meiosis and Heredity Page 148 CP: CHAPTER 6, Sections 1-6; CHAPTER 7, Sections 1-4; HN: CHAPTER 11, Section 1-5 Standard B-4: The student will demonstrate an understanding of the molecular
Washington Grain Commission Wheat and Barley Research Annual Progress Reports and Final Reports
 Washington Grain Commission Wheat and Barley Research Annual Progress Reports and Final Reports PROJECT #: 30109-5345 Progress report year: 3 of 3 Title: Evaluation And Selection For Cold Tolerance In
Genetic dissection of chlorophyll content at different growth stages in common wheat
 c Indian Academy of Sciences RESEARCH ARTICLE Genetic dissection of chlorophyll content at different growth stages in common wheat KUNPU ZHANG 1,2, ZHIJUN FANG 3, YAN LIANG 1 and JICHUN TIAN 1 1 State
Genetic Analysis for Heterotic Traits in Bread Wheat (Triticum aestivum L.) Using Six Parameters Model
 Using Six Parameters Model") International Journal of Current Microbiology and Applied Sciences ISSN: 2319-7706 Volume 7 Number 06 (2018) Journal homepage: http://www.ijcmas.com Original Research Article https://doi.org/10.20546/ijcmas.2018.706.029
International Journal of Current Microbiology and Applied Sciences ISSN: 2319-7706 Volume 7 Number 06 (2018) Journal homepage: http://www.ijcmas.com Original Research Article https://doi.org/10.20546/ijcmas.2018.706.029
2013 Breeding Progress for Rust Resistance in Confection Sunflower
 2013 Breeding Progress for Rust Resistance in Confection Sunflower Guojia Ma 1,2, Yunming Long 1,3, Sam Markell 2, Tom Gulya 1 and Lili Qi 1 1 USDA, ARS, NCSL, Fargo, ND 2 NDSU Plant Pathology, Fargo,
Introduc)on to Gene)cs How to Analyze Your Own Genome Fall 2013
on to Gene)cs How to Analyze Your Own Genome Fall 2013") Introduc)on to Gene)cs 02-223 How to Analyze Your Own Genome Fall 2013 Overview Primer on gene
Introduc)on to Gene)cs 02-223 How to Analyze Your Own Genome Fall 2013 Overview Primer on gene
(Genome-wide) association analysis
 association analysis") (Genome-wide) association analysis 1 Key concepts Mapping QTL by association relies on linkage disequilibrium in the population; LD can be caused by close linkage between a QTL and marker (= good) or by
(Genome-wide) association analysis 1 Key concepts Mapping QTL by association relies on linkage disequilibrium in the population; LD can be caused by close linkage between a QTL and marker (= good) or by
A Novel FHB-Resistance QTL with Uncertain Origin and its Introgression into Durum and Hard Red Spring Wheat
 A Novel FHB-Resistance QTL with Uncertain Origin and its Introgression into Durum and Hard Red Spring Wheat Steven Xu, Chenggen Chu, Timothy Friesen, Shiaoman Chao, Shaobin Zhong, Scott Halley, Xiwen Cai,
Genetic dissection of flag leaf morphology in wheat (Triticum aestivum L.) under diverse water regimes
 under diverse water regimes") Yang et al. BMC Genetics (2016) 17:94 DOI 10.1186/s12863-016-0399-9 RESEARCH ARTICLE Open Access Genetic dissection of flag leaf morphology in wheat (Triticum aestivum L.) under diverse water regimes Delong
Yang et al. BMC Genetics (2016) 17:94 DOI 10.1186/s12863-016-0399-9 RESEARCH ARTICLE Open Access Genetic dissection of flag leaf morphology in wheat (Triticum aestivum L.) under diverse water regimes Delong
Proportional Variance Explained by QLT and Statistical Power. Proportional Variance Explained by QTL and Statistical Power
 Proportional Variance Explained by QTL and Statistical Power Partitioning the Genetic Variance We previously focused on obtaining variance components of a quantitative trait to determine the proportion
Towards a high and sustainable biomass production: the Salix molecular breeding activities program (SAMBA)
") Towards a high and sustainable biomass production: the Salix molecular breeding activities program (SAMBA) Ann Christin Rönnberg-Wästljung*, Berit Samils, Nils-Erik Nordh, Jan Stenlid & Martin Weih *Dept.
Towards a high and sustainable biomass production: the Salix molecular breeding activities program (SAMBA) Ann Christin Rönnberg-Wästljung*, Berit Samils, Nils-Erik Nordh, Jan Stenlid & Martin Weih *Dept.
7.2: Natural Selection and Artificial Selection pg
 7.2: Natural Selection and Artificial Selection pg. 305-311 Key Terms: natural selection, selective pressure, fitness, artificial selection, biotechnology, and monoculture. Natural Selection is the process
Linkage analysis and QTL mapping in autotetraploid species. Christine Hackett Biomathematics and Statistics Scotland Dundee DD2 5DA
 Linkage analysis and QTL mapping in autotetraploid species Christine Hackett Biomathematics and Statistics Scotland Dundee DD2 5DA Collaborators John Bradshaw Zewei Luo Iain Milne Jim McNicol Data and
1 Errors in mitosis and meiosis can result in chromosomal abnormalities.
 Slide 1 / 21 1 Errors in mitosis and meiosis can result in chromosomal abnormalities. a. Identify and describe a common chromosomal mutation. Slide 2 / 21 Errors in mitosis and meiosis can result in chromosomal
The E-M Algorithm in Genetics. Biostatistics 666 Lecture 8
 The E-M Algorithm in Genetics Biostatistics 666 Lecture 8 Maximum Likelihood Estimation of Allele Frequencies Find parameter estimates which make observed data most likely General approach, as long as
Maize Genetics Cooperation Newsletter Vol Derkach 1
 Maize Genetics Cooperation Newsletter Vol 91 2017 Derkach 1 RELATIONSHIP BETWEEN MAIZE LANCASTER INBRED LINES ACCORDING TO SNP-ANALYSIS Derkach K. V., Satarova T. M., Dzubetsky B. V., Borysova V. V., Cherchel
Lecture 2: Genetic Association Testing with Quantitative Traits. Summer Institute in Statistical Genetics 2017
 Lecture 2: Genetic Association Testing with Quantitative Traits Instructors: Timothy Thornton and Michael Wu Summer Institute in Statistical Genetics 2017 1 / 29 Introduction to Quantitative Trait Mapping
The Lander-Green Algorithm. Biostatistics 666 Lecture 22
 The Lander-Green Algorithm Biostatistics 666 Lecture Last Lecture Relationship Inferrence Likelihood of genotype data Adapt calculation to different relationships Siblings Half-Siblings Unrelated individuals
Handbook on Online Proficiency Test Evaluation of Shoot-Root Ratio of Seedlings
 Handbook on Online Proficiency Test Evaluation of Shoot-Root Ratio of Seedlings 4 th Edition Institute of Plant Breeding, Seed Science and Population Genetics, Division of Seed Science and Technology,
Meiosis and Mendel. Chapter 6
 Meiosis and Mendel Chapter 6 6.1 CHROMOSOMES AND MEIOSIS Key Concept Gametes have half the number of chromosomes that body cells have. Body Cells vs. Gametes You have body cells and gametes body cells
Developing and implementing molecular markers in perennial ryegrass breeding
 Developing and implementing molecular markers in perennial ryegrass breeding K.F. Smith 1,3, J.W. Forster 2,3, T.A. Ciavarella 1,3, J.L. Dumsday 2, M.P. Dupal 2,3, E.S. Jones 2,3, B.D. Kirkwood 1,3, A.
Lecture 1 Hardy-Weinberg equilibrium and key forces affecting gene frequency
 Lecture 1 Hardy-Weinberg equilibrium and key forces affecting gene frequency Bruce Walsh lecture notes Introduction to Quantitative Genetics SISG, Seattle 16 18 July 2018 1 Outline Genetics of complex
Lecture 8. QTL Mapping 1: Overview and Using Inbred Lines
 Lecture 8 QTL Mapping 1: Overview and Using Inbred Lines Bruce Walsh. jbwalsh@u.arizona.edu. University of Arizona. Notes from a short course taught Jan-Feb 2012 at University of Uppsala While the machinery
Pedigree and genomic evaluation of pigs using a terminal cross model
 66 th EAAP Annual Meeting Warsaw, Poland Pedigree and genomic evaluation of pigs using a terminal cross model Tusell, L., Gilbert, H., Riquet, J., Mercat, M.J., Legarra, A., Larzul, C. Project funded by:
Introduction to QTL mapping in model organisms
 Introduction to QTL mapping in model organisms Karl Broman Biostatistics and Medical Informatics University of Wisconsin Madison kbroman.org github.com/kbroman @kwbroman Backcross P 1 P 2 P 1 F 1 BC 4
MOLECULAR MAPS AND MARKERS FOR DIPLOID ROSES
 MOLECULAR MAPS AND MARKERS FOR DIPLOID ROSES Patricia E Klein, Mandy Yan, Ellen Young, Jeekin Lau, Stella Kang, Natalie Patterson, Natalie Anderson and David Byrne Department of Horticultural Sciences,
QTL Mapping I: Overview and using Inbred Lines
 QTL Mapping I: Overview and using Inbred Lines Key idea: Looking for marker-trait associations in collections of relatives If (say) the mean trait value for marker genotype MM is statisically different
Introduction to QTL mapping in model organisms
 Human vs mouse Introduction to QTL mapping in model organisms Karl W Broman Department of Biostatistics Johns Hopkins University www.biostat.jhsph.edu/~kbroman [ Teaching Miscellaneous lectures] www.daviddeen.com
Population Genetics I. Bio
 Population Genetics I. Bio5488-2018 Don Conrad dconrad@genetics.wustl.edu Why study population genetics? Functional Inference Demographic inference: History of mankind is written in our DNA. We can learn
Lecture 13: Population Structure. October 8, 2012
 Lecture 13: Population Structure October 8, 2012 Last Time Effective population size calculations Historical importance of drift: shifting balance or noise? Population structure Today Course feedback The
GFP GAL bp 3964 bp
 Supplemental Data. Møller et al. (2009) Shoot Na + exclusion and increased salinity tolerance engineered by cell type-specific alteration of Na + transport in Arabidopsis Supplemental Figure 1. Salt-sensitive
A recipe for the perfect salsa tomato
 The National Association of Plant Breeders in partnership with the Plant Breeding and Genomics Community of Practice presents A recipe for the perfect salsa tomato David Francis, The Ohio State University
Lecture 22: Signatures of Selection and Introduction to Linkage Disequilibrium. November 12, 2012
 Lecture 22: Signatures of Selection and Introduction to Linkage Disequilibrium November 12, 2012 Last Time Sequence data and quantification of variation Infinite sites model Nucleotide diversity (π) Sequence-based
Case-Control Association Testing. Case-Control Association Testing
 Introduction Association mapping is now routinely being used to identify loci that are involved with complex traits. Technological advances have made it feasible to perform case-control association studies
Ch 11.Introduction to Genetics.Biology.Landis
 Nom Section 11 1 The Work of Gregor Mendel (pages 263 266) This section describes how Gregor Mendel studied the inheritance of traits in garden peas and what his conclusions were. Introduction (page 263)
Chapter 5 Evolution of Biodiversity
 Chapter 5 Evolution of Biodiversity Earth is home to a tremendous diversity of species diversity- the variety of ecosystems within a given region. diversity- the variety of species in a given ecosystem.
Tutorial Session 2. MCMC for the analysis of genetic data on pedigrees:
 MCMC for the analysis of genetic data on pedigrees: Tutorial Session 2 Elizabeth Thompson University of Washington Genetic mapping and linkage lod scores Monte Carlo likelihood and likelihood ratio estimation
FineMapping and Further Characterisation of a chromosomal Region of 3H with QTLs for Salinity Tolerance in Barley (Hordeum vulgare L.
 FineMapping and Further Characterisation of a chromosomal Region of 3H with QTLs for Salinity Tolerance in Barley (Hordeum vulgare L.) Han Hoang Nguyen FineMapping and Further Characterisation of a chromosomal
INTRODUCTION TO ANIMAL BREEDING. Lecture Nr 3. The genetic evaluation (for a single trait) The Estimated Breeding Values (EBV) The accuracy of EBVs
 The Estimated Breeding Values (EBV) The accuracy of EBVs") INTRODUCTION TO ANIMAL BREEDING Lecture Nr 3 The genetic evaluation (for a single trait) The Estimated Breeding Values (EBV) The accuracy of EBVs Etienne Verrier INA Paris-Grignon, Animal Sciences Department
INTRODUCTION TO ANIMAL BREEDING Lecture Nr 3 The genetic evaluation (for a single trait) The Estimated Breeding Values (EBV) The accuracy of EBVs Etienne Verrier INA Paris-Grignon, Animal Sciences Department
Lecture 4: Allelic Effects and Genetic Variances. Bruce Walsh lecture notes Tucson Winter Institute 7-9 Jan 2013
 Lecture 4: Allelic Effects and Genetic Variances Bruce Walsh lecture notes Tucson Winter Institute 7-9 Jan 2013 1 Basic model of Quantitative Genetics Phenotypic value -- we will occasionally also use
LECTURE # How does one test whether a population is in the HW equilibrium? (i) try the following example: Genotype Observed AA 50 Aa 0 aa 50
 try the following example: Genotype Observed AA 50 Aa 0 aa 50") LECTURE #10 A. The Hardy-Weinberg Equilibrium 1. From the definitions of p and q, and of p 2, 2pq, and q 2, an equilibrium is indicated (p + q) 2 = p 2 + 2pq + q 2 : if p and q remain constant, and if
LECTURE #10 A. The Hardy-Weinberg Equilibrium 1. From the definitions of p and q, and of p 2, 2pq, and q 2, an equilibrium is indicated (p + q) 2 = p 2 + 2pq + q 2 : if p and q remain constant, and if
Name Class Date. KEY CONCEPT Gametes have half the number of chromosomes that body cells have.
 Section 1: Chromosomes and Meiosis KEY CONCEPT Gametes have half the number of chromosomes that body cells have. VOCABULARY somatic cell autosome fertilization gamete sex chromosome diploid homologous
Evolutionary Ecology of Senecio
 Evolutionary Ecology of Senecio Evolutionary ecology The primary focus of evolutionary ecology is to identify and understand the evolution of key traits, by which plants are adapted to their environment,
Gene mapping in model organisms
 Gene mapping in model organisms Karl W Broman Department of Biostatistics Johns Hopkins University http://www.biostat.jhsph.edu/~kbroman Goal Identify genes that contribute to common human diseases. 2
Multiple QTL mapping
 Multiple QTL mapping Karl W Broman Department of Biostatistics Johns Hopkins University www.biostat.jhsph.edu/~kbroman [ Teaching Miscellaneous lectures] 1 Why? Reduce residual variation = increased power
Breeding strategy for improvement of flower and seed yields in safflower
 Breeding strategy for improvement of flower and seed yields in safflower Vrijendra Singh, N. M. Kolekar and N. Nimbkar Nimbkar Agricultural Research Institute, Lonand Road, Phaltan 415523, Maharashtra,
Q1) Explain how background selection and genetic hitchhiking could explain the positive correlation between genetic diversity and recombination rate.
 Explain how background selection and genetic hitchhiking could explain the positive correlation between genetic diversity and recombination rate.") OEB 242 Exam Practice Problems Answer Key Q1) Explain how background selection and genetic hitchhiking could explain the positive correlation between genetic diversity and recombination rate. First, recall
OEB 242 Exam Practice Problems Answer Key Q1) Explain how background selection and genetic hitchhiking could explain the positive correlation between genetic diversity and recombination rate. First, recall
Common Mating Designs in Agricultural Research and Their Reliability in Estimation of Genetic Parameters
 IOSR Journal of Agriculture and Veterinary Science (IOSR-JAVS) e-issn: 2319-2380, p-issn: 2319-2372. Volume 11, Issue 7 Ver. II (July 2018), PP 16-36 www.iosrjournals.org Common Mating Designs in Agricultural
1. they are influenced by many genetic loci. 2. they exhibit variation due to both genetic and environmental effects.
 October 23, 2009 Bioe 109 Fall 2009 Lecture 13 Selection on quantitative traits Selection on quantitative traits - From Darwin's time onward, it has been widely recognized that natural populations harbor
Evolutionary Genetics Midterm 2008
 Student # Signature The Rules: (1) Before you start, make sure you ve got all six pages of the exam, and write your name legibly on each page. P1: /10 P2: /10 P3: /12 P4: /18 P5: /23 P6: /12 TOT: /85 (2)
Genetic diversity and population structure in rice. S. Kresovich 1,2 and T. Tai 3,5. Plant Breeding Dept, Cornell University, Ithaca, NY
 Genetic diversity and population structure in rice S. McCouch 1, A. Garris 1,2, J. Edwards 1, H. Lu 1,3 M Redus 4, J. Coburn 1, N. Rutger 4, S. Kresovich 1,2 and T. Tai 3,5 1 Plant Breeding Dept, Cornell
Association Testing with Quantitative Traits: Common and Rare Variants. Summer Institute in Statistical Genetics 2014 Module 10 Lecture 5
 Association Testing with Quantitative Traits: Common and Rare Variants Timothy Thornton and Katie Kerr Summer Institute in Statistical Genetics 2014 Module 10 Lecture 5 1 / 41 Introduction to Quantitative
Variability, Heritability and Genetic Advance Analysis in Bread Wheat (Triticum aestivum L.) Genotypes
 Genotypes") International Journal of Current Microbiology and Applied Sciences ISSN: 2319-7706 Volume 6 Number 8 (2017) pp. 2687-2691 Journal homepage: http://www.ijcmas.com Original Research Article https://doi.org/10.20546/ijcmas.2017.608.321
International Journal of Current Microbiology and Applied Sciences ISSN: 2319-7706 Volume 6 Number 8 (2017) pp. 2687-2691 Journal homepage: http://www.ijcmas.com Original Research Article https://doi.org/10.20546/ijcmas.2017.608.321
AEC 550 Conservation Genetics Lecture #2 Probability, Random mating, HW Expectations, & Genetic Diversity,
 AEC 550 Conservation Genetics Lecture #2 Probability, Random mating, HW Expectations, & Genetic Diversity, Today: Review Probability in Populatin Genetics Review basic statistics Population Definition
THE USE OF DOUBLED-HAPLOIDS IN CASSAVA BREEDING
 150 THE USE OF DOUBLED-HAPLOIDS IN CASSAVA BREEDING Hernan Ceballos 1, J.C. Pérez 1, C. Iglesias 2, M. Fregene 1, F. Calle 1, G. Jaramillo 1, N. Morante 1 and J. López 1 ABSTRACT Cassava breeding is difficult
Classical Selection, Balancing Selection, and Neutral Mutations
 Classical Selection, Balancing Selection, and Neutral Mutations Classical Selection Perspective of the Fate of Mutations All mutations are EITHER beneficial or deleterious o Beneficial mutations are selected
Resemblance between relatives
 Resemblance between relatives 1 Key concepts Model phenotypes by fixed effects and random effects including genetic value (additive, dominance, epistatic) Model covariance of genetic effects by relationship
Plant Propagation PLS 3223/5222
 Plant Propagation PLS 3223/5222 Dr. Sandra Wilson Dr. Mack Thetford Principles and Practices of Seed Selection Chapter 5 1 Chapter 5 Objectives are to Understand: Self and cross pollination Sexual incompatibility
Developing summerdormant tall fescue for the southern Great Plains
 Developing summerdormant tall fescue for the southern Great Plains Persistence is the major constraint of growing tall fescue in south-central USA 40-60% stand loss in a year Improve persistence Drought
Genetic and physiological approach to elucidation of Cd absorption mechanism by rice plants
 Genetic and physiological approach to elucidation of Cd absorption mechanism by rice plants Satoru Ishikawa National Institute for Agro-Environmental Sciences, 3-1-3, Kannondai, Tsukuba, Ibaraki, 305-8604,
Evolutionary factors and synthetic biology
 Evolutionary factors and synthetic biology NAS Joint Session on Climate Change and Ecology Owain Edwards Group Leader, Environmental Synthetic Genomics, CSIRO, Perth, Australia Domain Leader, Biocontrol
DNA polymorphisms such as SNP and familial effects (additive genetic, common environment) to
 to") 1 1 1 1 1 1 1 1 0 SUPPLEMENTARY MATERIALS, B. BIVARIATE PEDIGREE-BASED ASSOCIATION ANALYSIS Introduction We propose here a statistical method of bivariate genetic analysis, designed to evaluate contribution
1 1 1 1 1 1 1 1 0 SUPPLEMENTARY MATERIALS, B. BIVARIATE PEDIGREE-BASED ASSOCIATION ANALYSIS Introduction We propose here a statistical method of bivariate genetic analysis, designed to evaluate contribution
arxiv: v1 [stat.me] 10 Jun 2018
![arxiv: v1 [stat.me] 10 Jun 2018](/thumbs/79/80338220.jpg "arxiv: v1 [stat.me] 10 Jun 2018") Lost in translation: On the impact of data coding on penalized regression with interactions arxiv:1806.03729v1 [stat.me] 10 Jun 2018 Johannes W R Martini 1,2 Francisco Rosales 3 Ngoc-Thuy Ha 2 Thomas Kneib
Lost in translation: On the impact of data coding on penalized regression with interactions arxiv:1806.03729v1 [stat.me] 10 Jun 2018 Johannes W R Martini 1,2 Francisco Rosales 3 Ngoc-Thuy Ha 2 Thomas Kneib
Heinrich Grausgruber Department of Crop Sciences Division of Plant Breeding Konrad-Lorenz-Str Tulln
 957.321 Sources: Nespolo (2003); Le Rouzic et al. (2007) Heinrich Grausgruber Department of Crop Sciences Division of Plant Breeding Konrad-Lorenz-Str. 24 3430 Tulln Zuchtmethodik & Quantitative Genetik
Major Genes, Polygenes, and
 Major Genes, Polygenes, and QTLs Major genes --- genes that have a significant effect on the phenotype Polygenes --- a general term of the genes of small effect that influence a trait QTL, quantitative
Lecture 2: Introduction to Quantitative Genetics
 Lecture 2: Introduction to Quantitative Genetics Bruce Walsh lecture notes Introduction to Quantitative Genetics SISG, Seattle 16 18 July 2018 1 Basic model of Quantitative Genetics Phenotypic value --
One-week Course on Genetic Analysis and Plant Breeding January 2013, CIMMYT, Mexico LOD Threshold and QTL Detection Power Simulation
 One-week Course on Genetic Analysis and Plant Breeding 21-2 January 213, CIMMYT, Mexico LOD Threshold and QTL Detection Power Simulation Jiankang Wang, CIMMYT China and CAAS E-mail: jkwang@cgiar.org; wangjiankang@caas.cn
Investigations into biomass yield in perennial ryegrass (Lolium perenne L.)
") Investigations into biomass yield in perennial ryegrass (Lolium perenne L.) Ulrike Anhalt 1,2, Pat Heslop-Harrison 2, Céline Tomaszewski 1,2, Hans-Peter Piepho 3, Oliver Fiehn 4 and Susanne Barth 1 1 2
Investigations into biomass yield in perennial ryegrass (Lolium perenne L.) Ulrike Anhalt 1,2, Pat Heslop-Harrison 2, Céline Tomaszewski 1,2, Hans-Peter Piepho 3, Oliver Fiehn 4 and Susanne Barth 1 1 2
Population Genetics & Evolution
 The Theory of Evolution Mechanisms of Evolution Notes Pt. 4 Population Genetics & Evolution IMPORTANT TO REMEMBER: Populations, not individuals, evolve. Population = a group of individuals of the same
For 5% confidence χ 2 with 1 degree of freedom should exceed 3.841, so there is clear evidence for disequilibrium between S and M.
 STAT 550 Howework 6 Anton Amirov 1. This question relates to the same study you saw in Homework-4, by Dr. Arno Motulsky and coworkers, and published in Thompson et al. (1988; Am.J.Hum.Genet, 42, 113-124).