Nature Genetics: doi: /ng Supplementary Figure 1. The phenotypes of PI , BR121, and Harosoy under short-day conditions.
|
|
|
- Elfrieda Gregory
- 5 years ago
- Views:
Transcription
 Pods per plant. (f) Grains per plant. The plants were grown in a standard field with artificially controlled short-day conditions (12 h light/12 h dark). All data are given as means ± s.e.m. (n = 10 plants).")
1 Supplementary Figure 1 The phenotypes of PI , BR121, and Harosoy under short-day conditions. (a) Plant height. (b) Number of branches. (c) Average internode length. (d) Number of nodes. (e) Pods per plant. (f) Grains per plant. The plants were grown in a standard field with artificially controlled short-day conditions (12 h light/12 h dark). All data are given as means ± s.e.m. (n = 10 plants). One-tailed, two-sample t-tests were used to generate the P values.

 Allelic effects on flowering time of QTLs of J and E1 in two F 2 populations, PI 159925 Harosoy (c) and BR121 Harosoy (d).")
2 Supplementary Figure 2 QTL mapping of the J locus. (a,b) Whole-chromosome scan of QTLs in two F 2 populations, PI Harosoy (a) and BR121 Harosoy (b). Red lines indicate the threshold for QTL detection. Detailed QTL information is provided in Supplementary Table 1. QTLs were evaluated for flowering time under short-day conditions for the two F 2 populations. (c,d) Allelic effects on flowering time of QTLs of J and E1 in two F 2 populations, PI Harosoy (c) and BR121 Harosoy (d). Allelic combinations of the J and E1 loci are indicated in each column. The numbers correspond to the plants tested for each allelic combination of J and E1. Genotyping of J and E1 is described in the Online Methods.
.")
3 Supplementary Figure 3 Protein sequence alignment of loss-of-function j alleles and nonsynonymous SNPs. The amino acid sequence in the box is the binding position for the antibody to J. A red arrowhead indicates the critical amino acid substitutions that reduced the functions of J, as confirmed by transient assays with the E1 promoter (Supplementary Fig. 10c). Sequences were aligned with Clustal X.
 Plant height (a), average internode length (b), number of branches(c), number of nodes (d), pods per plant (e), and grains per plant (f) in the two transformants and BR121.")
4 Supplementary Figure 4 Phenotypes of the two transformants and of BR121 and the NILs of J under short-day conditions. (a f) Plant height (a), average internode length (b), number of branches(c), number of nodes (d), pods per plant (e), and grains per plant (f) in the two transformants and BR121. (g j) Plant height (g), number of nodes (h), pods per plant (i), and grains per plant (j) in NILs of J. All plants were grown in a standard field with artificially controlled short-day conditions (12 h light/12 h dark). All data are given as means ± s.e.m. (n = 10 plants). One-tailed, two-sample t-tests were used to generate the P values.
 Molecular markers and their genomic positions on chromosome 4 (top) and chromosome 6 (bottom).")
 Introgression segments of J on chromosome 4 (top) and E1 on chromosome 6 (bottom) in four NILs segregating at the E1 and J loci.")
5 Supplementary Figure 5 The genotypes of the NILs of J and E1 derived from the cross between BR121 and Harosoy. (a) Molecular markers and their genomic positions on chromosome 4 (top) and chromosome 6 (bottom). (b) Introgression segments of J on chromosome 4 (top) and E1 on chromosome 6 (bottom) in NIL-J/j. (c) Introgression segments of J on chromosome 4 (top) and E1 on chromosome 6 (bottom) in four NILs segregating at the E1 and J loci. White represents the segments derived from BR121, and gray represents the segments derived from Harosoy. Squares indicate the different homozygous introgression segments for the J and E1 loci. Primers are listed in Supplementary Table 9.
 Phylogenetic tree of J and ELF3 proteins from different species.")
 Flowering time corresponding to rosette leaf numbers from the plants in b.")
6 Supplementary Figure 6 Phylogenetic tree of J and its complementation in the Arabidopsis elf3-8 mutant. (a) Phylogenetic tree of J and ELF3 proteins from different species. (b) Complementation of flowering of the Arabidopsis elf3-8 mutant by pelf3:j and overexpression of p35s:j in wild-type Col-0. Scale bar, 10 cm. (c) Flowering time corresponding to rosette leaf numbers from the plants in b. All transformants were from Arabidopsis T 1 transgenic lines.

7 Supplementary Figure 7 Diurnal expressions of J, E1, FT2a, and FT5a in transformant TC#2 and BR121 and in NILs of J under short-day conditions. Plants were grown until 20 DAE. Each sample was collected from three plants and bulked. qrt PCR results were from three technical replicates and are shown as means ± s.e.m.
 Diurnal expression of J (b) and E1 (c) in NILs of E3 E4. (d) Flowering time of NILs of E3 E4. Plants were grown until 20 DAE. Each sample was collected from three plants and bulked.")
8 Supplementary Figure 8 Diurnal expressions of J and E1 in NILs of E1 and E3 E4, and flowering response under short-day conditions. (a) Diurnal expressions of J in NILs of E1. (b,c) Diurnal expression of J (b) and E1 (c) in NILs of E3 E4. (d) Flowering time of NILs of E3 E4. Plants were grown until 20 DAE. Each sample was collected from three plants and bulked. qrt PCR results are from three technical replicates and are shown as means ± s.e.m. Flowering time was recoded from 15 plants for each NIL. One-tailed, two-sample t-tests were used to generate the P values.
 and BR121 (j-2) seedlings grown under short-day")

9 Supplementary Figure 9 Specific test of J antibody. Leaf proteins of 20-d-old TC#2 (pj:j) and BR121 (j-2) seedlings grown under short-day conditions were tested by immunoblot with J antibody. An asterisk denotes the specific band of J protein, and a star indicates the unspecific band that can act as a loading control. The image of the immunoblot is full length.
 Sequence motifs of the LBS binding sites in the E1 promoter. Red indicates the native sequences used for the pe1-gus construct.")
 The relative GUS activity of J proteins with a nonsynonymous SNP on suppression of the E1 promoter.")
10 Supplementary Figure 10 GUS activity with mutation of the GATWCG motifs in the E1 promoter and GUS activity of J proteins with a nonsynonymous SNP on suppression of the E1 promoter in Arabidopsis transient assays. (a) Sequence motifs of the LBS binding sites in the E1 promoter. Red indicates the native sequences used for the pe1-gus construct. Blue indicates the mutant sequences used for the mpe1-gus construct. (b) The relative GUS activity of the E1 promoter is suppressed by J protein. GUS activity is from three independent replicates and is shown as means ± s.e.m. (c) The relative GUS activity of J proteins with a nonsynonymous SNP on suppression of the E1 promoter. The presence of different lowercase letters above the histogram bars denotes significant differences across the two panels (P < 0.05). GUS activity is from six independent replicates and is shown as means ± s.e.m. One-tailed, two-sample t-tests were used to generate the P values.
 Flowering time of transformants TC#2 (a) and TC#6 (b) versus BR121 under long-day conditions. All data are given as means ± s.e.m. (n = 10 plants).")
 Diurnal expression of J (c), E1 (d), FT2a (e), and FT5a (f) in transformant TC#2 versus BR121 under long-day conditions.")
11 Supplementary Figure 11 Flowering-time response of J under long-day (14 h light/10 h dark) conditions. (a,b) Flowering time of transformants TC#2 (a) and TC#6 (b) versus BR121 under long-day conditions. All data are given as means ± s.e.m. (n = 10 plants). One-tailed, two-sample t-tests were used to generate the P values. (c f) Diurnal expression of J (c), E1 (d), FT2a (e), and FT5a (f) in transformant TC#2 versus BR121 under long-day conditions. Plants were grown until 20 DAE. Each sample was collected from three plants and bulked. qrt PCR results are from three technical replicates and are shown as means ± s.e.m.

12 Supplementary Figure 12 Proposed model of the photoperiod-regulated flowering pathway under short-day conditions. J is suppressed by two PHYAs, E3 and E4, and the J protein physically binds to the promoter of E1 near the LUX-binding motif to suppress E1 transcription. This relieves the E1-dependent transcriptional repression of FT2a and FT5a, which promote flowering. When the function of the J gene is impaired, E1 itself is released from repression and is able to repress FT2a and FT5a, resulting in later flowering.


13 Supplementary Figure 13 Flowering time variations of 15 accessions harboring mutant alleles of J under short-day conditions. Details of the 15 accessions are provided in Supplementary Table 6. The plants were grown in a standard field with artificially controlled short-day conditions (12 h light/12 h dark). All data are given as means ± s.e.m. (n = 5 plants)

14 Supplementary Figure 14 Mutant alleles of J and phylogenetic tree of 302 resequenced soybean accessions. The 302 resequenced soybean accessions represent the process of soybean domestication and improvement. Dark gray clusters represent wild soybeans, violet clusters represent landraces, and blue clusters represent improved cultivars. Blue circles correspond to the normal allele and red circles correspond to mutant alleles of J.
15
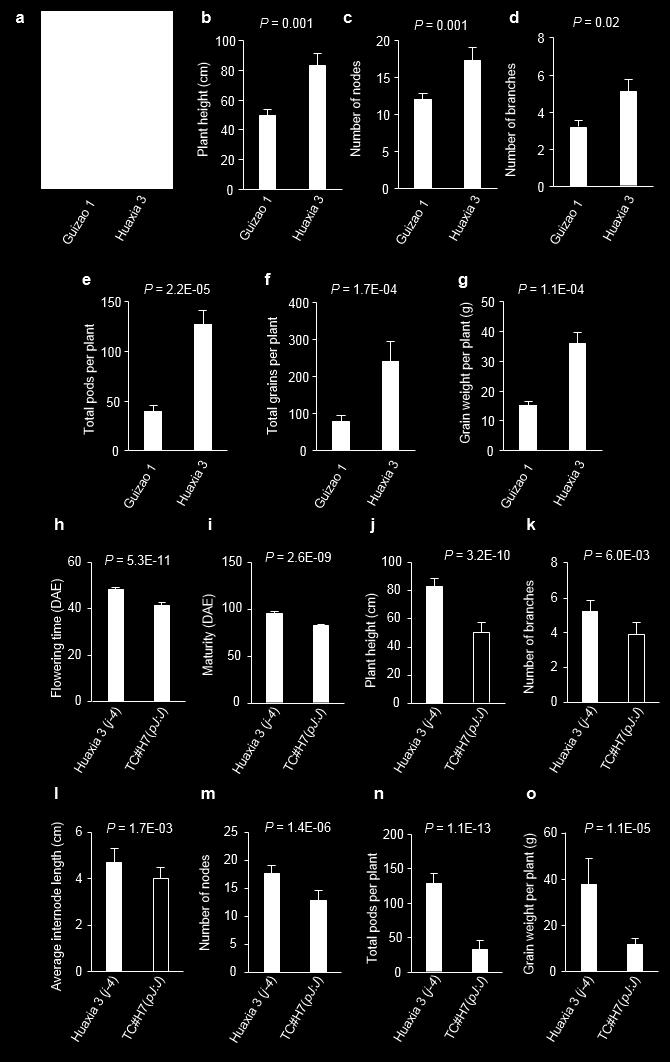
16 Supplementary Figure 15 Phenotypes of Guizao 1 versus Huaxia 3 and Huaxia 3 (j-4) versus its complementation transgenic T 4 line TC#H7 (pj:j) under short-day conditions. (a) Huaxia 3 had increased plant height, node numbers, and pod numbers. Scale bar, 10 cm. (b g) Plant height (b), number of nodes (c), number of branches (d), pods per plant (e), grains per plant (f), and yield per plant (g) of Guizao 1 and Huaxia 3. (h o) Flowering time (h), maturity (i), plant height (j), number of nodes (k), average internode length (l), number of nodes (m), pods per plant (n), and grain yield per plant (o) in Huaxia 3 and transgenic line TC#H7. The plants were grown in a standard field with artificially controlled short-day conditions (12 h light/12 h dark). All data are given as means ± s.e.m. (n = 10 plants). One-tailed, two-sample t-tests were used to generate the P values.
Supplementary Figure S1. Amino acid alignment of selected monocot FT-like and TFL-like sequences. Sequences were aligned using ClustalW and analyzed
 Supplementary Figure S1. Amino acid alignment of selected monocot FT-like and TFL-like sequences. Sequences were aligned using ClustalW and analyzed using the Geneious software. Accession numbers of the
Nature Genetics: doi: /ng Supplementary Figure 1. ssp mutant phenotypes in a functional SP background.
 Supplementary Figure 1 ssp mutant phenotypes in a functional SP background. (a,b) Statistical comparisons of primary and sympodial shoot flowering times as determined by mean values for leaf number on
Photoreceptor Regulation of Constans Protein in Photoperiodic Flowering
 Photoreceptor Regulation of Constans Protein in Photoperiodic Flowering by Valverde et. Al Published in Science 2004 Presented by Boyana Grigorova CBMG 688R Feb. 12, 2007 Circadian Rhythms: The Clock Within
Supplemental Data. Perea-Resa et al. Plant Cell. (2012) /tpc
 /tpc") Supplemental Data. Perea-Resa et al. Plant Cell. (22)..5/tpc.2.3697 Sm Sm2 Supplemental Figure. Sequence alignment of Arabidopsis LSM proteins. Alignment of the eleven Arabidopsis LSM proteins. Sm and
Supplemental Data. Perea-Resa et al. Plant Cell. (22)..5/tpc.2.3697 Sm Sm2 Supplemental Figure. Sequence alignment of Arabidopsis LSM proteins. Alignment of the eleven Arabidopsis LSM proteins. Sm and
Table S1 List of primers used for genotyping and qrt-pcr.
 Table S1 List of primers used for genotyping and qrt-pcr. genotyping! allele! ligomer*! 5'-sequence-3'! rice! d10-2! F! TTGGCTTTGCCTCGTTTC!!! R! AGCCTCCACTTGTACTGTG! Arabidopsis! max2-3, max2-4! F! ACTCTCTCCGACCTCCCTGACG!!!
Supplementary Methods
 Supplementary Methods Microarray analysis Grains of 7 DAP of the wild-type and gif1 were harvested for RNA preparation. Microarray analysis was performed with the Affymetrix (Santa Clara, CA) GeneChip
SUPPLEMENTARY INFORMATION
 SUPPLEMENTARY INFORMATION doi:10.1038/nature10534 Supplementary Fig. 1. Diagrammatic representation of the N-end rule pathway of targeted proteolysis (after Graciet and Wellmer 2010 9 ). Tertiary, secondary
Supplementary Figure 1
 Supplementary Figure 1 Supplementary Figure 1. HSP21 expression in 35S:HSP21 and hsp21 knockdown plants. (a) Since no T- DNA insertion line for HSP21 is available in the publicly available T-DNA collections,
Supplementary Figure 1 Characterization of wild type (WT) and abci8 mutant in the paddy field.
 and abci8 mutant in the paddy field.") Supplementary Figure 1 Characterization of wild type (WT) and abci8 mutant in the paddy field. A, Phenotypes of 30-day old wild-type (WT) and abci8 mutant plants grown in a paddy field under normal sunny
Supplementary Figure 1 Characterization of wild type (WT) and abci8 mutant in the paddy field. A, Phenotypes of 30-day old wild-type (WT) and abci8 mutant plants grown in a paddy field under normal sunny
Supplemental Data. Wang et al. (2014). Plant Cell /tpc
. Plant Cell /tpc") Supplemental Figure1: Mock and NPA-treated tomato plants. (A) NPA treated tomato (cv. Moneymaker) developed a pin-like inflorescence (arrowhead). (B) Comparison of first and second leaves from mock and
Supplemental Figure1: Mock and NPA-treated tomato plants. (A) NPA treated tomato (cv. Moneymaker) developed a pin-like inflorescence (arrowhead). (B) Comparison of first and second leaves from mock and
Supplementary Figure 1. Markedly decreased numbers of marginal zone B cells in DOCK8 mutant mice Supplementary Figure 2.
 Supplementary Figure 1. Markedly decreased numbers of marginal zone B cells in DOCK8 mutant mice. Percentage of marginal zone B cells in the spleen of wild-type mice (+/+), mice homozygous for cpm or pri
Title. Authors. Characterization of a major QTL for manganese accumulation in rice grain
 Title Characterization of a major QTL for manganese accumulation in rice grain Authors Chaolei Liu, Guang Chen, Yuanyuan Li, Youlin Peng, Anpeng Zhang, Kai Hong, Hongzhen Jiang, Banpu Ruan, Bin Zhang,
GFP GAL bp 3964 bp
 Supplemental Data. Møller et al. (2009) Shoot Na + exclusion and increased salinity tolerance engineered by cell type-specific alteration of Na + transport in Arabidopsis Supplemental Figure 1. Salt-sensitive
Nature Genetics: doi: /ng Supplementary Figure 1. The FIN and FAB genes act separately from the meristem maturation pathway.
 Supplementary Figure 1 The FIN and FAB genes act separately from the meristem maturation pathway. (a) Representative inflorescence from the compound inflorescence (s, defective in the homolog of Arabidopsis
** * * * Col-0 cau1 CAU1. Actin2 CAS. Actin2. Supplemental Figure 1. CAU1 affects calcium accumulation.
 Ca 2+ ug g -1 DW Ca 2+ ug g -1 DW Ca 2+ ug g -1 DW Supplemental Data. Fu et al. Plant Cell. (213). 1.115/tpc.113.113886 A 5 4 3 * Col- cau1 B 4 3 2 Col- cau1 ** * * ** C 2 1 25 2 15 1 5 Shoots Roots *
Supplemental Data. Chen and Thelen (2010). Plant Cell /tpc
. Plant Cell /tpc") Supplemental Data. Chen and Thelen (2010). Plant Cell 10.1105/tpc.109.071837 1 C Total 5 kg 20 kg 100 kg Transmission Image 100 kg soluble pdtpi-gfp Plastid (PDH-alpha) Mito (PDH-alpha) GFP Image vector
Supplemental Data. Chen and Thelen (2010). Plant Cell 10.1105/tpc.109.071837 1 C Total 5 kg 20 kg 100 kg Transmission Image 100 kg soluble pdtpi-gfp Plastid (PDH-alpha) Mito (PDH-alpha) GFP Image vector
SUPPLEMENTARY INFORMATION
 SUPPLEMENTARY INFORMATION doi:10.1038/nature12791 Supplementary Figure 1 (1/3) WWW.NATURE.COM/NATURE 1 RESEARCH SUPPLEMENTARY INFORMATION Supplementary Figure 1 (2/3) 2 WWW.NATURE.COM/NATURE SUPPLEMENTARY
Supplementary Materials for
 www.sciencesignaling.org/cgi/content/full/9/452/ra106/dc1 Supplementary Materials for Stem-piped light activates phytochrome B to trigger light responses in Arabidopsis thaliana roots Hyo-Jun Lee, Jun-Ho
Supplemental Data. Perrella et al. (2013). Plant Cell /tpc
. Plant Cell /tpc") Intensity Intensity Intensity Intensity Intensity Intensity 150 50 150 0 10 20 50 C 150 0 10 20 50 D 0 10 20 Distance (μm) 50 20 40 E 50 F 0 10 20 50 0 15 30 Distance (μm) Supplemental Figure 1: Co-localization
Intensity Intensity Intensity Intensity Intensity Intensity 150 50 150 0 10 20 50 C 150 0 10 20 50 D 0 10 20 Distance (μm) 50 20 40 E 50 F 0 10 20 50 0 15 30 Distance (μm) Supplemental Figure 1: Co-localization
Figure 1. Identification of UGT74E2 as an IBA glycosyltransferase. (A) Relative conversion rates of different plant hormones to their glucosylated
 Relative conversion rates of different plant hormones to their glucosylated") Figure 1. Identification of UGT74E2 as an IBA glycosyltransferase. (A) Relative conversion rates of different plant hormones to their glucosylated form by recombinant UGT74E2. The naturally occurring auxin
Figure 1. Identification of UGT74E2 as an IBA glycosyltransferase. (A) Relative conversion rates of different plant hormones to their glucosylated form by recombinant UGT74E2. The naturally occurring auxin
SUPPLEMENTARY INFORMATION
 reverse 3175 3175 F L C 318 318 3185 3185 319 319 3195 3195 315 8 1 315 3155 315 317 Supplementary Figure 3. Stability of expression of the GFP sensor constructs return to warm conditions. Semi-quantitative
Biological Roles of Cytokinins
 Direct Control of Shoot Meristem Activity by a Cytokinin-Activating Enzyme By Kurakawa et. Al. Published in Nature Presented by Boyana Grigorova Biological Roles of Cytokinins Cytokinins are positive regulators
Supplementary Table 1. Primers used in this study.
 Supplementary Tale 1. Primers used in this study. Name Primer sequence (5'-3') Primers of PCR-ased molecular markers developed in this study M1 F M1 R M2 F M2 R M3 F M3 R M4 F M4 R M5 F M5 R M6 F M6 R
Supplemental Data. Hou et al. (2016). Plant Cell /tpc
. Plant Cell /tpc") Supplemental Data. Hou et al. (216). Plant Cell 1.115/tpc.16.295 A Distance to 1 st nt of start codon Distance to 1 st nt of stop codon B Normalized PARE abundance 8 14 nt 17 nt Frame1 Arabidopsis inflorescence
Supplemental Data. Hou et al. (216). Plant Cell 1.115/tpc.16.295 A Distance to 1 st nt of start codon Distance to 1 st nt of stop codon B Normalized PARE abundance 8 14 nt 17 nt Frame1 Arabidopsis inflorescence
Supplemental material
 Supplemental material Table 1- Segregation analysis of sgt1a sgt1b double mutant plants Parental genotype No. of lines Normal seeds Phenotype Abnormal seeds Ratio of abnormal seeds (%) WT 3 171 2 1.16
Supplemental Data. Yamamoto et al. (2016). Plant Cell /tpc WT + HCO 3. slac1-4/δnc #5 + HCO 3 WT + ABA. slac1-4/δnc #5 + ABA
. Plant Cell /tpc WT + HCO 3. slac1-4/δnc #5 + HCO 3 WT + ABA. slac1-4/δnc #5 + ABA") I (pa) I (pa) A WT + HCO 3 B 2 V (mv) 15 1 5 5 2 slac14/δnc #5 + HCO 3 4 6 WT (n = 6) 8 WT + HCO 3 (n = 7) slac14/δnc #5 (n = 6) slac14/δnc #5 + HCO 3 (n = 1) C WT + ABA D 2 V (mv) 15 1 5 5 2 slac14/δnc
I (pa) I (pa) A WT + HCO 3 B 2 V (mv) 15 1 5 5 2 slac14/δnc #5 + HCO 3 4 6 WT (n = 6) 8 WT + HCO 3 (n = 7) slac14/δnc #5 (n = 6) slac14/δnc #5 + HCO 3 (n = 1) C WT + ABA D 2 V (mv) 15 1 5 5 2 slac14/δnc
THE ROLE OF THE PHYTOCHROME B PHOTORECEPTOR IN THE REGULATION OF PHOTOPERIODIC FLOWERING. AnitaHajdu. Thesis of the Ph.D.
 THE ROLE OF THE PHYTOCHROME B PHOTORECEPTOR IN THE REGULATION OF PHOTOPERIODIC FLOWERING AnitaHajdu Thesis of the Ph.D. dissertation Supervisor: Dr. LászlóKozma-Bognár - senior research associate Doctoral
EXPRESSION OF THE FIS2 PROMOTER IN ARABIDOPSIS THALIANA
 EXPRESSION OF THE FIS2 PROMOTER IN ARABIDOPSIS THALIANA Item Type text; Electronic Thesis Authors Bergstrand, Lauren Janel Publisher The University of Arizona. Rights Copyright is held by the author. Digital
Regulation of Phosphate Homeostasis by microrna in Plants
 Regulation of Phosphate Homeostasis by microrna in Plants Tzyy-Jen Chiou 1 *, Kyaw Aung 1,2, Shu-I Lin 1,3, Chia-Chune Wu 1, Su-Fen Chiang 1, and Chun-Lin Su 1 Abstract Upon phosphate (Pi) starvation,
GENETIC ANALYSES OF ROOT SYSTEM DEVELOPMENT IN THE TOMATO CROP MODEL
 GENETIC ANALYSES OF ROOT SYSTEM DEVELOPMENT IN THE TOMATO CROP MODEL Kelsey Hoth 1 Dr. Maria Ivanchenko 2 Bioresourse Research 1, Department of Botany and Plant Physiology 2, Oregon State University, Corvallis,
Principles of QTL Mapping. M.Imtiaz
 Principles of QTL Mapping M.Imtiaz Introduction Definitions of terminology Reasons for QTL mapping Principles of QTL mapping Requirements For QTL Mapping Demonstration with experimental data Merit of QTL
Supplemental Data. Gao et al. (2012). Plant Cell /tpc
. Plant Cell /tpc") Supplemental Figure 1. Plant EMP Proteins. (A) The Accession numbers of the 12 EMP members from Arabidopsis. (B) Phylogenetic analysis of EMP proteins from Arabidopsis, human and yeast using the Mac Vector
Supplemental Figure 1. Plant EMP Proteins. (A) The Accession numbers of the 12 EMP members from Arabidopsis. (B) Phylogenetic analysis of EMP proteins from Arabidopsis, human and yeast using the Mac Vector
Supporting Online Material for
 www.sciencemag.org/cgi/content/full/1121356/dc1 Supporting Online Material for Polar PIN Localization Directs Auxin Flow in Plants Justyna Wiśniewska, Jian Xu, Daniela Seifertová, Philip B. Brewer, Kamil
Supplemental Data. Yang et al. (2012). Plant Cell /tpc
. Plant Cell /tpc") Supplemental Figure 1. Mature flowers of P. heterotricha. (A) An inflorescence of P. heterotricha showing the front view of a zygomorphic flower characterized by two small dorsal petals and only two fertile
Supplemental Figure 1. Mature flowers of P. heterotricha. (A) An inflorescence of P. heterotricha showing the front view of a zygomorphic flower characterized by two small dorsal petals and only two fertile
Nature Genetics: doi: /ng Supplementary Figure 1. Icm/Dot secretion system region I in 41 Legionella species.
 Supplementary Figure 1 Icm/Dot secretion system region I in 41 Legionella species. Homologs of the effector-coding gene lega15 (orange) were found within Icm/Dot region I in 13 Legionella species. In four
. Supplementary Information
 . Supplementary Information Supplementary Figure S1. Mature embryo sac observations. Supplementary Figure S2. STT observations. Supplementary Figure S3. Comparison of the PTB1 cdna with that of the mutant.
Regulatory Change in YABBY-like Transcription Factor Led to Evolution of Extreme Fruit Size during Tomato Domestication
 SUPPORTING ONLINE MATERIALS Regulatory Change in YABBY-like Transcription Factor Led to Evolution of Extreme Fruit Size during Tomato Domestication Bin Cong, Luz Barrero, & Steven Tanksley 1 SUPPORTING
Supplemental Data. Fernández-Calvo et al. Plant Cell. (2011) /tpc
 /tpc") Supplemental Data. Fernández-Calvo et al. Plant Cell. (2011). 10.1105/tpc.110.080788 Supplemental Figure S1. Phylogenetic tree of MYC2-related proteins from Arabidopsis and other plants. Phenogram representation
Supplemental Data. Fernández-Calvo et al. Plant Cell. (2011). 10.1105/tpc.110.080788 Supplemental Figure S1. Phylogenetic tree of MYC2-related proteins from Arabidopsis and other plants. Phenogram representation
CONSTANS is a photoperiod regulated activator of flowering in sorghum
 Yang et al. BMC Plant Biology 2014, 14:148 RESEARCH ARTICLE Open Access CONSTANS is a photoperiod regulated activator of flowering in sorghum Shanshan Yang, Brock D Weers, Daryl T Morishige and John E
Ethylene is critical to the maintenance of primary root growth and Fe. homeostasis under Fe stress in Arabidopsis
 Ethylene is critical to the maintenance of primary root growth and Fe homeostasis under Fe stress in Arabidopsis Guangjie Li, Weifeng Xu, Herbert J. Kronzucker, Weiming Shi * Supplementary Data Supplementary
Classical Selection, Balancing Selection, and Neutral Mutations
 Classical Selection, Balancing Selection, and Neutral Mutations Classical Selection Perspective of the Fate of Mutations All mutations are EITHER beneficial or deleterious o Beneficial mutations are selected
Evolution of phenotypic traits
 Quantitative genetics Evolution of phenotypic traits Very few phenotypic traits are controlled by one locus, as in our previous discussion of genetics and evolution Quantitative genetics considers characters
Supplementary Figure 1. Nature Genetics: doi: /ng.3848
 Supplementary Figure 1 Phenotypes and epigenetic properties of Fab2L flies. A- Phenotypic classification based on eye pigment levels in Fab2L male (orange bars) and female (yellow bars) flies (n>150).
Title. CitationBMC Plant Biology, 13. Issue Date Doc URL. Rights(URL)
") Title Genetic variation in four maturity genes affects pho of soybean Xu, Meilan; Xu, Zeheng; Liu, Baohui; Kong, Fanjiang; Author(s) Harada, Kyuya; Kanazawa, Akira; Yamada, Testuya; Abe CitationBMC Plant
Title Genetic variation in four maturity genes affects pho of soybean Xu, Meilan; Xu, Zeheng; Liu, Baohui; Kong, Fanjiang; Author(s) Harada, Kyuya; Kanazawa, Akira; Yamada, Testuya; Abe CitationBMC Plant
SUPPLEMENTARY INFORMATION
 DOI: 10.1038/ncb3267 Supplementary Figure 1 A group of genes required for formation or orientation of annular F-actin bundles and aecm ridges: RNAi phenotypes and their validation by standard mutations.
Development 143: doi: /dev : Supplementary information
 Supplementary Materials and Methods Plant materials The mutants and transgenic plants used in the present study were as follows: E361 (from Alex Webb s laboratory); tmm-1, ptmm::tmm-gfp and flp-1 (from
Unit 3 - Molecular Biology & Genetics - Review Packet
 Name Date Hour Unit 3 - Molecular Biology & Genetics - Review Packet True / False Questions - Indicate True or False for the following statements. 1. Eye color, hair color and the shape of your ears can
Genetics (patterns of inheritance)
") MENDELIAN GENETICS branch of biology that studies how genetic characteristics are inherited MENDELIAN GENETICS Gregory Mendel, an Augustinian monk (1822-1884), was the first who systematically studied
MENDELIAN GENETICS branch of biology that studies how genetic characteristics are inherited MENDELIAN GENETICS Gregory Mendel, an Augustinian monk (1822-1884), was the first who systematically studied
Gene Duplication and the Evolution of Photoperiodic Flowering in Helianthus annuus
 Gene Duplication and the Evolution of Photoperiodic Flowering in Helianthus annuus Benjamin Blackman 1, Scott Michaels 2, Loren Rieseberg 3 1 Duke University, Box 90338, Durham, NC 27701, USA, bkb7@duke.edu
The phenotype of this worm is wild type. When both genes are mutant: The phenotype of this worm is double mutant Dpy and Unc phenotype.
 Series 2: Cross Diagrams - Complementation There are two alleles for each trait in a diploid organism In C. elegans gene symbols are ALWAYS italicized. To represent two different genes on the same chromosome:
Epigenetics and Flowering Any potentially stable and heritable change in gene expression that occurs without a change in DNA sequence
 Epigenetics and Flowering Any potentially stable and heritable change in gene expression that occurs without a change in DNA sequence www.plantcell.org/cgi/doi/10.1105/tpc.110.tt0110 Epigenetics Usually
Lipid transfer proteins confer resistance to trichothecenes
 Lipid transfer proteins confer resistance to trichothecenes John McLaughlin and Anwar Bin-Umer Tumer Laboratory National Fusarium Head Blight Forum December 6th, 2012 FY09-11: Identify trichothecene resistance
Heterosis and inbreeding depression of epigenetic Arabidopsis hybrids
 Heterosis and inbreeding depression of epigenetic Arabidopsis hybrids Plant growth conditions The soil was a 1:1 v/v mixture of loamy soil and organic compost. Initial soil water content was determined
Supplemental Figures. Supplemental Data. Sugliani et al. Plant Cell (2016) /tpc Clades RSH1. Rsh1[HS] RSH2 RSH3. Rsh4[HS] HYD TGS ACT
![Supplemental Figures. Supplemental Data. Sugliani et al. Plant Cell (2016) /tpc Clades RSH1. Rsh1[HS] RSH2 RSH3. Rsh4[HS] HYD TGS ACT](/thumbs/81/84002827.jpg "Supplemental Figures. Supplemental Data. Sugliani et al. Plant Cell (2016) /tpc Clades RSH1. Rsh1[HS] RSH2 RSH3. Rsh4[HS] HYD TGS ACT") Supplemental Figures Clades RSH1 TP - HYD TGS ACT Rsh1[HS] RSH2 TP HYD SYN TGS Rsh2[HS] RSH3 TP HYD SYN TGS CRSH TP - SYN EFh Rsh4[HS] Supplemental Figure 1. Arabidopsis RSH domain structure. Schematic
Supplemental Figures Clades RSH1 TP - HYD TGS ACT Rsh1[HS] RSH2 TP HYD SYN TGS Rsh2[HS] RSH3 TP HYD SYN TGS CRSH TP - SYN EFh Rsh4[HS] Supplemental Figure 1. Arabidopsis RSH domain structure. Schematic
SUPPLEMENTARY INFORMATION
 Figure S1. Haploid plant produced by centromere-mediated genome elimination Chromosomes containing altered CENH3 in their centromeres (green dots) are eliminated after fertilization in a cross to wild
SoyBase, the USDA-ARS Soybean Genetics and Genomics Database
 SoyBase, the USDA-ARS Soybean Genetics and Genomics Database David Grant Victoria Carollo Blake Steven B. Cannon Kevin Feeley Rex T. Nelson Nathan Weeks SoyBase Site Map and Navigation Video Tutorials:
Penghui Li, Beibei Chen, Gaoyang Zhang, Longxiang Chen, Qiang Dong, Jiangqi Wen, Kirankumar S. Mysore and Jian Zhao
 New Phytologist Supporting Information Regulation of anthocyanin and proanthocyanidin biosynthesis by Medicago truncatula bhlh transcription factor MtTT8 Penghui Li, Beibei Chen, Gaoyang Zhang, Longxiang
Name Class Date. KEY CONCEPT Gametes have half the number of chromosomes that body cells have.
 Section 1: Chromosomes and Meiosis KEY CONCEPT Gametes have half the number of chromosomes that body cells have. VOCABULARY somatic cell autosome fertilization gamete sex chromosome diploid homologous
Supplementary Figure 1. Phenotype of the HI strain.
 Supplementary Figure 1. Phenotype of the HI strain. (A) Phenotype of the HI and wild type plant after flowering (~1month). Wild type plant is tall with well elongated inflorescence. All four HI plants
Life Cycles, Meiosis and Genetic Variability24/02/2015 2:26 PM
 Life Cycles, Meiosis and Genetic Variability iclicker: 1. A chromosome just before mitosis contains two double stranded DNA molecules. 2. This replicated chromosome contains DNA from only one of your parents
Wheat Genetics and Molecular Genetics: Past and Future. Graham Moore
 Wheat Genetics and Molecular Genetics: Past and Future Graham Moore 1960s onwards Wheat traits genetically dissected Chromosome pairing and exchange (Ph1) Height (Rht) Vernalisation (Vrn1) Photoperiodism
Exam 1 PBG430/
 1 Exam 1 PBG430/530 2014 1. You read that the genome size of maize is 2,300 Mb and that in this species 2n = 20. This means that there are 2,300 Mb of DNA in a cell that is a. n (e.g. gamete) b. 2n (e.g.
DEVELOPMENT RESEARCH ARTICLE
 RESEARCH ARTICLE 1241 Development 133, 1241-1252 (2006) doi:10.1242/dev.02301 EARLY IN SHORT DAYS 1 (ESD1) encodes ACTIN-RELATED PROTEIN 6 (AtARP6), a putative component of chromatin remodelling complexes
Mutation, Selection, Gene Flow, Genetic Drift, and Nonrandom Mating Results in Evolution
 Mutation, Selection, Gene Flow, Genetic Drift, and Nonrandom Mating Results in Evolution 15.2 Intro In biology, evolution refers specifically to changes in the genetic makeup of populations over time.
Engineering light response pathways in crop plants for improved performance under high planting density
 Engineering light response pathways in crop plants for improved performance under high planting density Tom Brutnell Boyce Thompson Institute for Plant Research Cornell University, Ithaca NY 6000 years
Lecture 22: Signatures of Selection and Introduction to Linkage Disequilibrium. November 12, 2012
 Lecture 22: Signatures of Selection and Introduction to Linkage Disequilibrium November 12, 2012 Last Time Sequence data and quantification of variation Infinite sites model Nucleotide diversity (π) Sequence-based
Arabidopsis COMPASS-Like Complexes Mediate Histone H3 Lysine-4 Trimethylation to Control Floral Transition and Plant Development
 Arabidopsis COMPASS-Like Complexes Mediate Histone H3 Lysine-4 Trimethylation to Control Floral Transition and Plant Development Danhua Jiang 1,2, Nicholas C. Kong 1,2, Xiaofeng Gu 2, Zicong Li 1, Yuehui
Awide range of natural variation for flowering time
 Copyright Ó 2006 by the Genetics Society of America DOI: 10.1534/genetics.105.050500 Substitution Mapping of dth1.1, a Flowering-Time Quantitative Trait Locus (QTL) Associated With Transgressive Variation
7.06 Problem Set #4, Spring 2005
 7.06 Problem Set #4, Spring 2005 1. You re doing a mutant hunt in S. cerevisiae (budding yeast), looking for temperaturesensitive mutants that are defective in the cell cycle. You discover a mutant strain
GENETIC CONTROL OF FLOWERING TIME IN ARABIDOPSIS
 Annu. Rev. Plant Physiol. Plant Mol. Biol. 1998. 49:345 70 Copyright c 1998 by Annual Reviews. All rights reserved GENETIC CONTROL OF FLOWERING TIME IN ARABIDOPSIS Maarten Koornneef, Carlos Alonso-Blanco,
SUPPLEMENTARY INFORMATION
 Supplementary Discussion Rationale for using maternal ythdf2 -/- mutants as study subject To study the genetic basis of the embryonic developmental delay that we observed, we crossed fish with different
Sequence variation and functional analysis of a FRIGIDA orthologue (BnaA3.FRI) in Brassica napus
 in Brassica napus") Yi et al. BMC Plant Biology (2018) 18:32 https://doi.org/10.1186/s12870-018-1253-1 RESEARCH ARTICLE Open Access Sequence variation and functional analysis of a FRIGIDA orthologue (BnaA3.FRI) in Brassica
Yi et al. BMC Plant Biology (2018) 18:32 https://doi.org/10.1186/s12870-018-1253-1 RESEARCH ARTICLE Open Access Sequence variation and functional analysis of a FRIGIDA orthologue (BnaA3.FRI) in Brassica
** LCA LCN PCA
 % of wild type value % of wild type value a 12 1 8 2 b 12 1 8 2 LCA LCN PCA Col- sod3-1 Supplementary Figure 1 sod3-1 influences cell proliferation. (a) Fifth leaf cell area (LCA) and leaf cell number
Unit 2 Lesson 4 - Heredity. 7 th Grade Cells and Heredity (Mod A) Unit 2 Lesson 4 - Heredity
 Unit 2 Lesson 4 - Heredity") Unit 2 Lesson 4 - Heredity 7 th Grade Cells and Heredity (Mod A) Unit 2 Lesson 4 - Heredity Give Peas a Chance What is heredity? Traits, such as hair color, result from the information stored in genetic
Unit 2 Lesson 4 - Heredity 7 th Grade Cells and Heredity (Mod A) Unit 2 Lesson 4 - Heredity Give Peas a Chance What is heredity? Traits, such as hair color, result from the information stored in genetic
Cell Division and Genetics
 Name Date Cell Division and Genetics 1. Black fur is dominant over brown fur in a particular population of guinea pig. The genetic information that gives a guinea pig brown fur is described as having A.
HEREDITY: Objective: I can describe what heredity is because I can identify traits and characteristics
 Mendel and Heredity HEREDITY: SC.7.L.16.1 Understand and explain that every organism requires a set of instructions that specifies its traits, that this hereditary information. Objective: I can describe
Supporting Online Material
 1 Stomatal Patterning and Differentiation by Synergistic Interactions of Receptor Kinases Elena D. Shpak, Jessica Messmer McAbee, Lynn Jo Pillitteri, and Keiko U. Torii Supporting Online Material Material
23-. Shoot and root development depend on ratio of IAA/CK
 Balance of Hormones regulate growth and development Environmental factors regulate hormone levels light- e.g. phototropism gravity- e.g. gravitropism temperature Mode of action of each hormone 1. Signal
Supp- Figure 2 Confocal micrograph of N. benthamiana tissues transiently expressing 35S:YFP-PDCB1. PDCB1 was targeted to plasmodesmata (twin punctate
 Supplemental Data. Simpson et al. (009). n rabidopsis GPI-anchor plasmodesmal neck protein with callosebinding activity and potential to regulate cell-to-cell trafficking. 5 0 stack Supp- Figure Confocal
Principles of Genetics
 Principles of Genetics Snustad, D ISBN-13: 9780470903599 Table of Contents C H A P T E R 1 The Science of Genetics 1 An Invitation 2 Three Great Milestones in Genetics 2 DNA as the Genetic Material 6 Genetics
A MicroRNA as a Translational Repressor of APETALA2 in Arabidopsis Flower Development
 A MicroRNA as a Translational Repressor of APETALA2 in Arabidopsis Flower Development Xuemei Chen Waksman Institute, Rutgers University, Piscataway, NJ 08854, USA. E-mail: xuemei@waksman.rutgers.edu Plant
Cheng-Ruei Lee 1 *, Jill T. Anderson 2, Thomas Mitchell-Olds 1,3. Abstract. Introduction
 Unifying Genetic Canalization, Genetic Constraint, and Genotype-by-Environment Interaction: QTL by Genomic Background by Environment Interaction of Flowering Time in Boechera stricta Cheng-Ruei Lee 1 *,
Mapping QTL to a phylogenetic tree
 Mapping QTL to a phylogenetic tree Karl W Broman Department of Biostatistics & Medical Informatics University of Wisconsin Madison www.biostat.wisc.edu/~kbroman Human vs mouse www.daviddeen.com 3 Intercross
Supplemental Figure 1. Phenotype of ProRGA:RGAd17 plants under long day
 Supplemental Figure 1. Phenotype of ProRGA:RGAd17 plants under long day conditions. Photo was taken when the wild type plant started to bolt. Scale bar represents 1 cm. Supplemental Figure 2. Flowering
Biol. 303 EXAM I 9/22/08 Name
 Biol. 303 EXAM I 9/22/08 Name -------------------------------------------------------------------------------------------------------------- This exam consists of 40 multiple choice questions worth 2.5
GSBHSRSBRSRRk IZTI/^Q. LlML. I Iv^O IV I I I FROM GENES TO GENOMES ^^^H*" ^^^^J*^ ill! BQPIP. illt. goidbkc. itip31. li4»twlil FIFTH EDITION
 FIFTH EDITION IV I ^HHk ^ttm IZTI/^Q i I II MPHBBMWBBIHB '-llwmpbi^hbwm^^pfc ' GSBHSRSBRSRRk LlML I I \l 1MB ^HP'^^MMMP" jflp^^^^^^^^st I Iv^O FROM GENES TO GENOMES %^MiM^PM^^MWi99Mi$9i0^^ ^^^^^^^^^^^^^V^^^fii^^t^i^^^^^
SOMNUS, a CCCH-Type Zinc Finger Protein in Arabidopsis, Negatively Regulates Light-Dependent Seed Germination Downstream of PIL5 W
 The Plant Cell, Vol. 20: 1260 1277, May 2008, www.plantcell.org ª 2008 American Society of Plant Biologists SOMNUS, a CCCH-Type Zinc Finger Protein in Arabidopsis, Negatively Regulates Light-Dependent
NATURALLY OCCURRING GENETIC VARIATION IN ARABIDOPSIS THALIANA
 Annu. Rev. Plant Biol. 2004. 55:141 72 doi: 10.1146/annurev.arplant.55.031903.141605 Copyright c 2004 by Annual Reviews. All rights reserved First published online as a Review in Advance on December 12,
Leucine-rich repeat receptor-like kinases (LRR-RLKs), HAESA, ERECTA-family
, HAESA, ERECTA-family") Leucine-rich repeat receptor-like kinases (LRR-RLKs), HAESA, ERECTA-family GENES & DEVELOPMENT (2000) 14: 108 117 INTRODUCTION Flower Diagram INTRODUCTION Abscission In plant, the process by which a plant
Leucine-rich repeat receptor-like kinases (LRR-RLKs), HAESA, ERECTA-family GENES & DEVELOPMENT (2000) 14: 108 117 INTRODUCTION Flower Diagram INTRODUCTION Abscission In plant, the process by which a plant
Processes of Evolution
 15 Processes of Evolution Forces of Evolution Concept 15.4 Selection Can Be Stabilizing, Directional, or Disruptive Natural selection can act on quantitative traits in three ways: Stabilizing selection
The Chromosomal Basis of Inheritance
 The Chromosomal Basis of Inheritance Mitosis and meiosis were first described in the late 800s. The chromosome theory of inheritance states: Mendelian genes have specific loci (positions) on chromosomes.
A comparison of candidate gene-based and genotyping-by-sequencing (GBS) approaches to trait mapping in Gossypium barbadense L.
 approaches to trait mapping in Gossypium barbadense L.") A comparison of candidate gene-based and genotyping-by-sequencing (GBS) approaches to trait mapping in Gossypium barbadense L. Authors Carla Jo Logan-Young. Texas A&M University. College Station, TX. United
A comparison of candidate gene-based and genotyping-by-sequencing (GBS) approaches to trait mapping in Gossypium barbadense L. Authors Carla Jo Logan-Young. Texas A&M University. College Station, TX. United
Quantitative characters
 Quantitative characters Joe Felsenstein GENOME 453, Autumn 015 Quantitative characters p.1/38 A random mating population with two genes having alleles each, at equal frequencies, symmetrically affecting
The basal-branching pea mutant rms7-1
 Morris, S.E., Beveridge, C.A., Murfet, I.C, Prioul, S. and Rameau, C. The basal-branching pea mutant rms7-1 Australian Res. Council Cent, of Excellence for Integrative Legume Res., and School of Life Sci.
Duplication of an upstream silencer of FZP increases grain yield in rice
 SUPPLEMENTARY INFORMATION Articles https://doi.org/10.1038/s41477-017-0042-4 In the format provided by the authors and unedited. Duplication of an upstream silencer of FZP increases grain yield in rice
Supplementary Tables and Figures
 Supplementary Tables Supplementary Tables and Figures Supplementary Table 1: Tumor types and samples analyzed. Supplementary Table 2: Genes analyzed here. Supplementary Table 3: Statistically significant
Meiosis and Mendel. Chapter 6
 Meiosis and Mendel Chapter 6 6.1 CHROMOSOMES AND MEIOSIS Key Concept Gametes have half the number of chromosomes that body cells have. Body Cells vs. Gametes You have body cells and gametes body cells
Analysis of regulatory function of circadian clock. on photoreceptor gene expression
 Thesis of Ph.D. dissertation Analysis of regulatory function of circadian clock on photoreceptor gene expression Tóth Réka Supervisor: Dr. Ferenc Nagy Biological Research Center of the Hungarian Academy
SUPPLEMENTARY INFORMATION
 Supplemental Methods Isolation and mapping of SPCH An EMS-mutagenized population of tmm-1 (Col);E1728 (an enhancer trap GFP marking guard cells) was created. M2 seeds were collected from M1 s planted in
Quantitative characters
 Quantitative characters Joe Felsenstein GENOME 453, Autumn 013 Quantitative characters p.1/38 A random mating population with two genes having alleles each, at equal frequencies, symmetrically affecting