HEREFORDSHIRE COUNCIL
|
|
|
- Geoffrey Hawkins
- 5 years ago
- Views:
Transcription
1 HEREFORDSHIRE COUNCIL SOUTH WYE TRANSPORT PACKAGE RESPONSE TO COMMENTS FROM THE DEPARTMENT FOR TRANSPORT ON MODEL DEVELOPMENT AND VALIDATION REPORT JANUARY 2016 PROJECT NUMBER DOCUMENT REFERENCE FINAL BP-HHR TPV-0002 PREPARED BY xxxxxxxxx 15 JANUARY 2016 AGREED BY xxxxxxxx 15 JANUARY 2016 APPROVED FOR ISSUE BY xxxxxxxx / xxxxxxx 15 JANUARY INTRODUCTION 1.1. BACKGROUND WSP Parsons Brinckerhoff (WSP PB) has been commissioned by Balfour Beatty Living Places/Hereford Council (HC) to update the highway assignment model part of the Hereford Multi Modal Transport Model (HMMTM) and create a new Hereford Transport Model (HTM). This was completed in October 2015 and documented in the South Wye Transport Package Model Development and Validation Report (MDVR). Following completion of the HTM, the reporting was submitted to the Department for Transport (DfT) for consideration The purpose of this technical note is to respond to the comments received from the DfT on the South Wye Transport Package Model Development and Validation Report (Reference: BP TPV-0001, dated October 2015). Comments were addressed from three different sources, identified below, each source has been treated independently and where comments have been repeated they have been cross referenced to the appropriate section of this technical note. From (main text): xxxxxxx (WSP PB) to xxxxxx (Head of Modelling, Local Economics, DfT), Retained Scheme South Wye Transport Package_LMVR and ASR, 14 October 17:11; From (main text): xxxxx (Head of Modelling, Local Economics, DfT) to xxxxxxx (WSP PB), South Wye comments on LMVR report, 30 October 12:24; and From (attachment: comments on model development lmvr-south Wye docx): xxxxxxx (Head of Modelling, Local Economics, DfT) to xxxxxxxx (WSP PB), South Wye comments on LMVR report, 30 October 12: Rather than reproduce the MDVR, this technical note should be treated as an addendum to the original report.
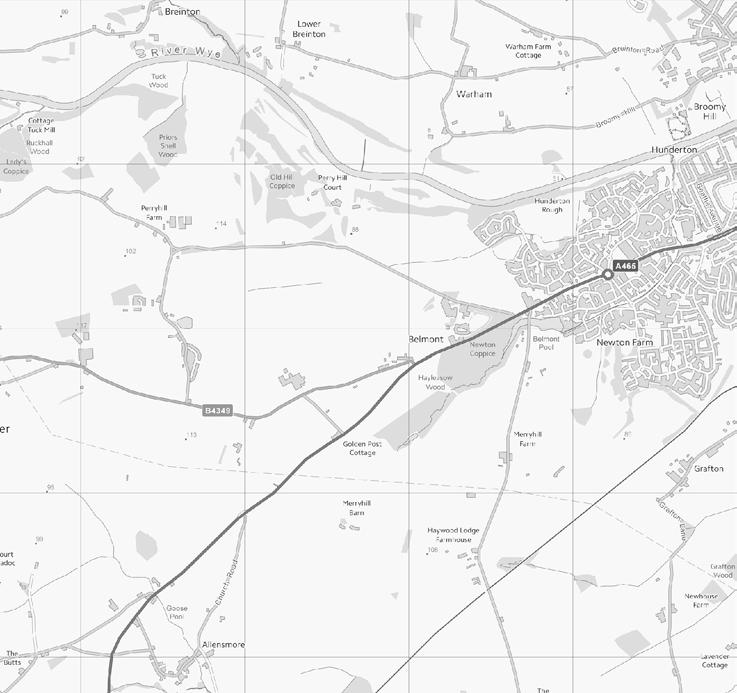
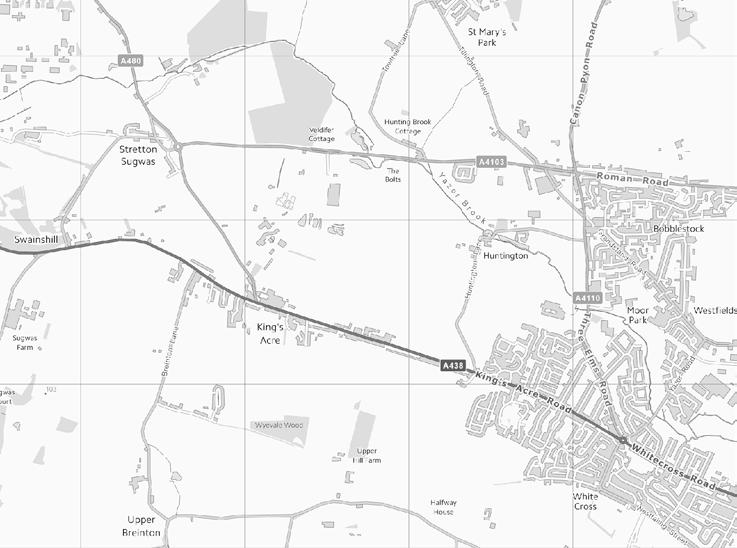
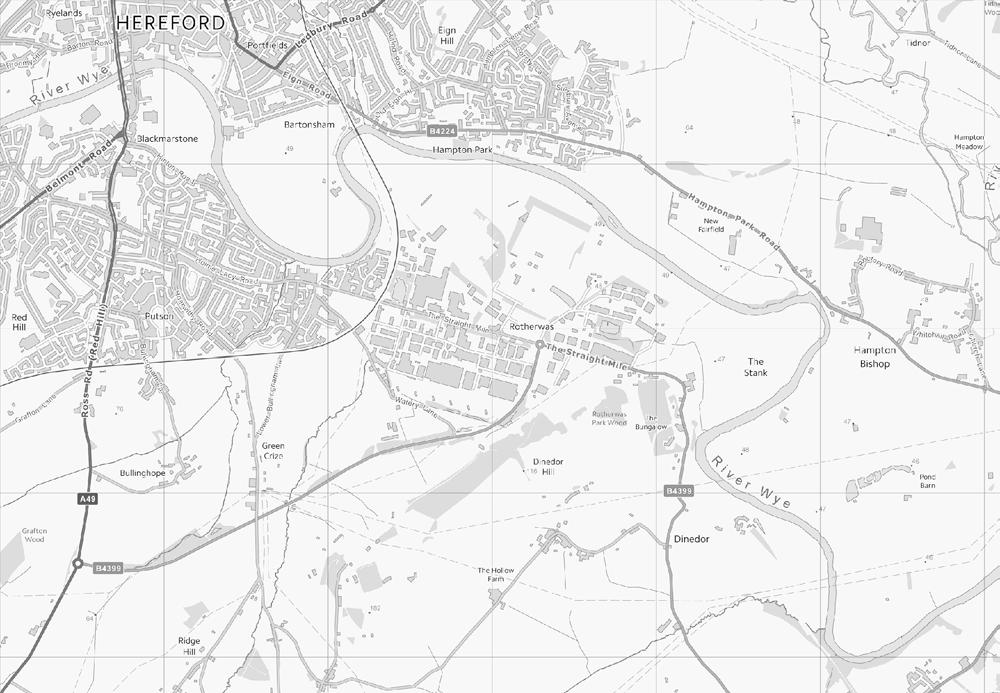
2 2. FROM (MAIN TEXT): xxxxxxxxxx (WSP PB) TO xxxxxxx (HEAD OF MODELLING, LOCAL ECONOMICS, DFT), RETAINED SCHEME SOUTH WYE TRANSPORT PACKAGE_LMVR AND ASR, 14 OCTOBER 17: POINT #1 FROM As per the LMVR, the proposed Southern Link Road (SLR) is currently at the very edge of the proposed modelled area. DfT wanted HC s consultant to review and confirm that the proposed modelled network is able to capture the impacts on the appropriate modelled network given the SLR is on the edge of the modelled area The simulation network within the HTM covers all of the used routes to the south of Hereford; a plan of the modelled road network has been included in Appendix A of this technical note. But specifically, the simulation network includes all the main routes which cross the railway line between Tram Inn and the A49 in Redhill. The network beyond the urban edge of Hereford is sparse with little route choice. There are no further roads which will have any level of strategic reassignment on the network which are not included in the model. The MDVR demonstrates the calibration/validation of the model on the main roads (A49 and A465) in the south of the model as shown on Map 2-2 in the following locations: Ruckhall Lane; B4349 to Clehonger; A465 (south of the junction with the B4349); The route (lane) linking Portway to the A465 south of the roundabout in Belmont; Grafton Lane; and Roundabout junction linking the A49 (Ross Road) with the B As the model flows fit with the calibration/validation criteria in all these locations we can confirm the model is able to capture the impacts of the SLR even though it is on the edge of the simulation network POINT #2 FROM LMVR to make a distinction between the data used for validation and calibration, particularly with regards to Map 2-2 Location of Link and Junction counts on Page A map has been prepared and included in Appendix B showing the location of the link and junction counts identifying the counts used for model calibration and validation purposes POINT #3 FROM DfT suggested WSP PB to explore the possibility of having a screen line in the vicinity of the proposed SLR. 2 / 12
3 We have looked into this on the basis of the data available and a screen line can be produced. The results are summarised in the table below and the location of the screen line is identified in Appendix C. The model shows a good level of validation in this area of the model although it should be noted there is a lack of observed traffic data for Grafton Lane. However, it is not considered that this compromises the robustness of the model. AM Interpeak PM Inbound Observed screen line flow 1, Modelled Screen line flow Absolute difference Relative difference -7% -11% -4% GEH Outbound Observed screen line flow 1, ,002 Modelled Screen line flow ,050 Absolute difference Relative difference -16% -18% 5% GEH The summary table includes traffic flow data from five sites and shows the modelled flows are a fair representation of the split of trips across these routes in/out of Hereford in the vicinity of the Southern Link Road. Further details of the screen line validation have been included in Appendix D POINT #4 FROM With regards to matrix calibration comparisons (Table 6.6, Table 6.7), DfT suggested further analysis, with regards to sectors 1 to 4 within Hereford Centre, needs to be presented in the LMVR The derived base year trip matrices were then calibrated to the totals of counts on a number of cordons and screen lines in the model area, represented by the sector boundaries shown in Map 3-2 and 3-3 in the MDVR. The trip matrices were assigned to the updated model networks and select link assignments carried out for links corresponding to each of the count sites. The select link trip matrices were then summed to give matrices for each of the cordons and screen lines The corresponding origin-destination movements in the full matrices were then factored so that the total trips in the select link matrix portions were the same as the count totals. This was repeated for each cordon and screen line and 10 iterations of the process carried out so that the matrix totals converged to the count totals The differences between the initial and calibrated matrices were small, as shown in the tables attached as Appendix E. The small initial calibration changes validated the matrix building method using NTEM trip ends, the calibrated gravity model and the 2001 journey to work distribution POINT #5 FROM DfT confirmed with WSP PB about the overall approach to matrix rebuilding. DfT wanted to understand that the approach was primarily using NTEM, NTM and Census data for trip ends and use of gravity model for trip distribution compared to the use of traditional approach using RSI data Further details of the matrix build process have been addressed in Sections 3 and 4 of this technical note. 3 / 12
4 3. FROM (MAIN TEXT): xxxxxx [DfT] TO xxxxxxxxx [WSP], SOUTH WYE COMMENTS ON LMVR REPORT, 30 OCTOBER 12:24 We One of our main concerns is the approach used for matrix development. understand that SATURN model s prior matrix was built from gravity modelling using NTM, NTEM and Ctripend without using any of the survey data. This approach is not in line with WebTAG guidance. In order for us to understand the uncertainty and risks related to approach, it will be useful if you could demonstrate if the model is fit for purpose, especially in the following: 3.1. BULLET POINT #1 < Provide evidence that the matrix can reflect observed trip pattern and local demand such as using survey data such as RSI, ANPR, mobile phone data etc. < The use of census data- how the census data were used for matrix development? Any validity check on the key movements identified for the study area from raw census data. < The representation of vehicle composition, esp. the percentage of HGV on key routes in the study area is reasonable. < The modelling coverage it should present the scope of the impact of the new road and its competitive routes. Provide evidence that the matrix can reflect observed trip pattern and local demand such as using survey data such as RSI, ANPR, mobile phone data etc. 4 / 12
5 The trip matrix has been validated against TrafficMaster OD data, further details are provided in Section of this technical note. No other datasets exist, hence the need to adopt a matrix synthesising process The use of mobile phone data in the production of trip matrices is not yet proven. The DfT are currently assembling best practice into the use of mobile phone datasets for the purposes of developing trip matrices. Once this is completed this will then be used to inform the development of guidance for the incorporation into WebTAG. Given the programme for the development of the HTM model, it was not considered appropriate to pursue the use of mobile phone data in the development of the trip matrices The use of ANPR data for use in a model the size of the HTM is limited due its inability to provide any certainty where trips start and finish. ANPR Data collected from a cordon of cameras around the city would provide information regarding the number of trips passing into / out of the cordon but would not provide information regarding the destination within the cordon. A proportion of the trips would enter the cordon at one point and exit at another but information regarding their ultimate journey start and end points would not be available. For ANPR data to have been useful, a cordon around the whole of Hereford would have been required along with secondary and tertiary cameras to track movements within the city. The cost of collecting such data would have been prohibitive and disproportionate to the amount of useful information on trip patterns it would provide BULLET POINT #2 The use of census data- how the census data were used for matrix development? Any validity check on the key movements identified for the study area from raw census data This comment has been addressed in Section 4.5 of this technical note BULLET POINT #3 The representation of vehicle composition, esp. the percentage of HGV on key routes in the study area is reasonable The following tables demonstrate the representation of the vehicle composition and how the model reflects the percentage of HGVs across the cordons and screen lines. CORDON OR SCREEN LINE % DIFFERENCE BETWEEN OBSERVED AND MODELLED FLOWS NUMBER OF LINKS WHERE GEH < 4 AM IP PM AM IP PM Outer Cordon Inbound -10% -4% -40% 89% 100% 100% Outer Cordon Outbound -10% -9% -29% 89% 100% 100% Inner Cordon Inbound -21% -16% -35% 67% 89% 100% Inner Cordon Outbound +1% -22% -39% 89% 67% 89% East/West Screen line Eastbound -15% -30% -3% 83% 17% 17% East/West Screen line Westbound -22% -34% -40% 67% 67% 67% 5 / 12
6 Across the cordon and screen lines the representation of the volumes of HGVs is good, although the East/West screen line could be better with a poor distribution across the links but a good total number of HGVs crossing the screen line. The table shows large percentage differences, but this is due to the very low numbers of HGVs crossing the screen lines and cordons, therefore not compromising the robustness of the model A detailed report of the performance of individual links across the cordons and screen lines has been included in Appendix F. AM peak hour Interpeak hour PM peak hour CRITERION Flows to have GEH 5.0 or less Flows (<700pcu/h) to be within 100 pcu/h of observed Flows to have GEH 5.0 or less Flows (<700pcu/h) to be within 100 pcu/h of observed Flows to have GEH 5.0 or less Flows (<700pcu/h) to be within 100 pcu/h of observed NUMBER OF OBSERVATIONS ACHIEVING CRITERION PERCENTAGE ACHIEVING CRITERION 44 92% % 42 88% % 45 94% % When considering the performance of individual links within the model, but not on a cordon or screen line, the table above demonstrates that more than 85% of links across all three modelled periods meet the criterion for all flow validation when applied specifically for HGVs It is considered that the information in these tables demonstrates that the model has a reasonable representation of HGV patterns across the network, especially within the fully modelled area BULLET POINT #4 The modelling coverage it should present the scope of the impact of the new road and its competitive routes. 6 / 12
7 Further details of the model coverage are included in Section 2.1 of this technical note. To reiterate, the next alternative route within Hereford is a residential route which is heavily trafficked by local movements and further from Hereford the alternative routes are tortuous country lanes with small settlements. There are no further roads which will have any level of strategic reassignment on the network which are not included in the model. 4. FROM (ATTACHMENT: COMMENTS ON MODEL DEVELOPMENT LMVR-SOUTH WYE DOCX): xxxxxxxxx (HEAD OF MODELLING, LOCAL ECONOMICS, DEPARTMENT FOR TRANSPORT) TO xxxxxxxxxxxxx, SOUTH WYE COMMENTS ON LMVR REPORT, 30 OCTOBER 12: COMMENT #1: [CH. 3] SATURN MODEL ROAD NETWORK WAS NOT PROVIDED IN THE REPORT. THE SLR (SOUTH LINK ROAD) IS OUTSIDE THE DETAILED MODELLING AREA (MAP 3-1) Please ensure the modelling coverage is able to represent the proposed new road and its alternative routes Further details of the model coverage are included in Section 2.1 of this technical note. Any intention to demonstrate if the modelling coverage is robust using methods such as variable demand modelling? There is no intention to undertake variable demand modelling using the base year model. Consideration of variable demand modelling will be undertaken during the forecasting stage of the scheme assessment. It is unclear how variable demand modelling would inform the model coverage COMMENT #2: [CH. 3] 404 ZONES IN THE NEW ZONING SYSTEM AND 295 ZONES WITHIN HEREFORD. IT IS UNCLEAR ON HOW AGGREGATED DEMAND WERE DISAGGREGATE AT THE ZONAL LEVEL. Please explain on how tripend data were applied and split into the detailed zonal level for the study Details of how the new zone system was created are included in Chapter 6 of the MDVR Essentially, the land use inputs into the trip generation calculations are identified using Census data and AddressBase property classification data and grouped to the modelled zone system. The CTripEnd programme is used to generate the trips for each model zone. The aggregate total number of people, households and jobs are constrained at the TEMPRO zone level. Multiple model zones form a single TEMPRO zone This process is different to calculating the number of trips in a TEMPRO zone and then disaggregating across the modelled zones within the TEMPRO zone and is considered to be more accurate as it includes detailed information on the land uses and demographics within each modelled zone COMMENT #3: [CH. 6] SYNTHETIC MATRICES WERE USED FOR PRIOR MATRIX DEVELOPMENT USING CENSUS DATA 2001/2011, NTM AND CTRIPEND WHICH DOES NOT FOLLOW THE GUIDANCE IN WEBTAG. PLEASE PROVIDE DETAILED EVIDENCE ON NOT USING EXISTING SURVEY 7 / 12
8 DATA (PARA 6.1.2). ANY CONSIDERATION OF USING THE SURVEY DATA TO VALIDATE TRIP PATTERNS. The rationale and evidence for not following the guidance on matrix development, i.e. developing a fully synthesised prior matrix using NTEM, NTM and CTripEnd instead of using observed survey data such as RSI as recommended in WebTAG The collection of origin and destination data for the HMMTM focussed on using a combination of household, workplace, car park interview and automatic number plate recognition data. Roadside interview surveys were not undertaken Having reviewed the data collected for the development of the HMMTM, it was determined that much of the data had been processed and that the raw data was unavailable and/or details of the processing that had been undertaken were either inadequate or missing Therefore, the decision was made to synthesise the trip matrices using land use and demographic information to develop the prior matrices, then to use the traffic count data and journey times to calibrate and validate the model. The methodology adopted is common to that used by NTM as it combines demographic and employment data with trip rates. Early discussions took place with DfT colleague xxxxxxxxxxxxxxxx in autumn 2014 and this approach was verbally agreed in principle. According to WebTAG, TEMPRO tripend data should be used as the basis of trip growth rather than as absolute trips. Any evidence that the prior matrix can reasonably represent the local demand Sections 6.4 and 6.5 of the MDVR detail how the prior matrix produces a reasonable estimate of local demand based on the performance of the matrix in terms of sector to sector movements and movements crossing a series of screen lines. Please clarify which survey data (such as household survey, ANPR and employment survey) were used. Contradictory information was given in the scheme meeting on 13/10/2015 at DfT Details of the traffic count and journey time data used in model development can be found in Chapter 4 of the MDVR. The data includes Automatic Traffic Counts (ATCs), Manual Classified Counts (MCCs), journey time surveys, and Trafficmaster origin/destination data ATC data was used to inform the cordon / screenline calibration. The MCC turning count data was used to inform the matrix estimation procedure. The MCC link counts were used in the model validation. patterns were validated against Trafficmaster Origin/Destination data No origin and destination survey data was used in the production of the trip matrices for the HTM. Origin and destination data was collected for the HMMTM and used in the development of the highway assignment part of that model. A review of that data found it not fit for use in this modelling exercise as it had already been subject to post-collection processing and manipulation. 8 / 12
9 Roadside interviews would have provided a partial representation of travel demand and we would have had to synthesise the remainder of the trip matrix. If we had created a cordon around Hereford and conducted roadside interviews on the cordon, we would still have needed to synthesise all trip making within Hereford and 90% of the trips (assuming a 10% sample rate) passing each roadside interview location. Historic data has suggested that 40% of trips remain within Hereford, 40% are to/from Hereford and 20% of trips are through the City. This would mean we would need to synthesis 94% (40%+36%+18%) of trips in the model; the roadside interview data would directly provide 6% of trips The ability of ANPR to supplement the roadside interview data is very limited due to its inability to tell you where trips start and finish. See paragraph of this technical note for further details. Please suggest way in which demonstrate matrix is fit for purpose using evidence to confirm that the model can accurately reflect the underlying real trip pattern (such as using RSI, ANPR, mobile data, etc) particularly on the key strategic routes and those trips might be attracted to the new route External validation of the trip matrices produced has been undertaken using TrafficMaster OD data. Whilst the comparison can only be done at a bespoke sector level, it does provide confidence as to the representativeness of the highway assignment model Details of the sector to sector comparison are in Appendix F of the MDVR. The appendix shows that the majority of modelled sector to sector movements across the different modelled time periods and user classes are within 10% of the equivalent sector to sector movements observed with the TrafficMaster data COMMENT #4: [CH. 6] THE CALIBRATION OF GRAVITY MODEL For the calibration/validation of gravity model s parameters, the observed average costs/ trip length distribution are seemed to be from the previous developed SATURN model instead of observed data- please clarify. Please provide the rationale for this The local data was used in producing the matrices for the HMMTM and calibrating the gravity model to these has resulted in locally derived distribution parameters Deriving the distribution parameters for the gravity model from the trip matrices from the previous version of the model is similar to using the original origin and destination data. It could be regarded as more accurate as the matrices have been calibrated and validated COMMENT #5: [CH. 6] THE USE OF CENSUS DATA It is unclear how the Census 2001 and 2011 data were used. Concerns of using very old census data, esp Census data for the matrix development data was only used to estimate the proportion of intra-zonal trips for each zone and not for any part of estimating the land use inputs for the trip generation. It was not possible to derive the equivalent estimates from the Census 2011 datasets as the required level of disaggregation is no longer available. 9 / 12
10 The Census 2011 datasets were used to establish the relative proportions of the number of people (in 88 person types), number of households, number of jobs in 11 employment classifications and modal split indicators for the work and home ends of the trips all at the output area level (this is detailed in of the MDVR). Where the zone system is more detailed than output areas, classified address data was used to disaggregate people/households and jobs to this level. Please provide details on how the Census data were used in the model development and any validity check on the key movements identified from the census data. Please provide key movements identified from the Census data The example zones in Appendix G show how the input Census and AddressBase Data compare and how this corresponds to the trips generated in each zone. It can be seen that for the residential data, the total number of addresses in each output area closely corresponds with the Census 2011 data. In general the census figures are slightly lower which is likely due to a combination of non-responses and not all addresses being occupied. The HBW trip ends produced by the model generally correspond well with the 2011 Census travel to work data for each OA with 30-40% of the total car driver origins departing in the AM peak The examples also demonstrate how using the AddressBase data to subdivide land use inputs beyond Census level works to ensure sensible trip ends are generated for each zone. For example in zone where there are no residential zones there are also no home based trips generated The example zones also show how the employment data is used and the generated trip ends generally correspond well with the travel to work data, with approximately one third of the car driver trips arriving in the morning peak. As with the residential data, where the zone structure is finer than the workplace zone structure, the address data ensures that very few work trip ends are generated in purely residential areas like Zone COMMENT #6: [CH. 4] ME PROCESS AND MODEL VALIDATION LMVR to make a distinction between the data used for validation and calibration, particularly with regards to Map 2-2 Location of Link and Junction counts on Page Details of the link and junction counts used for the model calibration and validation are provided in Appendix B of this technical note. Matrix estimation seems to use both ATC and MCC. It is unclear if the MCC single day counts were adjusted to average day counts. Please confirm The MCCs were single day counts and not adjusted to average day counts. The counts were factored for model development purposes from vehicles to Passenger Car Units (PCUs). It would be useful to provide validation details in the area of most interest (i.e. routes adjacent parallel to the scheme) and demonstrate model s fit in the area (with the use of screen lines if possible). 10 / 12
11 Full details of all the calibration and validation points in the vicinity of the scheme are provided in Appendices D and I in the MDVR. A further validation screen line parallel to the scheme has been reported in Section 2.3 of this technical note. There are no roads that can be considered parallel to the scheme. Matrix calibration comparisons (Table 6.6, Table 6.7) considerate changes at sector level post ME, esp. sectors 1 to 4 within Hereford Centre. Please examine and any adjustments are required. What are the possible impact on the underlying trip pattern and appraisals? Further information on the initial matrix calibration of sectors 1 to 4 within Hereford is included in Section 2.4 of this technical report Any evidence on model s representation of vehicle composition, esp. on HGV % as the new road and existing route are intended to be used for HGV in addition to other vehicles Further information on the representation of HGVs in the model is provided in Section 3.3 of this technical note COMMENT #7: [CH. 4 PAGE 19] LACK OF INFORMATION ON JOURNEY TIME SURVEYS Please provide information on sample size, standard deviation, etc as well as date of collection The journey time survey data was collected for the HMMTM in 2012, summary details including information on average free flow and delayed travel times, standard deviations and sample sizes has been included as Appendix H. 5. SUMMARY AND CONCLUSIONS 5.1. SUMMARY This technical note should be considered as an addendum to the original South Wye Transport Package Model Development and Validation Report produced in October From the various comments received, there are a couple of common themes that this technical note has sought to address, namely: Further information on the development of the trip matrices as the approach does not conform to current WebTAG guidance; further information on the performance on the model in the vicinity of the scheme, as the scheme is on the edge of the fully modelled area; and further information on the model s representation of HGV traffic Additional information has been provided: that explains the trip matrix development in more detail and demonstrates that the matrices produced are a reasonable representation of the demand for travel on the highway network within the fully modelled area; that demonstrates that the model is suitable for assessing the impact of the South Wye Transport Package, albeit that the highway scheme is on the edge of the Hereford urban area. The other measures which make up the transport package are aimed at travel from the south west of Hereford to/from the city centre and are within the fully modelled area; and 11 / 12
12 that demonstrates that the transport model has a reasonable representation of HGV trips CONCLUSION This technical note should be treated as an addendum to the original South Wye Transport Package Model Development and Validation Report The content of this technical note has addressed all the comments received from the Department for Transport and adds to the South Wye Transport Package Model Development and Validation Report in demonstrating that the Hereford Transport Model is a robust and suitable tool for assessing this stage of the South Wye Transport Package business case. 12 / 12
13 Appendix A PLAN OF MODELLED HIGHWAY NETWORK

14 A4110 A49 A4112 A4111 A4110 A49 A465 B4352 A465 B4349 SLR A466 A4172 A465 A49 A449 A49 A466 A4137 A40
15
16 Appendix B PLAN OF TRAFFIC COUNTS USED FOR MODEL CALIBRATION AND VALIDATION

17 Junction Calibration Link Validation km
18 Appendix C REVISED PLAN OF CORDONS AND SCREENLINES
19
20 Appendix D FULL DETAILED TABLE FOR NEW VALIDATION SCREEN LINE SOUTH OF THE SOUTHERN LINK ROAD
21 Peak Link Direction Count Modelled Dif (%) Dif (Abs) GEH Haywood Lane Inbound % A465 (south west of B4349) Inbound % B4349 Clehonger Road Inbound % B4399 to A49 (N) Inbound % A49 (S) to A49 (N) Inbound % Inbound 1, % Haywood Lane Outbound % A465 (south west of B4349) Outbound % B4349 Clehonger Road Outbound % A49 (N) to B4399 Outbound % B4399 to A49 (S) Outbound % Outbound 1, % Two-Way 2,044 1,811-11% Haywood Lane Inbound % A465 (south west of B4349) Inbound % B4349 Clehonger Road Inbound % B4399 to A49 (N) Inbound % A49 (S) to A49 (N) Inbound % Inbound % Haywood Lane Outbound % A465 (south west of B4349) Outbound % B4349 Clehonger Road Outbound % A49 (N) to B4399 Outbound % B4399 to A49 (S) Outbound % Outbound % Two-Way 1,202 1,023-15% Haywood Lane Inbound % A465 (south west of B4349) Inbound % B4349 Clehonger Road Inbound % B4399 to A49 (N) Inbound % A49 (S) to A49 (N) Inbound % Inbound % Haywood Lane Outbound % A465 (south west of B4349) Outbound % B4349 Clehonger Road Outbound % A49 (N) to B4399 Outbound % B4399 to A49 (S) Outbound % Outbound 1,002 1,050 5% Two-Way 1,918 1,932 1% AM peak hour Interpeak hour PM peak hour
22 Appendix E INITIAL MATRIX CALIBRATION TABLES
23
24 Appendix F FULL DETAILED HGV CALIBRATION ACROSS CORDONS AND SCREEN LINES
25 AM PEAK SCREEN LINE CALIBRATION Diff Diff Count Modelled Hereford Outer Cordon (Inbound) (%) (Abs) GEH 1 A49 Ross Road % A49 Holmer Road % A465 Belmont Road % A438 Kings Acre Road % A4110 Three Elms Road % A465 Aylestone Hill % A438 Ledbury Road % B4224 Hampton Park Road % Holme Lacy Road % % Hereford Outer Cordon (Outbound) 1 A49 Ross Road % A49 Holmer Road % A465 Belmont Road % A438 Kings Acre Road % A4110 Three Elms Road % A465 Aylestone Hill % A438 Ledbury Road % B4224 Hampton Park Road % Holme Lacy Road % % Two-way % Hereford Inner Cordon (Inbound) 1 Barton Road % A438 Eign Street % A49 Newtown Road % College Road % A465 Aylestone Hill % A438 Ledbury Road % B4224 Eign Road % St Martins Street % A49 Greyfriars Bridge % % Hereford Inner Cordon (Outbound) 1 Barton Road % A438 Eign Street % A49 Newtown Road % College Road % A465 Aylestone Hill % A438 Ledbury Road % B4224 Eign Road % St Martins Street 0 0 0% A49 Greyfriars Bridge % % Two-way % Hereford East/ West Screenline (Eastbound) 1 B4399 Rotherwas Access Road % Holme Lacy Road % A438 Newmarket Street Eastbound % A49 Newtown Rd Eastbound % A4103 Roman Rd % Hinton Road/Ross Road % % Hereford East/ West Screenline (Westbound) 1 B4399 Rotherwas Access Road % Holme Lacy Road % A438 Newmarket Street Eastbound % A49 Newtown Rd Eastbound % A4103 Roman Rd % Hinton Road/Ross Road % % Two-way %
26 PM PEAK SCREEN LINE CALIBRATION Diff Diff Count Modelled Hereford Outer Cordon (Inbound) (%) (Abs) GEH 1 A49 Ross Road % A49 Holmer Road % A465 Belmont Road % A438 Kings Acre Road % A4110 Three Elms Road % A465 Aylestone Hill % A438 Ledbury Road % B4224 Hampton Park Road % Holme Lacy Road % % Hereford Outer Cordon (Outbound) 1 A49 Ross Road % A49 Holmer Road % A465 Belmont Road % A438 Kings Acre Road % A4110 Three Elms Road % A465 Aylestone Hill % A438 Ledbury Road % B4224 Hampton Park Road % Holme Lacy Road % % Two-way % Hereford Inner Cordon (Inbound) 1 Barton Road % A438 Eign Street % A49 Newtown Road % College Road 0 0 0% A465 Aylestone Hill % A438 Ledbury Road % B4224 Eign Road % St Martins Street 0 0 0% A49 Greyfriars Bridge % % Hereford Inner Cordon (Outbound) 1 Barton Road % A438 Eign Street % A49 Newtown Road % College Road 0 0 0% A465 Aylestone Hill % A438 Ledbury Road % B4224 Eign Road % St Martins Street 0 0 0% A49 Greyfriars Bridge % % Two-way % Hereford East/ West Screenline (Eastbound) 1 B4399 Rotherwas Access Road % Holme Lacy Road % A438 Newmarket Street Eastbound % A49 Newtown Rd Eastbound % A4103 Roman Rd % Hinton Road/Ross Road % % Hereford East/ West Screenline (Westbound) 0 1 B4399 Rotherwas Access Road % Holme Lacy Road % A438 Newmarket Street Eastbound % A49 Newtown Rd Eastbound % A4103 Roman Rd % Hinton Road/Ross Road % % Two-way %
27 IP PEAK SCREEN LINE CALIBRATION Diff Diff Count Modelled Hereford Outer Cordon (Inbound) (%) (Abs) GEH 1 A49 Ross Road % A49 Holmer Road % A465 Belmont Road % A438 Kings Acre Road % A4110 Three Elms Road % A465 Aylestone Hill % A438 Ledbury Road % B4224 Hampton Park Road % Holme Lacy Road % % Hereford Outer Cordon (Outbound) 1 A49 Ross Road % A49 Holmer Road % A465 Belmont Road % A438 Kings Acre Road % A4110 Three Elms Road % A465 Aylestone Hill % A438 Ledbury Road % B4224 Hampton Park Road % Holme Lacy Road % % Two-way % Hereford Inner Cordon (Inbound) 1 Barton Road % A438 Eign Street % A49 Newtown Road % College Road % A465 Aylestone Hill % A438 Ledbury Road % B4224 Eign Road % St Martins Street % A49 Greyfriars Bridge % % Hereford Inner Cordon (Outbound) 1 Barton Road % A438 Eign Street % A49 Newtown Road % College Road 0 0 0% 0 5 A465 Aylestone Hill % A438 Ledbury Road % B4224 Eign Road % St Martins Street % A49 Greyfriars Bridge % % Two-way % Hereford East/ West Screenline (Eastbound) 1 B4399 Rotherwas Access Road % Holme Lacy Road % A438 Newmarket Street Eastbound % A49 Newtown Rd Eastbound % A4103 Roman Rd % Hinton Road/Ross Road % % Hereford East/ West Screenline (Westbound) 1 B4399 Rotherwas Access Road % Holme Lacy Road % A438 Newmarket Street Westbound % A49 Newtown Rd Eastbound % A4103 Roman Rd % Hinton Road/Ross Road % % Two-way %
28 Appendix G CENSUS 2011 DATA VALIDATION TABLES
29 Residential/output area data Zone Households in output area (Census 2011) Car Driver Origins (24hr) in output area (Census 2011) Residential addresses in Zone (AddressBase) AM HBW Origin trip ends (Car Driver) AM HB Origin trip ends (Car Driver) (all of (part of E ) (part of E ) (all of E ) E ) (of 153 in output area) 0 (of 268 in OA) (of 20.1 in all model zones in OA) (of 28.8 in all model zones in OA) 0.6 (of 54.7 in all model zones in OA) 0.6 (of in all model zones in OA) Workplace Zone/commercial data Zone (all of (part of E ) (part of E ) (all of E ) E ) Jobs in WPZ (Census 2011) Car Driver Destinations (24hr) in WPZ (Census 2011) Commercial Addresses in Zone 52 0 (of 16 in WPZ) 3 (of 25 in WPZ) 62 (AddressBase) AM HBW Destinations in Zone (of 34.1 in all model zones 9.1 (of in all model zones (Car Driver) in WPZ) in WPZ) AM Destinations Zone (Car Driver) (of 66.3 in all model zones in WPZ) 10.3 (of in all model zones in WPZ) 394.1
30 Appendix H FURTHER INFORMATION ON JOURNEY TIME DATA
31 Journey Analysis 2 1a 1a g 1a AM Wednesday 30/05/ :19 Sunny a AM Thursday 17/05/ :26 Cloudy, Dry a AM Tuesday 29/05/ :40 Sunny a AM Friday 25/05/ :50 Sunny a AM Friday 15/06/ :10 Sunny a AM Wednesday 20/06/ :46 Sunny Mean n = Standard Deviation (sn-1) % confidence interval, (upper limit) a g 1a IP Thursday 03/05/ :06 Rain a IP Thursday 17/05/ :27 Cloudy a IP Wednesday 16/05/ :35 Cloudy a IP Wednesday 16/05/ :45 oudy, Sunn a IP Tuesday 22/05/ :15 Sunny a IP Monday 11/06/ :10 Rain a IP Thursday 24/05/ :50 Sunny Mean n = Standard Deviation (sn-1) % confidence interval, (upper limit) % confidence interval, (lower limit) a g 1a PM Thursday 26/04/ :49 Sunny a PM Thursday 26/04/ :00 Sunny a PM Thursday 26/04/ :56 Cloudy a PM Thursday 17/05/ :55 Cloudy a PM Thursday 31/05/ :26 Cloudy a PM Thursday 21/06/ :30 Rain a PM Thursday 28/06/ :50 Sunny a PM Thursday 31/05/ :34 Cloudy Mean n = Standard Deviation (sn-1) % confidence interval, (upper limit) % confidence interval, (lower limit)
32 Journey Analysis 2 1b 1b g 1b AM Wednesday 30/05/ :02 Cloudy b AM Wednesday 30/05/ :30 Sunny b AM Thursday 17/05/ :56 Rain b AM Tuesday 29/05/ :30 Sunny b AM Tuesday 22/05/ :20 Sunny b AM Tuesday 12/06/ :34 Overcast b AM Monday 18/06/ :45 Sunny, Rain b AM Tuesday 12/06/ :55 Overcast Mean n = Standard Deviation (sn-1) % confidence interval, (upper limit) b g 1b IP Thursday 03/05/ :38 Rain b IP Thursday 17/05/ :51 Cloudy b IP Wednesday 16/05/ :00 Cloudy b IP Wednesday 16/05/ :15 oudy, Sunn b IP Thursday 26/04/ :14 Cloudy b IP Tuesday 22/05/ :38 Sunny Mean n = Standard Deviation (sn-1) % confidence interval, (upper limit) % confidence interval, (lower limit) b g 1b PM Thursday 26/04/ :20 Sunny b PM Thursday 17/05/ :10 Rain, Wet b PM Thursday 26/04/ :17 Cloudy b PM Thursday 31/05/ :59 Cloudy b PM Tuesday 19/06/ :10 Overcast b PM Thursday 21/06/ :50 Rain b PM Thursday 28/06/ :20 Sunny Mean n = Standard Deviation (sn-1) % confidence interval, (upper limit) % confidence interval, (lower limit)
33 Journey Analysis 2 2a 2a g 2a AM Wednesday 02/05/ :15 Overcast a AM Wednesday 02/05/ :12 Overcast a AM Thursday 31/05/ :22 Cloudy a AM Tuesday 12/06/ :10 Overcast a AM Wednesday 20/06/ :45 Sunny a AM Friday 22/06/ :45 Rain Mean n = Standard Deviation (sn-1) % confidence interval, (upper limit) a g 2a IP Tuesday 01/05/ :49 Cloudy, We a IP Thursday 26/04/ :37 Cloudy a IP Thursday 26/04/ :33 Cloudy a IP Tuesday 15/05/ :10 udy, Light R a IP Tuesday 15/05/ :10 Rain a IP Friday 25/05/ :45 Sunny Mean n = Standard Deviation (sn-1) % confidence interval, (upper limit) % confidence interval, (lower limit) a g 2a PM Tuesday 01/05/ :01 Rain a PM Tuesday 01/05/ :01 Rain a PM Tuesday 01/05/ :06 Rain a PM Wednesday 30/05/ :29 Cloudy a PM Wednesday 30/05/ :36 Cloudy a PM Tuesday 19/06/ :10 Overcast Mean n = Standard Deviation (sn-1) % confidence interval, (upper limit) % confidence interval, (lower limit)
34 Journey Analysis 2 2b 2b g 2b AM Wednesday 02/05/ :39 Overcast b AM Wednesday 02/05/ :41 Cloudy b AM Thursday 31/05/ :54 Cloudy b AM Thursday 31/05/ :00 Cloudy b AM Wednesday 20/06/ :10 Sunny b AM Friday 22/06/ :10 Rain Mean n = Standard Deviation (sn-1) % confidence interval, (upper limit) b g 2b IP Tuesday 01/05/ :16 Cloudy, We b IP Tuesday 15/05/ :30 Cloudy b IP Thursday 26/04/ :10 Cloudy b IP Tuesday 15/05/ : b IP Friday 25/05/ :05 Sunny b IP Wednesday 13/06/ :45 Overcast b IP Thursday 31/05/ :05 Rain b IP Thursday 24/05/ :30 Sunny Mean n = Standard Deviation (sn-1) % confidence interval, (upper limit) % confidence interval, (lower limit) b g 2b PM Tuesday 01/05/ :38 Rain b PM Tuesday 01/05/ :33 Cloudy, We b PM Wednesday 30/05/ :03 Sunny b PM Wednesday 30/05/ :00 Cloudy b PM Tuesday 19/06/ :30 Overcast b PM Tuesday 19/06/ :40 Overcast Mean n = Standard Deviation (sn-1) % confidence interval, (upper limit) % confidence interval, (lower limit)
35 Journey Analysis 2 3a 3a g 3a AM Wednesday 16/05/ :25 Sunny a AM Wednesday 25/04/ :54 Rain a AM Wednesday 16/05/ :08 Sunny a AM Wednesday 16/05/ :35 Sunny a AM Friday 18/05/ :35 Overcast a AM Thursday 17/05/ :10 Overcast Mean n = Standard Deviation (sn-1) % confidence interval, (upper limit) a g 3a IP Thursday 03/05/ :17 Overcast a IP Tuesday 15/05/ :47 Cloudy a IP Thursday 03/05/ :35 Overcast a IP Tuesday 15/05/ :32 Sunny a IP Tuesday 15/05/ :10 Wet a IP Tuesday 24/04/ :28 Cloudy Mean n = Standard Deviation (sn-1) % confidence interval, (upper limit) % confidence interval, (lower limit) a g 3a PM Thursday 03/05/ :28 vercast, W a PM Thursday 03/05/ :33 Rain a PM Tuesday 24/04/ :53 Rain a PM Tuesday 29/05/ :28 oudy, Sunn a PM Tuesday 29/05/ :23 oudy, Sunn a PM Tuesday 29/05/ :02 Sunny Mean n = Standard Deviation (sn-1) % confidence interval, (upper limit) % confidence interval, (lower limit)
36 Journey Analysis 2 3b 3b g 3b AM Wednesday 16/05/ :45 Sunny b AM Wednesday 25/04/ :20 Rain b AM Wednesday 16/05/ :30 Sunny b AM Wednesday 16/05/ :00 Sunny b AM Thursday 17/05/ :51 Overcast b AM Thursday 17/05/ :35 Overcast Mean n = Standard Deviation (sn-1) % confidence interval, (upper limit) b g 3b IP Thursday 03/05/ :52 Overcast b IP Tuesday 15/05/ :06 Cloudy, We b IP Thursday 03/05/ :35 Overcast b IP Tuesday 15/05/ :52 Cloudy b IP Tuesday 15/05/ :26 Sunny b IP Tuesday 24/04/ :05 Cloudy Mean n = Standard Deviation (sn-1) % confidence interval, (upper limit) % confidence interval, (lower limit) b g 3b PM Thursday 03/05/ :54 Rain b PM Thursday 03/05/ :10 Rain b PM Tuesday 24/04/ :25 Cloudy b PM Tuesday 29/05/ :08 oudy, Sunn b PM Tuesday 29/05/ :49 oudy, Sunn b PM Tuesday 29/05/ :43 oudy, Sunn Mean n = Standard Deviation (sn-1) % confidence interval, (upper limit) % confidence interval, (lower limit)
37 Journey Analysis 2 4a 4a g 4a AM Thursday 17/05/ :41 Overcast a AM Thursday 31/05/ :08 Overcast a AM Thursday 31/05/ :05 Rain a AM Friday 01/06/ :00 Light Rain a AM Thursday 17/05/ :50 Rain a AM Thursday 14/06/ :00 Overcast Mean n = Standard Deviation (sn-1) % confidence interval, (upper limit) a g 4a IP Thursday 17/05/ :55 Sunny a IP Tuesday 24/04/ :30 Cloudy a IP Wednesday 16/05/2012 Sunny a IP Tuesday 24/04/ :31 Cloudy a IP Thursday 17/05/ :16 Overcast a IP Thursday 17/05/ :00 Overcast Mean n = Standard Deviation (sn-1) % confidence interval, (upper limit) % confidence interval, (lower limit) a g 4a PM Tuesday 24/04/ :01 Cloudy, We a PM Tuesday 29/05/ :25 unny, Cloud a PM Tuesday 29/05/ :20 oudy, Sunn a PM Unknown Unknown 00:00 Unknown a PM Monday 21/05/ :30 Sunny a PM Monday 11/06/ :15 Rain Mean n = Standard Deviation (sn-1) % confidence interval, (upper limit) % confidence interval, (lower limit)
38 Journey Analysis 2 4b 4b g 4b AM Wednesday 25/04/ :00 Rain b AM Thursday 31/05/ :20 Overcast b AM Thursday 17/05/ :20 Light Rain b AM Thursday 14/06/ :30 Overcast b AM Friday 22/06/ :05 Rain b AM Friday 29/06/ :50 Overcast Mean n = Standard Deviation (sn-1) % confidence interval, (upper limit) b g 4b IP Friday 18/05/ :00 unny, Clou b IP Wednesday 16/05/ :23 Sunny b IP Friday 25/05/ :20 Sunny b IP Tuesday 24/04/ :11 Cloudy, Rai b IP Thursday 17/05/ :40 Overcast b IP Thursday 17/05/ :16 unny, Cloud b IP Friday 18/05/ :35 Cloudy Mean n = Standard Deviation (sn-1) % confidence interval, (upper limit) % confidence interval, (lower limit) b g 4b PM Thursday 24/05/ :00 Rain b PM Tuesday 29/05/ :45 oudy, Sunn b PM Monday 21/05/ :50 Sunny b PM Thursday 28/06/ :20 Sunny b PM Wednesday 04/07/ :25 ain, Overca b PM Wednesday 04/07/ :30 Overcast Mean n = Standard Deviation (sn-1) % confidence interval, (upper limit) % confidence interval, (lower limit)
5.1 Introduction. 5.2 Data Collection
 Chapter 5 Traffic Analysis 5.1 Introduction This chapter of the EIS assesses the traffic impacts of the proposed N5 Westport to Turlough Road Project (the proposed scheme). The proposed scheme will provide
Palmerston North Area Traffic Model
 Palmerston North Area Traffic Model Presentation to IPWEA 7 November 2014 PNATM Presentation Overview Model Scope and type Data collected The model Forecasting inputs Applications PNCC Aims and Objectives
APPENDIX IV MODELLING
 APPENDIX IV MODELLING Kingston Transportation Master Plan Final Report, July 2004 Appendix IV: Modelling i TABLE OF CONTENTS Page 1.0 INTRODUCTION... 1 2.0 OBJECTIVE... 1 3.0 URBAN TRANSPORTATION MODELLING
Bristol Clean Air Plan
 Document Ti tle Bristol Clean Air Plan January 2019 Project Name Project No: 673846.ER.20 Document Title: : 673846.ER.20.OBC-25 Revision: Revision B Date: January 2019 Client Name: Bristol City Council
Appendix B. Traffic Analysis Report
 Appendix B Traffic Analysis Report Report No. 14369/TR/WN02 August 2007 SALLINS BYPASS BYPASS OPTIONEERING ANALYSIS - TRAFFIC REPORT Kildare County Council Áras Chill Dara, Devoy Park, Naas, Co Kildare
Data Collection. Lecture Notes in Transportation Systems Engineering. Prof. Tom V. Mathew. 1 Overview 1
 Data Collection Lecture Notes in Transportation Systems Engineering Prof. Tom V. Mathew Contents 1 Overview 1 2 Survey design 2 2.1 Information needed................................. 2 2.2 Study area.....................................
Typical information required from the data collection can be grouped into four categories, enumerated as below.
 Chapter 6 Data Collection 6.1 Overview The four-stage modeling, an important tool for forecasting future demand and performance of a transportation system, was developed for evaluating large-scale infrastructure
South Bristol Link Forecasting Report
 South Bristol Link April 2013 Atkins 5098941 AVTM Forecasting v2 PI (Draft 120331) Draft 31 March 2012 1 Notice This document and its contents have been prepared and are intended solely for West of England
6 th Line Municipal Class Environmental Assessment
 6 th Line Municipal Class Environmental Assessment County Road 27 to St John s Road Town of Innisfil, ON September 6, 2016 APPENDIX L: TRAVEL DEMAND FORECASTING MEMORANDUM Accessible formats are available
Appendix C Final Methods and Assumptions for Forecasting Traffic Volumes
 Fairview Ave. and Main St. Improvements and Local Streets Plan Appendices Ada County Highway District Appendix C Final Methods and Assumptions for Forecasting Traffic Volumes January 3, 207 Appendices
Traffic Demand Forecast
 Chapter 5 Traffic Demand Forecast One of the important objectives of traffic demand forecast in a transportation master plan study is to examine the concepts and policies in proposed plans by numerically
JEP John E. Jack Pflum, P.E. Consulting Engineering 7541 Hosbrook Road, Cincinnati, OH Telephone:
 JEP John E. Jack Pflum, P.E. Consulting Engineering 7541 Hosbrook Road, Cincinnati, OH 45243 Email: jackpflum1@gmail.com Telephone: 513.919.7814 MEMORANDUM REPORT Traffic Impact Analysis Proposed Soccer
Changes in the Spatial Distribution of Mobile Source Emissions due to the Interactions between Land-use and Regional Transportation Systems
 Changes in the Spatial Distribution of Mobile Source Emissions due to the Interactions between Land-use and Regional Transportation Systems A Framework for Analysis Urban Transportation Center University
Analysis and Design of Urban Transportation Network for Pyi Gyi Ta Gon Township PHOO PWINT ZAN 1, DR. NILAR AYE 2
 www.semargroup.org, www.ijsetr.com ISSN 2319-8885 Vol.03,Issue.10 May-2014, Pages:2058-2063 Analysis and Design of Urban Transportation Network for Pyi Gyi Ta Gon Township PHOO PWINT ZAN 1, DR. NILAR AYE
Cipra D. Revised Submittal 1
 Cipra D. Revised Submittal 1 Enhancing MPO Travel Models with Statewide Model Inputs: An Application from Wisconsin David Cipra, PhD * Wisconsin Department of Transportation PO Box 7913 Madison, Wisconsin
URBAN TRANSPORTATION SYSTEM (ASSIGNMENT)
") BRANCH : CIVIL ENGINEERING SEMESTER : 6th Assignment-1 CHAPTER-1 URBANIZATION 1. What is Urbanization? Explain by drawing Urbanization cycle. 2. What is urban agglomeration? 3. Explain Urban Class Groups.
BRANCH : CIVIL ENGINEERING SEMESTER : 6th Assignment-1 CHAPTER-1 URBANIZATION 1. What is Urbanization? Explain by drawing Urbanization cycle. 2. What is urban agglomeration? 3. Explain Urban Class Groups.
MEMORANDUM. The study area of the analysis was discussed with City staff and includes the following intersections:
 MEMORANDUM DATE: JULY 6, 2012 TO: FROM: RE: CC: MELANIE KNIGHT BRAD BYVELDS/ JENNIFER LUONG 1050 SOMERSET STREET PRELIMINARY TRAFFIC ANALYSIS OUR FILE NO. 111152 NEIL MALHOTRA The purpose of this memo
Trip Generation Model Development for Albany
 Trip Generation Model Development for Albany Hui (Clare) Yu Department for Planning and Infrastructure Email: hui.yu@dpi.wa.gov.au and Peter Lawrence Department for Planning and Infrastructure Email: lawrence.peter@dpi.wa.gov.au
Technical Memorandum #2 Future Conditions
 Technical Memorandum #2 Future Conditions To: Dan Farnsworth Transportation Planner Fargo-Moorhead Metro Council of Governments From: Rick Gunderson, PE Josh Hinds PE, PTOE Houston Engineering, Inc. Subject:
Trip Distribution Modeling Milos N. Mladenovic Assistant Professor Department of Built Environment
 Trip Distribution Modeling Milos N. Mladenovic Assistant Professor Department of Built Environment 25.04.2017 Course Outline Forecasting overview and data management Trip generation modeling Trip distribution
CIV3703 Transport Engineering. Module 2 Transport Modelling
 CIV3703 Transport Engineering Module Transport Modelling Objectives Upon successful completion of this module you should be able to: carry out trip generation calculations using linear regression and category
Appendix B. Durham Region Travel Demand Model Calibration
 Appendix B Durham Region Travel Demand Model Calibration AECOM 300 Water Street 905 668 9363 tel Whitby, ON, Canada L1N 9J2 905 668 0221 fax www.aecom.com To Ron Albright, Municipality of Clarington Page
MOBILITIES AND LONG TERM LOCATION CHOICES IN BELGIUM MOBLOC
 MOBILITIES AND LONG TERM LOCATION CHOICES IN BELGIUM MOBLOC A. BAHRI, T. EGGERICKX, S. CARPENTIER, S. KLEIN, PH. GERBER X. PAULY, F. WALLE, PH. TOINT, E. CORNELIS SCIENCE FOR A SUSTAINABLE DEVELOPMENT
Parking Regulations Dundas Street West, from Bathurst Street to Dovercourt Road
 STAFF REPORT ACTION REQUIRED Parking Regulations Dundas Street West, from Bathurst Street to Dovercourt Road Date: October 28, 2008 To: From: Toronto and East York Community Council Director, Transportation
Greater Toronto Area Cordon Count Summary Analysis of Traffic Trends 1985 to 2011
 Greater Toronto Area Cordon Count Summary Analysis of Traffic Trends 1985 to 2011 Prepared by: Data Management Group Department of Civil Engineering University of Toronto Telephone: (416) 978-3916 Table
Speed Limit Review. Montague Road, West End. Prepared for Brisbane City Council CEB06842 CEB06842
 Speed Limit Review Montague Road, West End CEB06842 CEB06842 Prepared for Brisbane City Council 2 November 2016 Speed Limit Review Montague Road, West End Document Information Prepared for Brisbane City
April 10, Mr. Curt Van De Walle, City Manager City of Castle Hills 209 Lemonwood Drive Castle Hills, Texas 78213
 Mr. Curt Van De Walle, City Manager City of Castle Hills 209 Lemonwood Drive Castle Hills, Texas 78213 Subject: Revised Castle Hills BASIS Charter School Traffic Impact Analysis Review City of Castle Hills,
Drehid MBT Facility- Waste Licence EIS
 11 TRAFFIC 11.1 INTRODUCTION This Chapter assesses the potential impact that both the construction and operational phases of the proposed Mechanical Biological Treatment (MBT) Facility will have on the
APPENDIX G Halton Region Transportation Model
 APPENDIX G Halton Region Transportation Model Halton Region Transportation Master Plan Working Paper No. 1 - Legislative Context Working Paper No. 2 - Active Transportation Halton Transportation Model
The Sunland Park flyover ramp is set to close the week of March 19 until early summer
 March 2, 2018 The Sunland Park flyover ramp is set to close the week of March 19 until early summer GO 10 is targeting the week of March 19 to close the Sunland Park Drive flyover entrance ramp to I 10
CVS Derwood. Local Area Transportation Review
 CVS Derwood Montgomery County, Maryland May 27, 2016 Local Area Transportation Review Prepared for: JC Bar Properties, Inc. Steve Fleming, PE 415 Fallowfield Road, Suite 301 Camp Hill, Pennsylvania 17011
3.0 ANALYSIS OF FUTURE TRANSPORTATION NEEDS
 3.0 ANALYSIS OF FUTURE TRANSPORTATION NEEDS In order to better determine future roadway expansion and connectivity needs, future population growth and land development patterns were analyzed as part of
Appendix B. Land Use and Traffic Modeling Documentation
 Appendix B Land Use and Traffic Modeling Documentation Technical Memorandum Planning Level Traffic for Northridge Sub-Area Study Office of Statewide Planning and Research Modeling & Forecasting Section
California Urban Infill Trip Generation Study. Jim Daisa, P.E.
 California Urban Infill Trip Generation Study Jim Daisa, P.E. What We Did in the Study Develop trip generation rates for land uses in urban areas of California Establish a California urban land use trip
Parking Study MAIN ST
 Parking Study This parking study was initiated to help understand parking supply and parking demand within Oneida City Center. The parking study was performed and analyzed by the Madison County Planning
Trip Generation Study: A 7-Eleven Gas Station with a Convenience Store Land Use Code: 945
 Trip Generation Study: A 7-Eleven Gas Station with a Convenience Store Land Use Code: 945 Introduction The Brigham Young University Institute of Transportation Engineers student chapter (BYU ITE) completed
2015 Grand Forks East Grand Forks TDM
 GRAND FORKS EAST GRAND FORKS 2015 TRAVEL DEMAND MODEL UPDATE DRAFT REPORT To the Grand Forks East Grand Forks MPO October 2017 Diomo Motuba, PhD & Muhammad Asif Khan (PhD Candidate) Advanced Traffic Analysis
III. FORECASTED GROWTH
 III. FORECASTED GROWTH In order to properly identify potential improvement projects that will be required for the transportation system in Milliken, it is important to first understand the nature and volume
COMBINATION OF MACROSCOPIC AND MICROSCOPIC TRANSPORT SIMULATION MODELS: USE CASE IN CYPRUS
 International Journal for Traffic and Transport Engineering, 2014, 4(2): 220-233 DOI: http://dx.doi.org/10.7708/ijtte.2014.4(2).08 UDC: 656:519.87(564.3) COMBINATION OF MACROSCOPIC AND MICROSCOPIC TRANSPORT
Transport Planning in Large Scale Housing Developments. David Knight
 Transport Planning in Large Scale Housing Developments David Knight Large Scale Housing Developments No longer creating great urban spaces in the UK (Hall 2014) Transport Planning Transport planning processes
Traffic Impact Study
 Traffic Impact Study Statham DRI One University Parkway Prepared for: Barrow County Prepared by: October 2012 Table of Contents Executive Summary i Section 1. Introduction 1 Project Description 1 Methodology
TRANSPORTATION AND TRAFFIC ANALYSIS REPORT
 Square One Drive Extension Municipal Class Environmental Assessment Environmental Study Report Appendix B Transportation and Traffic Analysis Report TRANSPORTATION AND TRAFFIC ANALYSIS REPORT FINAL DRAFT
For More Information
 CHILDREN AND FAMILIES EDUCATION AND THE ARTS ENERGY AND ENVIRONMENT HEALTH AND HEALTH CARE INFRASTRUCTURE AND TRANSPORTATION The RAND Corporation is a nonprofit institution that helps improve policy and
FARM 1065 PORTION 1, ATLANTIS TRAFFIC IMPACT ASSESSMENT
 FARM 1065 PORTION 1, ATLANTIS TRAFFIC IMPACT ASSESSMENT February 2018 FIRST ISSUE Prepared by: JG AFRIKA (PTY) LTD Branch: Cape Town PO Box 38561 Postal code: 7430 Telephone: 021 530 1800 Email: wink@
City of Hermosa Beach Beach Access and Parking Study. Submitted by. 600 Wilshire Blvd., Suite 1050 Los Angeles, CA
 City of Hermosa Beach Beach Access and Parking Study Submitted by 600 Wilshire Blvd., Suite 1050 Los Angeles, CA 90017 213.261.3050 January 2015 TABLE OF CONTENTS Introduction to the Beach Access and Parking
WOODRUFF ROAD CORRIDOR ORIGIN-DESTINATION ANALYSIS
 2018 WOODRUFF ROAD CORRIDOR ORIGIN-DESTINATION ANALYSIS Introduction Woodruff Road is the main road to and through the commercial area in Greenville, South Carolina. Businesses along the corridor have
Trip and Parking Generation Study of Orem Fitness Center-Abstract
 Trip and Parking Generation Study of Orem Fitness Center-Abstract The Brigham Young University Institute of Transportation Engineers student chapter (BYU ITE) completed a trip and parking generation study
106 PURDUE ENGINEERING EXTENSION DEPARTMENT
 106 PURDUE ENGINEERING EXTENSION DEPARTMENT distribution by stations can best be studied by examining Figs. 3 and 4. Figure 4 shows the frequency distribution between stations, and Fig. 3 shows the actual
Project Appraisal Guidelines
 Project Appraisal Guidelines Unit 16.2 Expansion Factors for Short Period Traffic Counts August 2012 Project Appraisal Guidelines Unit 16.2 Expansion Factors for Short Period Traffic Counts Version Date
FHWA/IN/JTRP-2008/1. Final Report. Jon D. Fricker Maria Martchouk
 FHWA/IN/JTRP-2008/1 Final Report ORIGIN-DESTINATION TOOLS FOR DISTRICT OFFICES Jon D. Fricker Maria Martchouk August 2009 Final Report FHWA/IN/JTRP-2008/1 Origin-Destination Tools for District Offices
Measuring connectivity in London
 Measuring connectivity in London OECD, Paris 30 th October 2017 Simon Cooper TfL City Planning 1 Overview TfL Connectivity measures in TfL PTALs Travel time mapping Catchment analysis WebCAT Current and
Attachment 3. Updating UBC s Regional Context Statement. University of British Columbia CONSIDERATION MEMORANDUM OF CONSULTATION INPUT
 Attachment 3 University of British Columbia Updating UBC s Regional Context Statement CONSIDERATION MEMORANDUM OF CONSULTATION INPUT Campus and Community Planning February 24, 2014 1 CONSIDERATION MEMORANDUM
Texas Transportation Institute The Texas A&M University System College Station, Texas
 1. Report No. FHWA/TX-03/4198-2 4. Title and Subtitle CALIBRATION OF A PAST YEAR TRAVEL DEMAND MODEL FOR MODEL EVALUATION Technical Report Documentation Page 2. Government Accession No. 3. Recipient's
COUNCIL POLICY MANUAL
 COUNCIL POLICY MANUAL SECTION: PUBLIC WORKS SUBJECT: SNOW & ICE CONTROL POLICY 2012/2013 GOAL: Pages: 1 of 10 Approval Date: Dec. 3, 2012 Res. # 1001/2012 To annually identify the winter maintenance costs
Figure 8.2a Variation of suburban character, transit access and pedestrian accessibility by TAZ label in the study area
 Figure 8.2a Variation of suburban character, transit access and pedestrian accessibility by TAZ label in the study area Figure 8.2b Variation of suburban character, commercial residential balance and mix
Status Report: Ongoing review of O-D cellular data for the TPB modeled area
 Item #4 Status Report: Ongoing review of O-D cellular data for the TPB modeled area Presentation to the Travel Forecasting Subcommittee September 19, 2014 Ronald Milone, COG/TPB staff National Capital
MEMORANDUM. Trip Generation Analysis
 MEMORANDUM To: RMC Architects From: Matthew Palmer, PE Subject: Trip Generation, Parking Analysis & Level of Service Project: Port of Everett, GTC #13-053 Date: August 25, 2014 The trip generation and
APPENDIX I: Traffic Forecasting Model and Assumptions
 APPENDIX I: Traffic Forecasting Model and Assumptions Appendix I reports on the assumptions and traffic model specifications that were developed to support the Reaffirmation of the 2040 Long Range Plan.
TRAVEL DEMAND MODEL. Chapter 6
 Chapter 6 TRAVEL DEMAND MODEL As a component of the Teller County Transportation Plan development, a computerized travel demand model was developed. The model was utilized for development of the Transportation
STILLORGAN QBC LEVEL OF SERVICE ANALYSIS
 4-5th September, STILLORGAN QBC LEVEL OF SERVICE ANALYSIS Mr David O Connor Lecturer Dublin Institute of Technology Mr Philip Kavanagh Graduate Planner Dublin Institute of Technology Abstract Previous
Developing and Validating Regional Travel Forecasting Models with CTPP Data: MAG Experience
 CTPP Webinar and Discussion Thursday, July 17, 1-3pm EDT Developing and Validating Regional Travel Forecasting Models with CTPP Data: MAG Experience Kyunghwi Jeon, MAG Petya Maneva, MAG Vladimir Livshits,
Introduction of Information Feedback Loop To Enhance Urban Transportation Modeling System
 TRANSPORTATION RESEARCH RECORD 1493 81 Introduction of Information Feedback Loop To Enhance Urban Transportation Modeling System KYLE B. WINSLOW, ATHANASSIOS K. BLADIKAS, KENNETH J. HAUSMAN, AND LAZAR
Local Area Key Issues Paper No. 13: Southern Hinterland townships growth opportunities
 Draft Sunshine Coast Planning Scheme Review of Submissions Local Area Key Issues Paper No. 13: Southern Hinterland townships growth opportunities Key Issue: Growth opportunities for Southern Hinterland
WEBER ROAD RESIDENTIAL DEVELOPMENT Single Family Residential Project
 WEBER ROAD RESIDENTIAL DEVELOPMENT Single Family Residential Project WEBER ROAD RESIDENTIAL DEVELOPMENT TRAFFIC IMPACT STUDY TABLE OF CONTENTS 1.0 Executive Summary Page 2.0 Introduction 2.1 DEVELOPMENT
PATREC PERSPECTIVES Sensing Technology Innovations for Tracking Congestion
 PATREC PERSPECTIVES Sensing Technology Innovations for Tracking Congestion Drivers have increasingly been using inexpensive mapping applications imbedded into mobile devices (like Google Maps, MapFactor,
Focused Traffic Analysis for the One Lincoln Park Project
 September 15, 2015 Mr. Bill Johnson Coldwell Banker 511 Sir Francis Drake Boulevard Greenbrae, CA 94904 Focused Traffic Analysis for the One Lincoln Park Project Dear Mr. Johnson; As requested, W-Trans
Forecasts from the Strategy Planning Model
 Forecasts from the Strategy Planning Model Appendix A A12.1 As reported in Chapter 4, we used the Greater Manchester Strategy Planning Model (SPM) to test our long-term transport strategy. A12.2 The origins
Market Street PDP. Nassau County, Florida. Transportation Impact Analysis. VHB/Vanasse Hangen Brustlin, Inc. Nassau County Growth Management
 Transportation Impact Analysis Market Street PDP Nassau County, Florida Submitted to Nassau County Growth Management Prepared for TerraPointe Services, Inc. Prepared by VHB/Vanasse Hangen Brustlin, Inc.
Development of modal split modeling for Chennai
 IJMTES International Journal of Modern Trends in Engineering and Science ISSN: 8- Development of modal split modeling for Chennai Mr.S.Loganayagan Dr.G.Umadevi (Department of Civil Engineering, Bannari
Visitor Flows Model for Queensland a new approach
 Visitor Flows Model for Queensland a new approach Jason. van Paassen 1, Mark. Olsen 2 1 Parsons Brinckerhoff Australia Pty Ltd, Brisbane, QLD, Australia 2 Tourism Queensland, Brisbane, QLD, Australia 1
VHD Daily Totals. Population 14.5% change. VMT Daily Totals Suffolk 24-hour VMT. 49.3% change. 14.4% change VMT
 6.9 Suffolk 6-54 VMT Population and Travel Characteristics Population 14.5% change 2014 1,529,202 VHD Daily Totals 2014 251,060 49.3% change 2040 1,788,175 2040 374,850 VMT Daily Totals 2014 39,731,990
Non-Motorized Traffic Exploratory Analysis
 Non-Motorized Traffic Exploratory Analysis --------------------------------------------------------------- Chao Wu Advisor: Professor Greg Lindsey Humphrey School of Public Affairs University of Minnesota
A Hybrid Approach for Determining Traffic Demand in Large Development Areas
 A Hybrid Approach for Determining Traffic Demand in Large Development Areas Xudong Chai Department of Civil, Construction, and Environmental Engineering Iowa State University 394 Town Engineering Ames,
A Simplified Travel Demand Modeling Framework: in the Context of a Developing Country City
 A Simplified Travel Demand Modeling Framework: in the Context of a Developing Country City Samiul Hasan Ph.D. student, Department of Civil and Environmental Engineering, Massachusetts Institute of Technology,
Subject: Desert Palisades Specific Plan - Tram Way Access Sight Distance
 Endo Engineering Traffic Engineering Air Quality Studies Noise Assessments July 13, 2015 Mr. Ed Freeman Pinnacle View, LLC P.O. Box 1754 Lake Oswego, OR 97035-0579 Subject: Desert Palisades Specific Plan
Accessibility analysis of multimodal transport systems using advanced GIS techniques
 Urban Transport XIII: Urban Transport and the Environment in the 21st Century 655 Accessibility analysis of multimodal transport systems using advanced GIS techniques T. Vorraa Citilabs Regional Director,
NATHAN HALE HIGH SCHOOL PARKING AND TRAFFIC ANALYSIS. Table of Contents
 Parking and Traffic Analysis Seattle, WA Prepared for: URS Corporation 1501 4th Avenue, Suite 1400 Seattle, WA 98101-1616 Prepared by: Mirai Transportation Planning & Engineering 11410 NE 122nd Way, Suite
2129 NORTH MAIN STREET HOTE PROJECT ULI SHARED PARKING STUDY City of Santa Ana, California
 2129 NORTH MAIN STREET HOTE PROJECT ULI SHARED PARKING STUDY City of Santa Ana, California Prepared for: NET DEVELOPMENT COMPANY 3130 Airway Avenue Costa Mesa, CA 92626 Prepared by: RK ENGINEERING GROUP,
South Western Region Travel Time Monitoring Program Congestion Management Process Spring 2008 Report
 South Western Region Travel Monitoring Program Congestion Management Process Spring 2008 Report Prepared by: South Western Regional Planning Agency 888 Washington Boulevard Stamford, CT 06901 Telephone:
Encapsulating Urban Traffic Rhythms into Road Networks
 Encapsulating Urban Traffic Rhythms into Road Networks Junjie Wang +, Dong Wei +, Kun He, Hang Gong, Pu Wang * School of Traffic and Transportation Engineering, Central South University, Changsha, Hunan,
Date: March 31, 2014 PATE; fyril 2.3,2 >H
 aj BRAMPTON fifs Rower City XH-l-f r.t "»* City Council The Corporation of the City of Brampton SRAMPTON CITY COUNCIL Date: March 31, 2014 PATE; fyril 2.3,2 >H File: POO GR VisWhtoJed ^t'th-meeh'^a Subject:
WROTHAM PARISH COUNCIL, BOROUGH GREEN PARISH COUNCIL, PLATT PARISH COUNCIL & IGHTHAM PARISH COUNCIL
 WROTHAM PARISH COUNCIL, BOROUGH GREEN PARISH COUNCIL, PLATT PARISH COUNCIL & IGHTHAM PARISH COUNCIL OBJECTION TO PROPOSED REDEVELOPMENT OF EXISTING AND FORMER QUARRY SITES TO PROVIDE A LARGE SCALE RESIDENTIAL
Date: June 19, 2013 Meeting Date: July 5, Consideration of the City of Vancouver s Regional Context Statement
 Section E 1.5 To: From: Regional Planning and Agriculture Committee Lee-Ann Garnett, Senior Regional Planner Planning, Policy and Environment Department Date: June 19, 2013 Meeting Date: July 5, 2013 Subject:
Indicator: Proportion of the rural population who live within 2 km of an all-season road
 Goal: 9 Build resilient infrastructure, promote inclusive and sustainable industrialization and foster innovation Target: 9.1 Develop quality, reliable, sustainable and resilient infrastructure, including
KEELE UNIVERSITY SNOW AND SEVERE WEATHER MANAGEMENT PLAN
 1.0 Introduction 1.1 It is recognised that severe weather conditions, particularly snow and ice, can make it difficult for people to travel. However, as a residential campus, even during severe weather
Urban Planning Word Search Level 1
 Urban Planning Word Search Level 1 B C P U E C O S Y S T E M P A R E U O E U R B A N P L A N N E R T N S T D H E C O U N T Y G E R E R D W R E N I C I T Y C O U N C I L A A A S U G G C I L A G P R I R
Transit Time Shed Analyzing Accessibility to Employment and Services
 Transit Time Shed Analyzing Accessibility to Employment and Services presented by Ammar Naji, Liz Thompson and Abdulnaser Arafat Shimberg Center for Housing Studies at the University of Florida www.shimberg.ufl.edu
Existing road transport network of the National Capital Region was examined for the existing connectivity, mobility and accessibility in the study.
 2 Road Network 2.1 Existing Road Network The existing transport network in National Capital Region is radial in nature. It comprises of expressways, national highways, state highways, major district and
Appendixx C Travel Demand Model Development and Forecasting Lubbock Outer Route Study June 2014
 Appendix C Travel Demand Model Development and Forecasting Lubbock Outer Route Study June 2014 CONTENTS List of Figures-... 3 List of Tables... 4 Introduction... 1 Application of the Lubbock Travel Demand
Introduction / Background
 TECHNICAL NOTE 4 Proposed Redevelopment of the Former Leyland Test Track Site, Leyland Planning Application Reference 07/2017/3361/ORM CT/15043/TN04 Rev B 11 October 2018 Introduction / Background 1. A
Appendix B.1 EMME Model Calibration Memo
 Appendix B.1 EMME Model Calibration Memo itrans 144 Front Street West, Suite 655 Toronto, ON M5J 2L7 Tel: (416) 847-0005 Fax: (905) 882-1557 www.hdrinc.com www.itransconsulting.com File: 2.0 Memorandum
TRAFFIC IMPACT STUDY. Platte Canyon Villas Arapahoe County, Colorado (Arapahoe County Case Number: Z16-001) For
 For") TRAFFIC IMPACT STUDY For Platte Canyon Villas Arapahoe County, Colorado (Arapahoe County Case Number: Z16-001) February 2015 Revised: August 2015 April 2016 July 2016 September 2016 Prepared for: KB Home
TRAFFIC IMPACT STUDY For Platte Canyon Villas Arapahoe County, Colorado (Arapahoe County Case Number: Z16-001) February 2015 Revised: August 2015 April 2016 July 2016 September 2016 Prepared for: KB Home
Simulation on a partitioned urban network: an approach based on a network fundamental diagram
 The Sustainable City IX, Vol. 2 957 Simulation on a partitioned urban network: an approach based on a network fundamental diagram A. Briganti, G. Musolino & A. Vitetta DIIES Dipartimento di ingegneria
930 Old Northern Rd & 4 Post Office Rd, Glenorie
 Proposed Mixed Use Development 930 Old Northern & 4, Glenorie TRAFFIC AND PARKING ASSESSMENT REPORT 13 December 2016 Ref 16264 Suite 6, 20 Young Street, Neutral Bay NSW 2089 - PO Box 1868, Neutral Bay
A Method for Mapping Settlement Area Boundaries in the Greater Golden Horseshoe
 A Method for Mapping Settlement Area Boundaries in the Greater Golden Horseshoe Purpose This paper describes a method for mapping and measuring the lands designated for growth and urban expansion in the
OPTIMISING SETTLEMENT LOCATIONS: LAND-USE/TRANSPORT MODELLING IN CAPE TOWN
 OPTIMISING SETTLEMENT LOCATIONS: LAND-USE/TRANSPORT MODELLING IN CAPE TOWN Molai, L. and Vanderschuren, M.J.W.A. Civil Engineering, Faculty of Engineering and the Built Environment, University of Cape
CLAREMONT MASTER PLAN 2017: LAND USE COMMUNITY INPUT
 Planning and Development Department 14 North Street Claremont, New Hampshire 03743 Ph: (603) 542-7008 Fax: (603) 542-7033 Email: cityplanner@claremontnh.com www.claremontnh.com CLAREMONT MASTER PLAN 2017:
Regional Snapshot Series: Transportation and Transit. Commuting and Places of Work in the Fraser Valley Regional District
 Regional Snapshot Series: Transportation and Transit Commuting and Places of Work in the Fraser Valley Regional District TABLE OF CONTENTS Complete Communities Daily Trips Live/Work Ratio Commuting Local
FHWA Planning Data Resources: Census Data Planning Products (CTPP) HEPGIS Interactive Mapping Portal
 HEPGIS Interactive Mapping Portal") FHWA Planning Data Resources: Census Data Planning Products (CTPP) HEPGIS Interactive Mapping Portal Jeremy Raw, P.E. FHWA, Office of Planning, Systems Planning and Analysis August 2017 Outline Census
FHWA Planning Data Resources: Census Data Planning Products (CTPP) HEPGIS Interactive Mapping Portal Jeremy Raw, P.E. FHWA, Office of Planning, Systems Planning and Analysis August 2017 Outline Census
I. M. Schoeman North West University, South Africa. Abstract
 Urban Transport XX 607 Land use and transportation integration within the greater area of the North West University (Potchefstroom Campus), South Africa: problems, prospects and solutions I. M. Schoeman