Utah Climate and Water Report
|
|
|
- Charles Evans
- 6 years ago
- Views:
Transcription
. Water. Paper 1.")

1 Utah State University Water U.S. Government Documents (Utah Regional Depository) 2010 Utah Climate and Water Report U.S. Natural Resources Conservation Service Follow this and additional works at: Part of the Climate Commons Recommended Citation U.S. Natural Resources Conservation Service, "Utah Climate and Water Report" (2010). Water. Paper 1. This Article is brought to you for free and open access by the U.S. Government Documents (Utah Regional Depository) at It has been accepted for inclusion in Water by an authorized administrator of For more information, please contact


2 August, 2010 Utah Climate and Water Report Split Mountain SCAN site near Jensen, Utah Photos by Karen Vaughan, USDA NRCS Scale in cm
3 Utah Climate and Water Report The purpose of the Climate and Water Report is to provide a snapshot of current and immediate past climatic conditions and other information useful to agricultural and water user interests in Utah. The report utilizes data from several sources that represent specific parameters (streamflow data from the United States Geological Survey, reservoir data from the Bureau of Reclamation, and other sources), geography including high elevation United States Department of Agriculture (USDA), Natural Resources Conservation Service (NRCS) Snowpack Telemetry (SNOTEL) data, and agriculturally important data from the USDA NRCS Soil Climate Analysis Network (SCAN). Data on precipitation, soil moisture, soil temperature, reservoir storage, and streamflow are analyzed and presented. These data analyses can be used to increase irrigation efficiency and agricultural production. As with all data and analyses, there are limitations due to data quality, quantity, and spatial application. Report Content 1) Climate and Water Information Soil Climate Analysis Network a) Utah SCAN Water Year Precipitation b) North Central c) Northern Mountains d) Uintah Basin e) Southeast f) South Central g) Western and Dixie 2) General Hydrological Conditions a) SNOTEL Month to Date Precipitation b) SNOTEL Water Year to Date Precipitation c) Bear River Basin Water Availability Index d) Weber and Ogden River Basins Water Availability Index e) Utah Lake, Jordan River, and Tooele Valley Basins Water Availability Index f) Uintah Basin Water Availability Index g) Southeast River Basins Water Availability Index h) Sevier and Beaver River Basins Water Availability Index i) E. Garfield, Kane, Washington, and Iron Co. Water Availability Index The U.S. Department of Agriculture (USDA) prohibits discrimination in all its programs and activities on the basis of race, color, national origin, age, disability, and where applicable, sex, marital status, familial status, parental status, religion, sexual orientation, genetic information, political beliefs, reprisal, or because all or a part of an individual's income is derived from any public assistance program. (Not all prohibited bases apply to all programs.) Persons with disabilities who require alternative means for communication of program information (Braille, large print, audiotape, etc.) should contact USDA's TARGET Center at (202) (voice and TDD). To file a complaint of discrimination write to USDA, Director, Office of Civil Rights, 1400 Independence Avenue, S.W., Washington, D.C or call (800) (voice) or (202) (TDD). USDA is an equal opportunity provider and employer.


4 Climate and Water Information Soil Climate Analysis Network Soil Climate Analysis Network (SCAN) stations are primarily located on lowto mid elevation, agriculturally important landscapes that maintain representative soils. Elevations range from 3,000 to 7,000 ft. The SCAN network provides real time soil moisture and temperature data coupled with additional climate information for use in natural resource planning, drought assessment, water resource management, and resource inventory. Stations are situated on non irrigated, native soils, are remotely located, and collect hourly atmospheric and soils data that are available to the public online. In order to summarize SCAN data, the 34 sites in Utah are grouped by climate divisions (North Central, Northern Mountains, Uintah Basin, Southeast, South Central, Dixie, and Western). Explanation of soil water capacity definitions. Field capacity (FC) and wilting point (WP) are calculated in the laboratory for each soil horizon. The amount of water held between field capacity and wilting point is plant available. Visual explanation of soil water capacity definitions. updated Aug. 1, 2010

5 updated Aug. 1, 2010
6 North Central Soil Climate Analysis Network (SCAN) Site name County Precip to Monthly Avg Air Soil Moisture Soil Temperature Date* Precip Temp 2" 4" 8" 20" 40" 2" 4" 8" 20" 40" in. in. o F volume % o F NORTH CENTRAL Blue Creek Box Elder Cache Junction Cache Grantsville Tooele *since October 1, Monthly Precip is the amount of precipitation accumulated in the past month and Avg Air Temp is the average air temperature measured at the SCAN station. Soil moisture and temperature values reflect conditions measured on the first of the month. North Central 50 surface soil moisture 50 profile soil moisture Volumetric soil moisture, % FC WP Volumetric soil moisture, % Oct Nov Dec Jan Feb Mar Apr May Jun Jul Aug Sep 0 Oct Nov Dec Jan Feb Mar Apr May Jun Jul Aug Sep Surface soil moisture is the weighted mean of the water content measured at depths of 2, 4, and 8 inches. FC is the mean field capacity and WP is the mean permanent wilting point for the soil surface (0 to 12 inches) at SCAN sites within the region. Profile soil moisture is the weighted mean of water content measured at depths of 2, 4, 8, 20, and 40 inches. Additional data available at the SCAN website, including: hourly air temperature, relative humidity, wind speed, wind direction, barometric pressure, precipitation, solar radiation, soil temperature, and soil moisture. updated Aug. 1, 2010
7 Northern Mountains Soil Climate Analysis Network (SCAN) Site name County Precip to Monthly Avg Air Soil Moisture Soil Temperature Date* Precip Temp 2" 4" 8" 20" 40" 2" 4" 8" 20" 40" in. in. o F volume % o F NORTHERN MOUNTAINS Chicken Ridge Morgan Buffalo Jump Rich Morgan Morgan *since October 1, Monthly Precip is the amount of precipitation accumulated in the past month and Avg Air Temp is the average air temperature measured at the SCAN station. Soil moisture and temperature values reflect conditions measured on the first of the month. Northern Mountains 50 surface soil moisture 50 profile soil moisture Volumetric soil moisture, % FC WP Oct Nov Dec Jan Feb Mar Apr May Jun Jul Aug Sep Volumetric soil moisture, % Oct Nov Dec Jan Feb Mar Apr May Jun Jul Aug Sep Surface soil moisture is the weighted mean of the water content measured at depths of 2, 4, and 8 inches. FC is the mean field capacity and WP is the mean permanent wilting point for the soil surface (0 to 12 inches) at SCAN sites within the region. Profile soil moisture is the weighted mean of water content measured at depths of 2, 4, 8, 20, and 40 inches. Additional data available at the SCAN website, including: hourly air temperature, relative humidity, wind speed, wind direction, barometric pressure, precipitation, solar radiation, soil temperature, and soil moisture. updated Aug. 1, 2010
8 Uintah Basin Soil Climate Analysis Network (SCAN) Site name County Precip to Monthly Avg Air Soil Moisture Soil Temperature Date* Precip Temp 2" 4" 8" 20" 40" 2" 4" 8" 20" 40" in. in. o F volume % o F UINTAH BASIN Mountain Home Duchesne Little Red Fox Duchesne Split Mountain Uintah *since October 1, 2009 unless underlined (Little Red Fox 1/20/10; Split Mountain 1/19/10). Monthly Precip is the amount of precipitation accumulated in the past month and Avg Air Temp is the average air temperature measured at the SCAN station. Soil moisture and temperature values reflect conditions measured on the first of the month. Uintah Basin 50 surface soil moisture 50 profile soil moisture Volumetric soil moisture, % FC WP Volumetric soil moisture, % Oct Nov Dec Jan Feb Mar Apr May Jun Jul Aug Sep 0 Oct Nov Dec Jan Feb Mar Apr May Jun Jul Aug Sep Surface soil moisture is the weighted mean of the water content measured at depths of 2, 4, and 8 inches. FC is the mean field capacity and WP is the mean permanent wilting point for the soil surface (0 to 12 inches) at SCAN sites within the region. Profile soil moisture is the weighted mean of water content measured at depths of 2, 4, 8, 20, and 40 inches. Additional data available at the SCAN website, including: hourly air temperature, relative humidity, wind speed, wind direction, barometric pressure, precipitation, solar radiation, soil temperature, and soil moisture. updated Aug. 1, 2010
9 Southeast Soil Climate Analysis Network (SCAN) Site name County Precip to Monthly Avg Air Soil Moisture Soil Temperature Date* Precip Temp 2" 4" 8" 20" 40" 2" 4" 8" 20" 40" in. in. o F volume % o F SOUTHEAST Price Carbon Green River Emery Harm's Way San Juan West Summit San Juan Eastland San Juan Alkali Mesa San Juan McCracken Mesa San Juan *since October 1, 2009 unless underlined (Harm's Way 3/3/10). Monthly Precip is the amount of precipitation accumulated in the past month and Avg Air Temp is the average air temperature measured at the SCAN station. Soil moisture and temperature values reflect conditions measured on the first of the month. Southeast 50 surface soil moisture 50 profile soil moisture Volumetric soil moisture, % FC WP Volumetric soil moisture, % Oct Nov Dec Jan Feb Mar Apr May Jun Jul Aug Sep 0 Oct Nov Dec Jan Feb Mar Apr May Jun Jul Aug Sep Surface soil moisture is the weighted mean of the water content measured at depths of 2, 4, and 8 inches. FC is the mean field capacity and WP is the mean permanent wilting point for the soil surface (0 to 12 inches) at SCAN sites within the region. Profile soil moisture is the weighted mean of water content measured at depths of 2, 4, 8, 20, and 40 inches. Additional data available at the SCAN website, including: hourly air temperature, relative humidity, wind speed, wind direction, barometric pressure, precipitation, solar radiation, soil temperature, and soil moisture. updated Aug. 1, 2010
10 South Central Soil Climate Analysis Network (SCAN) Site name County Precip to Monthly Avg Air Soil Moisture Soil Temperature Date* Precip Temp 2" 4" 8" 20" 40" 2" 4" 8" 20" 40" in. in. o F volume % o F SOUTH CENTRAL Nephi Juab Ephraim Sanpete Holden Millard Milford Beaver Manderfield Beaver Circleville Piute nd nd Panguitch Garfield Cave Valley Washington Vermillion Kane Spooky Kane *since October 1, 2009 unless underlined (Panguitch 1/25/10; Cave Valley 4/12/10; Vermillion 4/13/10; Spooky 4/14/10; Manderfield 4/16/10), (nd) no data. Monthly Precip is the amount of precipitation accumulated in the past month and Avg Air Temp is the average air temperature measured at the SCAN station. Soil moisture and temperature values reflect conditions measured on the first of the month. South Central 50 surface soil moisture 50 profile soil moisture Volumetric soil moisture, % FC WP Volumetric soil moisture, % Oct Nov Dec Jan Feb Mar Apr May Jun Jul Aug Sep 0 Oct Nov Dec Jan Feb Mar Apr May Jun Jul Aug Sep Surface soil moisture is the weighted mean of the water content measured at depths of 2, 4, and 8 inches. FC is the mean field capacity and WP is the mean permanent wilting point for the soil surface (0 to 12 inches) at SCAN sites within the region. Profile soil moisture is the weighted mean of water content measured at depths of 2, 4, 8, 20, and 40 inches. Additional data available at the SCAN website, including: hourly air temperature, relative humidity, wind speed, wind direction, barometric pressure, precipitation, solar radiation, soil temperature, and soil moisture. updated Aug. 1, 2010
11 Western and Dixie Soil Climate Analysis Network (SCAN) Site name County Precip to Monthly Avg Air Soil Moisture Soil Temperature Date* Precip Temp 2" 4" 8" 20" 40" 2" 4" 8" 20" 40" in. in. o F volume % o F WESTERN Grouse Creek Box Elder nd Park Valley Box Elder Goshute Tooele Dugway Tooele nd Tule Valley Millard Hal's Canyon Millard Enterprise Washington DIXIE Sand Hollow Washington *since October 1, 2009 unless underlined (Park Valley 1/14/10; Goshute 3/1/10; Tule Valley 3/8/10; Hal's Canyon 3/9/10; Sand Hollow 1/27/10; Grouse Creek 5/4/10), (nd) no data. Monthly Precip is the amount of precipitation accumulated in the past month and Avg Air Temp is the average air temperature measured at the SCAN station. Soil moisture and temperature values reflect conditions measured on the first of the month. Western & Dixie 50 surface soil moisture 50 profile soil moisture Volumetric soil moisture, % FC WP Volumetric soil moisture, % Oct Nov Dec Jan Feb Mar Apr May Jun Jul Aug Sep 0 Oct Nov Dec Jan Feb Mar Apr May Jun Jul Aug Sep Surface soil moisture is the weighted mean of the water content measured at depths of 2, 4, and 8 inches. FC is the mean field capacity and WP is the mean permanent wilting point for the soil surface (0 to 12 inches) at SCAN sites within the region. Profile soil moisture is the weighted mean of water content measured at depths of 2, 4, 8, 20, and 40 inches. Additional data available at the SCAN website, including: hourly air temperature, relative humidity, wind speed, wind direction, barometric pressure, precipitation, solar radiation, soil temperature, and soil moisture. updated Aug. 1, 2010
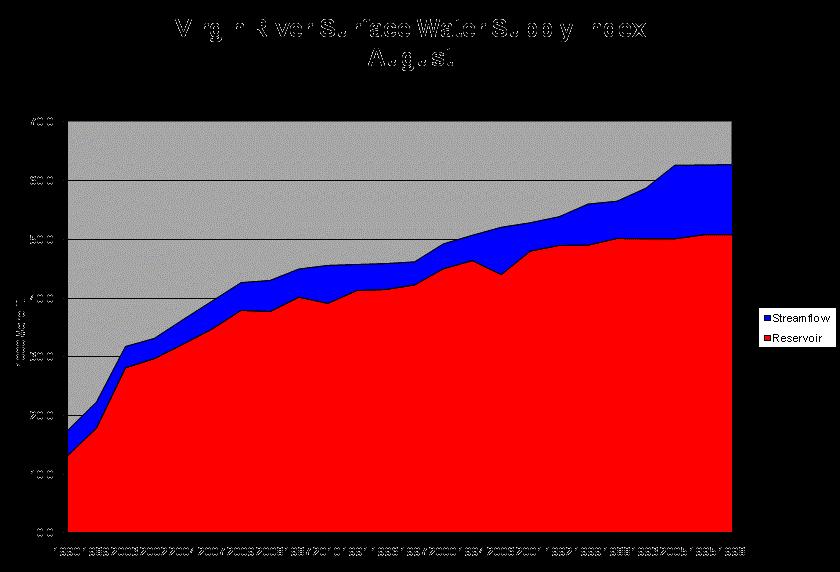
12 General Hydrologic Conditions The data and analyses in this section are from the NRCS SNOTEL system (precipitation, soil moisture), US Geological Survey (streamflow) and from various sources of reservoir data including the Bureau of Reclamation, Water Conservancy Districts and NRCS. These analyses provide information on general hydrologic conditions at higher water producing elevations. What is a Water Availability Index? The Water Availability Index (WAI) is a snapshot in time indicator of total surface water availability within a watershed for current reservoir storage and the immediate past month s streamflow set in a historical context. The WAI is very similar to the SWSI except the SWSI incorporates a predictive parameter forecast streamflow for the runoff season, April July in combination with reservoir storage. The Water Availability index is calculated by combining observed reservoir storage (carryover) with observed runoff for the past month. WAI values are scaled from +4.1 (abundant supply) to 4.1 (extremely dry) with a value of zero (0) indicating median water supply as compared to historical analysis. WAI's are calculated in this fashion to be consistent with other hydroclimatic indicators such as the Palmer Drought Index and the Precipitation index. Utah Snow Surveys has also chosen to display the WAI as a PERCENT CHANCE OF NON EXCEEDANCE. While this is a cumbersome name, it has the simplest application. It can be best thought of as a scale of 1 to 99 with 1 being the drought of record (driest possible conditions) and 99 being the flood of record (wettest possible conditions) and a value of 50 representing average conditions. This rating scale is a percentile rating as well, for example a WAI of 75% means that this year s water supply is greater than 75% of all historical events and that only 25% of the time has it been exceeded. Conversely a WAI of 10% means that 90% of historical events have been greater than this one and that only 10% have had less total water supply. This scale is far more intuitive for most people and is totally comparable between basins: a WAI of 50% means the same relative ranking on watershed A as it does on watershed B, which may not be strictly true of the +4 to 4 scale.
13 Utah SNOTEL Month to Date (MTD) Precipitation % of Normal Aug 01, 2010 UPPER SNAKE Logan 17 LOWER BEAR 12 Current MTD Precip. % of Normal > 200% % % % 75-99% 50-74% 25-49% 80 GREAT SALT LAKE G r e a t S a l t L a k e 39 Salt Lake City Ogden WEBER Provo JORDAN UPPER BEAR UPPER GREEN 61 Roosevelt WHITE-YAMPA 1-24% 81 0% Unavailable* LOWER GREEN 157 Provisional Data Subject to Revision ESCALANTE DESERT- SEVIER LAKE Moab UPPER COLORADO- DOLORES 15 UPPER COLORADO- DIRTY DEVIL LOWER COLORADO- LAKE MEAD 221 LOWER SAN JUAN St. George Miles Prepared by the USDA/NRCS National Water and Climate Center Portland, Oregon * Data unavailable at time of posting or unavailable long-term normal.
 to Date Precipitation Basin-wide Percent of 1971-2000 Normal unavailable * <50% 50-69% 70-89% 90-109% 110-129% 80 Tooele- Vernon G r e")


.")
14 Utah SNOTEL Water Year (Oct 1) to Date Precipitation % of Normal Aug 01, 2010 Bear River 87 Logan! Water Year (Oct 1) to Date Precipitation Basin-wide Percent of Normal unavailable * <50% 50-69% 70-89% % % 80 Tooele- Vernon G r e a t S a l t L a k e Sevier River Ogden! Salt Lake City!_^( Weber Ogden 85! Provo Provo- Utah- Jordan Bear River Green River Duchesne River Price - San Rafael Roosevelt! % >=150% * Data unavailable at time of posting or measurement is not representative at this time of year Provisional Data Subject to Revision Virgin River 109 Beaver River Dirty Devil Moab! Escalante River Southeastern Utah St. George! Miles The water year to date precipitation percent of normal represents the accumulated precipitation found at selected SNOTEL sites in or near the basin compared to the average value for those sites on this day. Data based on the first reading of the day (typically 00:00). Prepared by the USDA/NRCS National Water and Climate Center Portland, Oregon Based on data from Science contact: Tom.Pagano@por.usda.gov
15 Bear River Basin August 1, 2010 Precipitation in July was much below average at 40%, which brings the seasonal accumulation (Oct July) to 79% of average. Reservoir storage is low at 41% of capacity, which is the same as this time last year. Soil moisture is at 43% compared to 41% last year. Bear River Precipitation 200 8/1/2010 Bear River Soil Moisture 2010 mean 100% % 160 Percent of Average Saturation, volume % 60% 40% 20% Oct Nov Dec Jan Feb Mar Apr May Jun Monthly Year to date Jul Aug Sep 0% Oct Nov Dec Jan Feb Mar Apr May Jun Jul Aug Sep Percent saturation is calculated using the weighted average of volumetric soil moisture content at 2, 8, and 20 inch depths. Saturation is estimated as 40% volumetric water content. The gray area represents the range in saturation values since August Bear River Reservoir Storage Previous Yr % Capacity Current % Capacity Bear Basin Porcupine Hyrum Woodruff Creek Woodruff Narrows Bear Lake
16 Bear Lake Water Availability Index August 1 July EOM Bear Lake KAF July Observed EOM Inflow to Bear Lake KAF Reservoir + KAF Probability WAI # Year Page 1
17 Page 2
18 Bear Lake Water Availability Index August A-f Reservoir Reservoir
19 Bear Lake Water Availability Index August A-f Reservoir Reservoir
20 Percent of Average Saturation, volume % Weber and Ogden River Basins August 1, 2010 July precipitation was much below average at 38% bringing the seasonal accumulation (Oct-July) to 75% of average. Reservoir storage is at 85% of capacity, 3% lower than last year. Soil moisture is at 28% of saturation in the upper 2 feet of soil compared to 31% last year. Weber River Precipitation 8/1/2010 Weber River Soil Moisture 2010 mean 100% % % % % Oct Nov Dec Jan Feb Mar Apr May Jun Jul Aug Sep Monthly Year-to-date 0% Oct Nov Dec Jan Feb Mar Apr May Jun Jul Aug Sep Percent saturation is calculated using the weighted average of volumetric soil moisture content at 2, 8, and 20-inch depths. Saturation is estimated as 40% volumetric water content. The gray area represents the range in saturation values since August Weber Basin Reservoir Storage Previous Yr % Capacity Current % Capacity
21 Weber Water Availability Index August 1 July EOM Reservoirs KAF July EOM Observed Weber near Oakley KAF Reservoir + KAF Probability WAI # Year Page 1
22 500 Weber River Water Availability Index August A-f Reservoir
23 500 Weber River Water Availability Index August A-f Reservoir
24 Ogden Water Availability Index August 1 July EOM Observed SF Ogden nr Huntsville KAF Reservoir + KAF Probability WAI # Year July EOM Reservoirs KAF Page 1
25 Ogden River Water Availability Index August Reservoirs 1000 A-f
26 Ogden River Water Availability Index August Reservoirs 1000 A-f
27 Percent of Average Saturation, volume % Utah Lake, Jordan River & Tooele Valley Basins August 1, 2010 July precipitation was 59% of average, bringing the seasonal total (Oct-July) to 91% of average. Soil moisture is near 28%, compared to 21% last year at this time. Reservoir storage is at 91%, compared to 94% last year. Provo River Precipitation 200 8/1/2010 Jordan / Provo River Soil Moisture 100% 2010 mean % % % % Oct Nov Dec Jan Feb Mar Apr May Jun Monthly Year-to-date Jul Aug Sep 0% Oct Nov Dec Jan Feb Mar Apr May Jun Jul Aug Sep Percent saturation is calculated using the weighted average of volumetric soil moisture content at 2, 8, and 20-inch depths. Saturation is estimated as 40% volumetric water content. The gray area represents the range in saturation values since August Provo River Reservoir Storage Previous Yr % Capacity Current % Capacity
28 Uintah Mountains August 1, 2010 Precipitation in July was near average at 103%, which brings the seasonal accumulation (Oct July) to 87% of average. Reservoir storage is at 89% of capacity, down 3% from the same as this time last year. Soil moisture is at 39% compared to 42% last year. Uintah Precipitation 200 8/1/2010 Uintah Basin Soil Moisture 100% 2010 mean % Percent of Average Saturation, volume % 60% 40% 60 20% Oct Nov Dec Jan Feb Mar Apr May Jun Jul Aug Sep Monthly Year to date 0% Oct Nov Dec Jan Feb Mar Apr May Jun Jul Aug Sep Percent saturation is calculated using the weighted average of volumetric soil moisture content at 2, 8, and 20 inch depths. Saturation is estimated as 40% volumetric water content. The gray area represents the range in saturation values since August Uintah Basin Reservoir Storage Previous Yr % Capacity Current % Capacity
29 EASTERN UINTA BASIN WAI August 1, 2010 # of years 31 EOM July Reservoir KAF July KAF Reservoir + KAF Probability WAI # Year Reservoirs: Red Fleet and Steinaker : Big Brush Creek Page 1
30 Eastern Uintah Basin Surface Water Availability Index August A-f Reservoir
31 Eastern Uintah Basin Surface Water Availability Index August A-f Reservoir
32 Southeast Carbon, Emery, Wayne, Grand and San Juan Co. August 1, 2010 Precipitation in July was above average at 127%, which brings the seasonal accumulation (Oct July) to 94% of average. Reservoir storage is low at 68% of capacity, down 6% from the same time last year. Soil moisture is at 40% compared to 28% last year. Southeast Utah Precipitation 200 8/1/2010 Southeast Soil Moisture 2010 mean 100% % 160 Percent of Average Saturation, volume % 60% 40% 20% % Oct Nov Dec Jan Feb Mar Apr May Jun Jul Aug Sep 20 0 Oct Nov Dec Jan Feb Mar Apr May Jun Jul Aug Sep Monthly Year to date Percent saturation is calculated using the weighted average of volumetric soil moisture content at 2, 8, and 20 inch depths. Saturation is estimated as 40% volumetric water content. The gray area represents the range in saturation values since August Southeast Utah Reservoir Storage Previous Yr % Capacity Current % Capacity
33 August Joe's Valley WAI August EOM July Joe's Valley July Calculated - Joe's Valley Reservoir + Storage Inflow # Year 1000-AF 1000-AF 1000-AF Probability WAI Page 1
34 Joe's Valley WAI Acre Feet Reservoir
35 Joe's Valley WAI Acre Feet Reservoir
36 August Moab WAI August EOM July Ken's Lake Reservoir Storage July Observed - Mill Sheley Reservoir + # Year 1000-AF 1000-AF 1000-AF Probability WAI Page 1
37 Moab WAI Acre Feet Reservoir
38 Moab WAI Acre Feet Reservoir
39 August Price River WAI August EOM July Scofield July Calculated - Price nr Reservoir + Storage Scofield # Year 1000-AF 1000-AF 1000-AF Probability WAI Page 1
40 Price River WAI Acre Feet Reservoir
41 Price River WAI Acre Feet Reservoir
42 Sevier and Beaver River Basins August 1, 2010 July precipitation was 145% of normal which brings the seasonal total (Oct July) to 106%. SNOTEL soil Moisture is near 40% saturation, higher than the past 5 years due to cooler temperatures. Reservoir Storage is at 41% of capacity compared to 34% last year. Sevier River Precipitation 200 8/1/2010 Sevier / Beaver River Soil Moisture 100% 2010 mean % Percent of Average Saturation, volume % 60% 40% 20% Oct Nov Dec Jan Feb Mar Apr May Jun Jul Aug Sep Monthly Year to date 0% Oct Nov Dec Jan Feb Mar Apr May Jun Jul Aug Sep Percent saturation is calculated using the weighted average of volumetric soil moisture content at 2, 8, and 20 inch depths. Saturation is estimated as 40% volumetric water content. The gray area represents the range in saturation values since August Sevier River Reservoir Storage Previous Yr % Capacity Current % Capacity
43 Beaver River WAI August EOM July Minerville Reservoir Storage July Observed - Beaver at Beaver + Reservoir # Year 1000-AF 1000-AF 1000-AF Probability WAI
44
45 Beaver River Water Availability Index August A-f Reservoir
46 Beaver River Water Availability Index August A-f 15.0 Reservoir
47 Upper Sevier River WAI August EOM July Piute+Otter Creek Reservoir Storage July Observed - Sevier- Kingston + Reservoir # Year 1000-AF 1000-AF 1000-AF Probability WAI
48
49 Upper Sevier River Water Availability Index August A-f Reservoir
50 Upper Sevier River Water Availability Index August A-f Reservoir
51 Lower Sevier River WAI August EOM July Sevier Bridge Reservoir Storage July Observed - Sevier at Gunnison + Reservoir # Year 1000-AF 1000-AF 1000-AF Probability WAI
52
53 Lower Sevier River Water Availability Index August A-f Reservoir
54 Lower Sevier River Water Availability Index August A-f Reservoir
55 Percent of Average Saturation, volume % Southwest - E. Garfield, Kane, Washington, & Iron Co. August 1, 2010 Precipitation in July was 105% of average, bringing the seasonal accumulation (Oct-July) to 109%. Reservoir storage is at 66% compared to 67% at this time last year. Soil moisture is near 33% compared to 27% last year. Southwest Utah Precipitation /1/2010 Southwest Soil Moisture 2010 mean 100% 80% % 40% 20% Oct Nov Dec Jan Feb Mar Apr May Jun Jul Aug Sep Monthly Year-to-date 0% Oct Nov Dec Jan Feb Mar Apr May Jun Jul Aug Sep Percent saturation is calculated using the weighted average of volumetric soil moisture content at 2, 8, and 20-inch depths. Saturation is estimated as 40% volumetric water content. The gray area represents the range in saturation values since August Southwest Utah Reservoir Storage Previous Yr % Capacity Current % Capacity SWUtah Kolob Sand Hollow Quail Creek Gunlock Lower Enterprise Upper Enterprise
56 VIRGIN RIVER BASIN WAI 1-Aug-10 EOM July Reservoir KAF July KAF Reservoir + KAF Probability SWSI # Year
57
58

59 Issued by David White Chief Natural Resources Conservation Service U.S. Department of Agriculture Released by Sylvia Gillen State Conservationist Natural Resources Conservation Service Salt Lake City, Utah Prepared by Snow Survey Staff Randall Julander, Supervisor Troy Brosten, Hydrologist Timothy Bardsley, Hydrologist Mike Bricco, Hydrologist Beau Uriona, Hydrologist Karen Vaughan, Soil Scientist Bob Nault, Electronics Technician YOU MAY OBTAIN THIS PRODUCT AS WELL AS CURENT SNOW, PRECIPITATION, TEMPERATURE AND SOIL MOISTURE, RESERVOIR, SURFACE WATER SUPPLY INDEX, AND OTHER DATA BY VISITING OUR WEB Snow Survey, USDA, NRCS 245 North Jimmy Doolittle Road Salt Lake City, UT (801) Utah Water Supply Outlook Report Natural Resources Conservation Service Salt Lake City, UT
Utah Water Supply Outlook Report
 Utah Water Supply Outlook Report Winter scene Photo by Kent Sutcliffe STATE OF UTAH GENERAL OUTLOOK SUMMARY Currently our snowpack is about double what it was at this time last year. That might sound impressive
A Review of the 2007 Water Year in Colorado
 A Review of the 2007 Water Year in Colorado Nolan Doesken Colorado Climate Center, CSU Mike Gillespie Snow Survey Division, USDA, NRCS Presented at the 28 th Annual AGU Hydrology Days, March 26, 2008,
Colorado Water Supply Outlook Report April 1, 2016
 Colorado Water Supply Outlook Report April 1, 216 Kevin Houck and Allison Franz of the Colorado Water Conservation Board measure the Willow Creek Pass snow course. This snow course recorded 129% of normal
Webinar and Weekly Summary February 15th, 2011
 Webinar and Weekly Summary February 15th, 2011 -Assessment of current water conditions - Precipitation Forecast - Recommendations for Drought Monitor Upper Colorado Normal Precipitation Upper Colorado
NIDIS Intermountain West Drought Early Warning System December 4, 2018
 12/4/2018 NIDIS Drought and Water Assessment NIDIS Intermountain West Drought Early Warning System December 4, 2018 Precipitation The images above use daily precipitation statistics from NWS COOP, CoCoRaHS,
Precipitation. Standardized Precipitation Index. NIDIS Intermountain West Drought Early Warning System September 5, 2017
 9/6/2017 NIDIS Drought and Water Assessment NIDIS Intermountain West Drought Early Warning System September 5, 2017 Precipitation The images above use daily precipitation statistics from NWS COOP, CoCoRaHS,
NIDIS Intermountain West Drought Early Warning System February 12, 2019
 NIDIS Intermountain West Drought Early Warning System February 12, 2019 Precipitation The images above use daily precipitation statistics from NWS COOP, CoCoRaHS, and CoAgMet stations. From top to bottom,
Colorado s 2003 Moisture Outlook
 Colorado s 2003 Moisture Outlook Nolan Doesken and Roger Pielke, Sr. Colorado Climate Center Prepared by Tara Green and Odie Bliss http://climate.atmos.colostate.edu How we got into this drought! Fort
PRECIPITATION. Last Week Precipitation:
 12/3/2014 NIDIS Drought and Water Assessment PRECIPITATION The images above use daily precipitation statistics from NWS COOP, CoCoRaHS, and CoAgMet stations. From top to bottom, and left to right: most
2003 Moisture Outlook
 2003 Moisture Outlook Nolan Doesken and Roger Pielke, Sr. Colorado Climate Center Prepared by Tara Green and Odie Bliss http://climate.atmos.colostate.edu Through 1999 Through 1999 Fort Collins Total Water
NIDIS Intermountain West Drought Early Warning System November 14, 2017
 NIDIS Intermountain West Drought Early Warning System November 14, 2017 Precipitation The images above use daily precipitation statistics from NWS COOP, CoCoRaHS, and CoAgMet stations. From top to bottom,
NIDIS Weekly Climate, Water and Drought Assessment Summary. Upper Colorado River Basin
 NIDIS Weekly Climate, Water and Drought Assessment Summary Upper Colorado River Basin August 3, 2010 Precipitation and Snowpack Fig. 1: July precipitation in inches Fig. 2: July precip as percent of average
NIDIS Intermountain West Drought Early Warning System October 17, 2017
 NIDIS Drought and Water Assessment NIDIS Intermountain West Drought Early Warning System October 17, 2017 Precipitation The images above use daily precipitation statistics from NWS COOP, CoCoRaHS, and
NIDIS Intermountain West Drought Early Warning System May 1, 2018
 NIDIS Intermountain West Drought Early Warning System May 1, 2018 Precipitation The images above use daily precipitation statistics from NWS COOP, CoCoRaHS, and CoAgMet stations. From top to bottom, and
NIDIS Intermountain West Drought Early Warning System December 11, 2018
 NIDIS Drought and Water Assessment NIDIS Intermountain West Drought Early Warning System December 11, 2018 Precipitation The images above use daily precipitation statistics from NWS COOP, CoCoRaHS, and
Missouri River Basin Water Management Monthly Update
 Missouri River Basin Water Management Monthly Update Participating Agencies 255 255 255 237 237 237 0 0 0 217 217 217 163 163 163 200 200 200 131 132 122 239 65 53 80 119 27 National Oceanic and Atmospheric
NIDIS Intermountain West Regional Drought Early Warning System February 7, 2017
 NIDIS Drought and Water Assessment NIDIS Intermountain West Regional Drought Early Warning System February 7, 2017 Precipitation The images above use daily precipitation statistics from NWS COOP, CoCoRaHS,
RELATIONSHIP BETWEEN CLIMATIC CONDITIONS AND SOIL PROPERTIES AT SCAN AND SNOTEL SITES IN UTAH. Karen Vaughan 1 and Randy Julander 2 ABSTRACT
 RELATIONSHIP BETWEEN CLIMATIC CONDITIONS AND SOIL PROPERTIES AT SCAN AND SNOTEL SITES IN UTAH Karen Vaughan 1 and Randy Julander 2 ABSTRACT To improve our understanding of the influence of climatic conditions
Missouri River Basin Water Management Monthly Update
 Missouri River Basin Water Management Monthly Update Participating Agencies 255 255 255 237 237 237 0 0 0 217 217 217 163 163 163 200 200 200 131 132 122 239 65 53 80 119 27 National Oceanic and Atmospheric
Precipitation. Standardized Precipitation Index. NIDIS Intermountain West Regional Drought Early Warning System January 3, 2017
 1/3/2017 NIDIS Drought and Water Assessment NIDIS Intermountain West Regional Drought Early Warning System January 3, 2017 Precipitation The images above use daily precipitation statistics from NWS COOP,
The following information is provided for your use in describing climate and water supply conditions in the West as of April 1, 2003.
 Natural Resources Conservation Service National Water and Climate Center 101 SW Main Street, Suite 1600 Portland, OR 97204-3224 Date: April 8, 2003 Subject: April 1, 2003 Western Snowpack Conditions and
Upper Missouri River Basin February 2018 Calendar Year Runoff Forecast February 6, 2018
 Upper Missouri River Basin February 2018 Calendar Year Runoff Forecast February 6, 2018 Calendar Year Runoff Forecast Explanation and Purpose of Forecast U.S. Army Corps of Engineers, Northwestern Division
Missouri River Basin Water Management Monthly Update
 Missouri River Basin Water Management Monthly Update Participating Agencies 255 255 255 237 237 237 0 0 0 217 217 217 163 163 163 200 200 200 131 132 122 239 65 53 80 119 27 National Oceanic and Atmospheric
PRECIPITATION. Last Week Precipitation:
 2/24/2015 NIDIS Drought and Water Assessment PRECIPITATION The images above use daily precipitation statistics from NWS COOP, CoCoRaHS, and CoAgMet stations. From top to bottom, and left to right: most
NIDIS Intermountain West Drought Early Warning System March 26, 2019
 NIDIS Intermountain West Drought Early Warning System March 26, 2019 The images above use daily precipitation statistics from NWS COOP, CoCoRaHS, and CoAgMet stations. From top to bottom, and left to right:
Weather and Climate of the Rogue Valley By Gregory V. Jones, Ph.D., Southern Oregon University
 Weather and Climate of the Rogue Valley By Gregory V. Jones, Ph.D., Southern Oregon University The Rogue Valley region is one of many intermountain valley areas along the west coast of the United States.
March 1, 2003 Western Snowpack Conditions and Water Supply Forecasts
 Natural Resources Conservation Service National Water and Climate Center 101 SW Main Street, Suite 1600 Portland, OR 97204-3224 Date: March 17, 2003 Subject: March 1, 2003 Western Snowpack Conditions and
2003 Water Year Wrap-Up and Look Ahead
 2003 Water Year Wrap-Up and Look Ahead Nolan Doesken Colorado Climate Center Prepared by Odie Bliss http://ccc.atmos.colostate.edu Colorado Average Annual Precipitation Map South Platte Average Precipitation
NIDIS Drought and Water Assessment
 NIDIS Drought and Water Assessment PRECIPITATION The images above use daily precipitation statistics from NWS COOP, CoCoRaHS, and CoAgMet stations. From top to bottom, and left to right: most recent 7-days
NIDIS Intermountain West Drought Early Warning System December 18, 2018
 NIDIS Intermountain West Drought Early Warning System December 18, 2018 Precipitation The images above use daily precipitation statistics from NWS COOP, CoCoRaHS, and CoAgMet stations. From top to bottom,
CoCoRaHS Monitoring Colorado s s Water Resources through Community Collaborations
 CoCoRaHS Monitoring Colorado s s Water Resources through Community Collaborations Nolan Doesken Colorado Climate Center Atmospheric Science Department Colorado State University Presented at Sustaining
NIDIS Intermountain West Drought Early Warning System April 18, 2017
 1 of 11 4/18/2017 3:42 PM Precipitation NIDIS Intermountain West Drought Early Warning System April 18, 2017 The images above use daily precipitation statistics from NWS COOP, CoCoRaHS, and CoAgMet stations.
NIDIS Intermountain West Drought Early Warning System February 19, 2019
 NIDIS Intermountain West Drought Early Warning System February 19, 2019 Precipitation The images above use daily precipitation statistics from NWS COOP, CoCoRaHS, and CoAgMet stations. From top to bottom,
NIDIS Intermountain West Drought Early Warning System February 6, 2018
 NIDIS Intermountain West Drought Early Warning System February 6, 2018 Precipitation The images above use daily precipitation statistics from NWS COOP, CoCoRaHS, and CoAgMet stations. From top to bottom,
The Colorado Drought : 2003: A Growing Concern. Roger Pielke, Sr. Colorado Climate Center.
 The Colorado Drought 2001-2003: 2003: A Growing Concern Roger Pielke, Sr. Colorado Climate Center Prepared by Tara Green and Odie Bliss http://climate.atmos.colostate.edu 2 2002 Drought History in Colorado
A Recap of Colorado s Water Year 2018
 A Recap of Colorado s Water Year 2018 For further inquiries, please contact: Russ Schumacher, State Climatologist (970) 491-8084 Becky Bolinger, Assistant State Climatologist (970) 491-8506 Peter Goble,
NIDIS Intermountain West Drought Early Warning System April 16, 2019
 NIDIS Intermountain West Drought Early Warning System April 16, 2019 Precipitation The images above use daily precipitation statistics from NWS COOP, CoCoRaHS, and CoAgMet stations. From top to bottom,
Monthly Long Range Weather Commentary Issued: APRIL 18, 2017 Steven A. Root, CCM, Chief Analytics Officer, Sr. VP,
 Monthly Long Range Weather Commentary Issued: APRIL 18, 2017 Steven A. Root, CCM, Chief Analytics Officer, Sr. VP, sroot@weatherbank.com MARCH 2017 Climate Highlights The Month in Review The average contiguous
Missouri River Basin Water Management
 Missouri River Basin Water Management US Army Corps of Engineers Missouri River Navigator s Meeting February 12, 2014 Bill Doan, P.E. Missouri River Basin Water Management US Army Corps of Engineers BUILDING
California Water Supply Outlook Report
 UNITED STATES DEPARTMENT OF AGRICULTURE NATURAL RESOURCES CONSERVATION SERVICE California Water Supply Outlook Report March, 2017 Photo taken on February 28, 2017 by NRCS. NRCS snow surveyors measuring
NIDIS Intermountain West Drought Early Warning System October 30, 2018
 10/30/2018 NIDIS Drought and Water Assessment NIDIS Intermountain West Drought Early Warning System October 30, 2018 Precipitation The images above use daily precipitation statistics from NWS COOP, CoCoRaHS,
Highlights of the 2006 Water Year in Colorado
 Highlights of the 2006 Water Year in Colorado Nolan Doesken, State Climatologist Atmospheric Science Department Colorado State University http://ccc.atmos.colostate.edu Presented to 61 st Annual Meeting
NIDIS Intermountain West Drought Early Warning System July 18, 2017
 NIDIS Drought and Water Assessment NIDIS Intermountain West Drought Early Warning System July 18, 2017 Precipitation The images above use daily precipitation statistics from NWS COOP, CoCoRaHS, and CoAgMet
Drought in Southeast Colorado
 Drought in Southeast Colorado Nolan Doesken and Roger Pielke, Sr. Colorado Climate Center Prepared by Tara Green and Odie Bliss http://climate.atmos.colostate.edu 1 Historical Perspective on Drought Tourism
NIDIS Intermountain West Drought Early Warning System May 23, 2017
 NIDIS Drought and Water Assessment NIDIS Intermountain West Drought Early Warning System May 23, 2017 Precipitation The images above use daily precipitation statistics from NWS COOP, CoCoRaHS, and CoAgMet
What is a published soil survey?
 What is a published soil survey? A soil survey is a detailed report on the soils of an area. The soil survey has maps with soil boundaries and photos, descriptions, and tables of soil properties and features.
Oregon Water Conditions Report May 1, 2017
 Oregon Water Conditions Report May 1, 2017 Mountain snowpack in the higher elevations has continued to increase over the last two weeks. Statewide, most low and mid elevation snow has melted so the basin
Oregon Water Conditions Report April 17, 2017
 Oregon Water Conditions Report April 17, 2017 Mountain snowpack continues to maintain significant levels for mid-april. By late March, statewide snowpack had declined to 118 percent of normal after starting
Missouri River Basin Water Management Monthly Update
 Missouri River Basin Water Management Monthly Update Participating Agencies 255 255 255 237 237 237 0 0 0 217 217 217 163 163 163 200 200 200 131 132 122 239 65 53 80 119 27 National Oceanic and Atmospheric
PRECIPITATION. Last Week Precipitation:
 12/30/2014 NIDIS Drought and Water Assessment PRECIPITATION The images above use daily precipitation statistics from NWS COOP, CoCoRaHS, and CoAgMet stations. From top to bottom, and left to right: most
Upper Missouri River Basin January 2018 Calendar Year Runoff Forecast January 3, 2018
 Calendar Year Runoff Forecast Upper Missouri River Basin January 2018 Calendar Year Runoff Forecast January 3, 2018 Explanation and Purpose of Forecast U.S. Army Corps of Engineers, Northwestern Division
NIDIS Intermountain West Drought Early Warning System January 22, 2019
 NIDIS Drought and Water Assessment NIDIS Intermountain West Drought Early Warning System January 22, 2019 Precipitation The images above use daily precipitation statistics from NWS COOP, CoCoRaHS, and
NIDIS Intermountain West Drought Early Warning System November 21, 2017
 NIDIS Drought and Water Assessment NIDIS Intermountain West Drought Early Warning System November 21, 2017 Precipitation The images above use daily precipitation statistics from NWS COOP, CoCoRaHS, and
-Assessment of current water conditions. - Precipitation Forecast. - Recommendations for Drought Monitor
 2 May 1 st, 2012 -Assessment of current water conditions - Precipitation Forecast - Recommendations for Drought Monitor AHPS Water Year Precipitation as Percentage of Normal 7-day average
NIDIS Drought and Water Assessment
 7/23/13 1:57 PM PRECIPITATION The images above use daily precipitation statistics from NWS COOP, CoCoRaHS, and CoAgMet stations. From top to bottom, and left to right: most recent 7-days of accumulated
National Integrated Drought Information System. Southeast US Pilot for Apalachicola- Flint-Chattahoochee River Basin 20-March-2012
 National Integrated Drought Information System Southeast US Pilot for Apalachicola- Flint-Chattahoochee River Basin 20-March-2012 Current drought status from Drought Monitor http://www.drought.unl.edu/dm/monitor.html
-Assessment of current water conditions. - Precipitation Forecast. - Recommendations for Drought Monitor
 April 27, 2010 -Assessment of current water conditions - Precipitation Forecast - Recommendations for Drought Monitor 7 Day Precipitation 19-25 April 2010 Month-to-Date Precipitation 1-25 April 2010
-Assessment of current water conditions. - Precipitation Forecast. - Recommendations for Drought Monitor
 2 June 12, 2012 -Assessment of current water conditions - Precipitation Forecast - Recommendations for Drought Monitor 7-day average discharge compared to historical discharge for the day
NIDIS Intermountain West Drought Early Warning System January 15, 2019
 NIDIS Drought and Water Assessment NIDIS Intermountain West Drought Early Warning System January 15, 2019 Precipitation The images above use daily precipitation statistics from NWS COOP, CoCoRaHS, and
ACCUMULATED PRECIPITATION IN INCHES
 CUMULATIVE PRECIPITATION WATER YEAR COLUMBIA BASIN ABOVE GRAND COULEE 84% of Normal 1971- Average ACCUMULATED PRECIPITATION IN INCHES 8 6 82% of Normal 85% of Normal 82% of Normal SNAKE RIVER BASIN ABOVE
CRP HEL CRP Ortho Imagery. Tract Cropland Total: acres
 United States Department of Agriculture Madison County, Iowa 17 4.09 23 1.26 6 10.74 14 2.89 12 1.7 1 18.02 230TH LN T 347 3 34 4.65 13 2.81 2 11.4 ELMWOOD AVE 16 3 6.49 18 6.5 1.59 21 2.35 8.76 24 11
SEPTEMBER 2013 REVIEW
 Monthly Long Range Weather Commentary Issued: October 21, 2013 Steven A. Root, CCM, President/CEO sroot@weatherbank.com SEPTEMBER 2013 REVIEW Climate Highlights The Month in Review The average temperature
NIDIS Weekly Climate, Water and Drought Assessment Summary Upper Colorado River Basin Pilot Project 13 July 2010
 NIDIS Weekly Climate, Water and Drought Assessment Summary Upper Colorado River Basin Pilot Project 13 July 2010 Precipitation and Snowpack Over the past week, precipitation in the Upper Colorado River
Sierra Weather and Climate Update
 Sierra Weather and Climate Update 2014-15 Kelly Redmond Western Regional Climate Center Desert Research Institute Reno Nevada Yosemite Hydroclimate Workshop Yosemite Valley, 2015 October 8-9 Percent of
Missouri River Basin Climate Outlook 1 May Dr. Dennis Todey State Climatologist South Dakota State Univ.
 Missouri River Basin Climate Outlook 1 May 2014 Dr. Dennis Todey State Climatologist South Dakota State Univ. dennis.todey@sdstate.edu 605-688-5141 Photo taken Feb 19, 2013 General Information Providing
 Water Supply Forecast - THE DALLES http://www.nwrfc.noaa.gov/water_supply/ws_forecasts.php?id=tdao3 Page 1 of 1 3/7/2013 Close Archive Data/Normals Rankings Adjustments Verification Verify All Years Help
Climate Change and Water Supply Research. Drought Response Workshop October 8, 2013
 Climate Change and Water Supply Research Drought Response Workshop October 8, 2013 DWR Photo Oroville Reservoir, 2009 Talk Overview Expectations History Atmospheric Rivers and Water Supply Current Research
Intermountain West Climate Summary
 Intermountain West Climate Summary by The Western Water Assessment Issued March 17, 2006 March 2006 Climate Summary Hydrological Conditions Most of the Intermountain West region is not categorized in drought,
-Assessment of current water conditions. - Precipitation Forecast. - Recommendations for Drought Monitor
 2 June 26 th, 2012 -Assessment of current water conditions - Precipitation Forecast - Recommendations for Drought Monitor CMPDSI Value Percentile Rank Characteristic -1.0 - -1.9 21-30 Abnormally
Applications/Users for Improved S2S Forecasts
 Applications/Users for Improved S2S Forecasts Nolan Doesken Colorado Climate Center Colorado State University WSWC Precipitation Forecasting Workshop June 7-9, 2016 San Diego, CA First -- A short background
NIDIS Intermountain West Drought Early Warning System January 16, 2018
 NIDIS Drought and Water Assessment NIDIS Intermountain West Drought Early Warning System January 16, 2018 Precipitation The images above use daily precipitation statistics from NWS COOP, CoCoRaHS, and
FORECAST-BASED OPERATIONS AT FOLSOM DAM AND LAKE
 FORECAST-BASED OPERATIONS AT FOLSOM DAM AND LAKE 255 237 237 237 217 217 217 200 200 200 0 163 131 Bridging the Gap163Conference 255 0 132 255 0 163 122 The Dana on Mission Bay San Diego, CA January 28,
San Francisco Public Utilities Commission Hydrological Conditions Report For April 2014
 San Francisco Public Utilities Commission Hydrological Conditions Report For April 2014 J. Chester, C. Graham, A. Mazurkiewicz, & M. Tsang, May 13, 2014 Snow in the High Country The view from Bond Pass
The Climate of Payne County
 The Climate of Payne County Payne County is part of the Central Great Plains in the west, encompassing some of the best agricultural land in Oklahoma. Payne County is also part of the Crosstimbers in the
A Review of the 2003 Water Year in Colorado
 Hydrology Days 24 A Review of the 23 Water Year in Colorado Nolan J. Doesken 1 Colorado Climate Center, Atmospheric Science Department, Colorado State University, Fort Collins, Colorado Michael A. Gillespie
PRECIPITATION. Last Week Precipitation:
 7/23/2014 NIDIS Drought and Water Assessment PRECIPITATION The images above use daily precipitation statistics from NWS COOP, CoCoRaHS, and CoAgMet stations. From top to bottom, and left to right: most
-Assessment of current water conditions. - Precipitation Forecast. - Recommendations for Drought Monitor
 June 1, 2010 -Assessment of current water conditions - Precipitation Forecast - Recommendations for Drought Monitor Snotel WYTD Precipitation as Percentage of Average Upper Colorado Headwaters 88% of
-Assessment of current water conditions. - Precipitation Forecast. - Recommendations for Drought Monitor
 May 31 st, 2011 -Assessment of current water conditions - Precipitation Forecast - Recommendations for Drought Monitor Upper Colorado River Basin Snow Snowpack % of average to date: 347% Percent
NIDIS Weekly Climate, Water and Drought Assessment Summary. Upper Colorado River Basin July 31, 2012
 NIDIS Weekly Climate, Water and Drought Assessment Summary Upper Colorado River Basin July 31, 2012 Fig. 1: July month-to-date precipitation in inches. Fig. 2: SNOTEL WYTD precipitation percentiles (50%
-Assessment of current water conditions. - Precipitation Forecast. - Recommendations for Drought Monitor
 April 20 th, 2010 -Assessment of current water conditions - Precipitation Forecast - Recommendations for Drought Monitor 7 Day Precipitation 12-18 April 2010 Month-to-Date Precipitation 1-28 March 2010
The Colorado Drought of 2002 in Perspective
 The Colorado Drought of 2002 in Perspective Colorado Climate Center Nolan Doesken and Roger Pielke, Sr. Prepared by Tara Green and Odie Bliss http://climate.atmos.colostate.edu Known Characteristics of
Wind River Indian Reservation and Surrounding Area Climate and Drought Summary
 Northern Arapaho Tribe Wind River Indian Reservation and Surrounding Area Climate and Drought Summary Spring Events & Summer Outlook 2015 Spring Was Warm And Very Wet Across The Region The spring season
Drought and Future Water for Southern New Mexico
 Drought and Future Water for Southern New Mexico David S. Gutzler University of New Mexico gutzler@unm.edu * The big drought of 2018 * Longer term challenges for water supply * Forecasting streamflow Elephant
Colorado weather and climate update: a bit more than halfway through the water year (Or: What s going on with the weather?? )
") Colorado weather and climate update: a bit more than halfway through the water year (Or: What s going on with the weather?? ) Russ S. Schumacher Colorado State Climatologist Director, Colorado Climate
Colorado weather and climate update: a bit more than halfway through the water year (Or: What s going on with the weather?? ) Russ S. Schumacher Colorado State Climatologist Director, Colorado Climate
Table of Contents. Page
 Eighteen Years (1990 2007) of Climatological Data on NMSU s Corona Range and Livestock Research Center Research Report 761 L. Allen Torell, Kirk C. McDaniel, Shad Cox, Suman Majumdar 1 Agricultural Experiment
ACCUMULATED PRECIPITATION IN INCHES
 4 3 CUMULATIVE PRECIPITATION WATER YEAR 7 COLUMBIA BASIN ABOVE GRAND COULEE 18% of Normal 1971- Average ACCUMULATED PRECIPITATION IN INCHES 1 3 1 4 3 1 8 6 4 94% of Normal 17% of Normal 118% of Normal
Kootenai Basin Water Supply Update and Sturgeon Flow Augmentation Kootenai Valley Resource Initiative
 Kootenai Basin Water Supply Update and Sturgeon Flow Augmentation Kootenai Valley Resource Initiative Greg Hoffman Fishery Biologist / Kootenai River Basin Flood Engineer Libby Dam 15 May 2017 US Army
Monthly Long Range Weather Commentary Issued: February 15, 2015 Steven A. Root, CCM, President/CEO
 Monthly Long Range Weather Commentary Issued: February 15, 2015 Steven A. Root, CCM, President/CEO sroot@weatherbank.com JANUARY 2015 Climate Highlights The Month in Review During January, the average
Colorado Water Supply Outlook Report January 1, 2018
 Colorado Water Supply Outlook Report January 1, 2018 A mid-mountain vantage point at Crested Butte Ski area provides a view of the low-snow conditions in the surrounding area. On December 19 th, when this
Water Supply Conditions and Outlook June 4, 2018
 Water Supply Conditions and Outlook June 4, 2018 Flow Forecasting & Operations Planning Water Security Agency Overview Water supply conditions across Saskatchewan are generally good with most reservoir
NIDIS Drought and Water Assessment
 NIDIS Drought and Water Assessment PRECIPITATION The images above use daily precipitation statistics from NWS COOP, CoCoRaHS, and CoAgMet stations. From top to bottom, and left to right: most recent 7-days
NIDIS Intermountain West Drought Early Warning System September 4, 2018
 NIDIS Drought and Water Assessment NIDIS Intermountain West Drought Early Warning System September 4, 2018 Precipitation The images above use daily precipitation statistics from NWS COOP, CoCoRaHS, and
PRECIPITATION. Last Week Precipitation:
 12/1/2015 NIDIS Drought and Water Assessment PRECIPITATION The images above use daily precipitation statistics from NWS COOP, CoCoRaHS, and CoAgMet stations. From top to bottom, and left to right: most
NIDIS Intermountain West Drought Early Warning System November 13, 2018
 NIDIS Intermountain West Drought Early Warning System November 13, 2018 Precipitation The images above use daily precipitation statistics from NWS COOP, CoCoRaHS, and CoAgMet stations. From top to bottom,
Intermountain West Climate Summary
 Intermountain West Climate Summary by The Western Water Assessment Issued April 21, 2006 April 2006 Climate Summary Hydrological Conditions Most of the Intermountain West region is not in drought conditions
The Documentation of Extreme Hydrometeorlogical Events: Two Case Studies in Utah, Water Year 2005
 The Documentation of Extreme Hydrometeorlogical Events: Two Case Studies in Utah, Water Year 2005 Tim Bardsley1*, Mark Losleben2, Randy Julander1 1. USDA, NRCS, Snow Survey Program, Salt Lake City, Utah.
PRECIPITATION. Last Week Precipitation:
 PRECIPITATION The images above use daily precipitation statistics from NWS COOP, CoCoRaHS, and CoAgMet stations. From top to bottom, and left to right: most recent 7-days of accumulated precipitation in
-Assessment of current water conditions. - Precipitation Forecast. - Recommendations for Drought Monitor
 2 May 8 th, 2012 -Assessment of current water conditions - Precipitation Forecast - Recommendations for Drought Monitor AHPS Analysis 5/7/12 7-day average discharge compared to historical
Upper Missouri River Basin May 2018 Calendar Year Runoff Forecast May 4, 2018
 Calendar Year Runoff Forecast Explanation and Purpose of Forecast Upper Missouri River Basin May 2018 Calendar Year Runoff Forecast May 4, 2018 U.S. Army Corps of Engineers, Northwestern Division Missouri
The Climate of Grady County
 The Climate of Grady County Grady County is part of the Central Great Plains, encompassing some of the best agricultural land in Oklahoma. Average annual precipitation ranges from about 33 inches in northern