NIDIS Intermountain West Drought Early Warning System November 13, 2018
|
|
|
- Amos Bruce
- 5 years ago
- Views:
Transcription

1 NIDIS Intermountain West Drought Early Warning System November 13, 2018 Precipitation The images above use daily precipitation statistics from NWS COOP, CoCoRaHS, and CoAgMet stations. From top to bottom, and left to right: most recent 7-days of accumulated precipitation in inches; current month-to-date accumulated precipitation in inches; last month's precipitation as a percent of average; water-year-to-date precipitation as a percent of average. Standardized Precipitation Index
2 Standardized Precipitation Index standardizes precipitation accumulations for a specified time period into percentile rankings to -1.5 is equivalent to a D1 to D to -2.0 is equivalent to a D2 to D and worse is equivalent to a D3 to D and 60-day SPIs focus on shortterm conditions while 6- and 9-month SPIs focus on long-term conditions. SPI data provided by High Plains Regional Climate Center. Streamflow
3


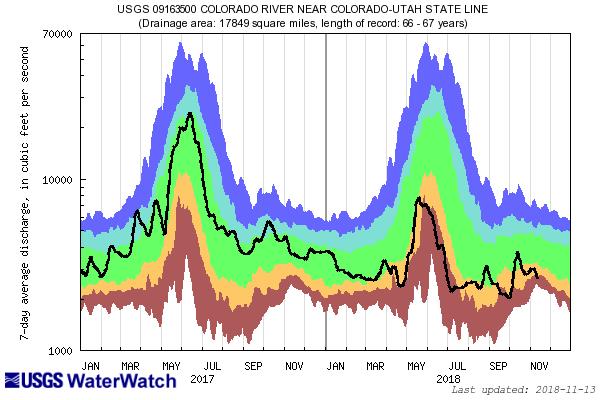
4 The top left image shows 7-day averaged streamflows as a percentile ranking across the UCRB. The top right image shows 7-day averaged discharge over time at three key sites around the UCRB: The Colorado River at the CO-UT state line; the Green River at Green River, UT; and the San Juan River near Bluff, UT. All streamflow data provided by United States Geological Survey. Surface Water The top left image shows VIC modeled soil moisture as a percentile ranking. The top right image shows satellite-derived vegetation from the VegDRI product (which updates on Mondays).
.")


5 The graphs shown below are plots of reservoir volumes over the past full year and current year to date (black). The dashed line at the top of each graphic indicates the reservoir's capacity, and the background color-coded shading provides context for the range of reservoir levels observed over the past 30 years. The data are obtained from the Bureau of Reclamation. Some of the reservoir percentiles don't line up at the new year due to differences in reservoir levels at the beginning of 1985 and the end of Dead storage has been subtracted. Note: Lake Granby data are obtained from the Colorado Division of Water Resources, and only goes back to the year Evaporative Demand The above images are of reference evapotranspiration (ET) from CoAgMET sites across Colorado. Reference ET assumes the amount of water that will evaporate from a well-irrigated crop. Higher ET rates occur during hot, dry, and windy conditions. Lower ET rates are more desirable for crops. See a map of locations for the above ET sites.

6 The above images are available courtesy of NOAA s Evaporative Demand Drought Index (EDDI). Drought classification listed is a function of the depth of reference evapotranspiration accumulated over a given period of record with respect to a climatology of The drought categories displayed are in line with the US Drought Monitor's Percentile Ranking Scheme. Data used to generate these maps come from the North American Land Data Assimilation System Phase-2 (NLDAS-2) project, which assimilates observations of temperature, wind speed, radiation, and vapor pressure deficit. The date indicates the last day of the period of record, and the week number indicates the window size for the period of record. Temperature
. Temperature departure maps provided by HPRCC ACIS. Condition Monitoring and Impacts")
7 All images show temperature departures from average over different time periods (last 7 days on top left; month-to-date on top right; last full month on bottom). Temperature departure maps provided by HPRCC ACIS. Condition Monitoring and Impacts

8 Map of current condition monitoring reports submitted to CoCoRaHS in the last week overlaid on the current U.S. Drought Monitor depiction. Specific impacts reports from local experts listed below. USGS: Updated rankings from the three key indicator gages of cumulative discharge for WY2018 are Colorado River near CO-UT State Line ranked 8th lowest in 67-year record Green River at Green River, UT ranked 25th lowest in 115-year record San Juan River near Bluff, UT ranked 1st lowest in 92-year record Crowley/Otero Counties, CO FSA Everyone is happy with the start of the new water year. But the FSA office is starting to really see impacts from the last season % losses in corn yields. Alfalfa fared better because the first cutting is the most important % of normal production. Producers are paying close attention to the reservoir and snowpack maps this season, as a near-normal to decent snowpack year generally results in a near-normal to decent growing season and yield. Outlook


9 The top two images show Climate Prediction Center's Precipitation and Temperature outlooks for 8-14 days. The middle image shows the Weather Prediction Center's Quantitative Precipitation Forecast accumulation for seven days. The bottom left image shows the 3-month precipitation outlook from Climate Prediction Center, and the bottom right image shows the Climate Prediction Center's most recent release of the U.S. Seasonal Drought Outlook. >
10 Summary and Recommendations Above is the most recent release of the U.S. Drought Monitor map for the UCRB region. Below shows the proposed changes for this week, with supporting text.

11 Summary: November 13, 2018 It was a drier week through much of the Intermountain West region, particularly the UCRB, Arizona and western New Mexico. A nice upslope event brought some widespread snowfall to the Front Range from southern Wyoming down to central New Mexico. Precipitation amounts were mainly in the 0.25 to 0.50" range, however Boulder, Huerfano and Las Animas counties saw areas of up to and over an inch. North central New Mexico, particularly Taos County also saw over an inch of precipitation. The higher elevations in Colorado, Wyoming and New Mexico have seen a good start to the snowpack season, while Utah has already fallen behind. It is early in the season and conditions can still go either way. The next week looks favorable for Wyoming and north central Colorado, however the 8-14 day outlook is showing favorable conditions for Colorado, Utah, New Mexico and Arizona. Recommendations: UCRB: Status quo. While snow fell in the higher elevations in Colorado, it wasn't enough to start making up deficits.
12 Front Range of CO: Recommending pushing the D1 along the Larimer/Jackson and Boulder/Grand county lines west thanks to decent snowfalls over the past 2 weeks. We looked at improving Boulder County to D nada, however that would leave a very small odd pocket as the surrounding area is not quite ready to be improved. We will leave this up to the Drought Monitor Author this week. Recommending a 1-category improvement from D3 to D2 in southern Huerfano and northern Las Animas counties. Last week saw the second decent precipitation event in the last 2-3 weeks, with at least 0.50" and up to 1.50" of precipitation and now up to 2" above normal over the past 30-days. Eastern CO: Status quo.
NIDIS Intermountain West Drought Early Warning System April 16, 2019
 NIDIS Intermountain West Drought Early Warning System April 16, 2019 Precipitation The images above use daily precipitation statistics from NWS COOP, CoCoRaHS, and CoAgMet stations. From top to bottom,
NIDIS Intermountain West Drought Early Warning System November 14, 2017
 NIDIS Intermountain West Drought Early Warning System November 14, 2017 Precipitation The images above use daily precipitation statistics from NWS COOP, CoCoRaHS, and CoAgMet stations. From top to bottom,
NIDIS Intermountain West Drought Early Warning System December 18, 2018
 NIDIS Intermountain West Drought Early Warning System December 18, 2018 Precipitation The images above use daily precipitation statistics from NWS COOP, CoCoRaHS, and CoAgMet stations. From top to bottom,
NIDIS Intermountain West Drought Early Warning System January 22, 2019
 NIDIS Drought and Water Assessment NIDIS Intermountain West Drought Early Warning System January 22, 2019 Precipitation The images above use daily precipitation statistics from NWS COOP, CoCoRaHS, and
NIDIS Intermountain West Drought Early Warning System December 11, 2018
 NIDIS Drought and Water Assessment NIDIS Intermountain West Drought Early Warning System December 11, 2018 Precipitation The images above use daily precipitation statistics from NWS COOP, CoCoRaHS, and
NIDIS Intermountain West Drought Early Warning System July 18, 2017
 NIDIS Drought and Water Assessment NIDIS Intermountain West Drought Early Warning System July 18, 2017 Precipitation The images above use daily precipitation statistics from NWS COOP, CoCoRaHS, and CoAgMet
NIDIS Intermountain West Drought Early Warning System August 8, 2017
 NIDIS Drought and Water Assessment 8/8/17, 4:43 PM NIDIS Intermountain West Drought Early Warning System August 8, 2017 Precipitation The images above use daily precipitation statistics from NWS COOP,
NIDIS Intermountain West Regional Drought Early Warning System February 7, 2017
 NIDIS Drought and Water Assessment NIDIS Intermountain West Regional Drought Early Warning System February 7, 2017 Precipitation The images above use daily precipitation statistics from NWS COOP, CoCoRaHS,
NIDIS Intermountain West Drought Early Warning System February 19, 2019
 NIDIS Intermountain West Drought Early Warning System February 19, 2019 Precipitation The images above use daily precipitation statistics from NWS COOP, CoCoRaHS, and CoAgMet stations. From top to bottom,
NIDIS Intermountain West Drought Early Warning System September 4, 2018
 NIDIS Drought and Water Assessment NIDIS Intermountain West Drought Early Warning System September 4, 2018 Precipitation The images above use daily precipitation statistics from NWS COOP, CoCoRaHS, and
NIDIS Intermountain West Drought Early Warning System November 21, 2017
 NIDIS Drought and Water Assessment NIDIS Intermountain West Drought Early Warning System November 21, 2017 Precipitation The images above use daily precipitation statistics from NWS COOP, CoCoRaHS, and
Precipitation. Standardized Precipitation Index. NIDIS Intermountain West Regional Drought Early Warning System January 3, 2017
 1/3/2017 NIDIS Drought and Water Assessment NIDIS Intermountain West Regional Drought Early Warning System January 3, 2017 Precipitation The images above use daily precipitation statistics from NWS COOP,
NIDIS Intermountain West Drought Early Warning System October 30, 2018
 10/30/2018 NIDIS Drought and Water Assessment NIDIS Intermountain West Drought Early Warning System October 30, 2018 Precipitation The images above use daily precipitation statistics from NWS COOP, CoCoRaHS,
NIDIS Intermountain West Drought Early Warning System February 12, 2019
 NIDIS Intermountain West Drought Early Warning System February 12, 2019 Precipitation The images above use daily precipitation statistics from NWS COOP, CoCoRaHS, and CoAgMet stations. From top to bottom,
NIDIS Intermountain West Drought Early Warning System October 17, 2017
 NIDIS Drought and Water Assessment NIDIS Intermountain West Drought Early Warning System October 17, 2017 Precipitation The images above use daily precipitation statistics from NWS COOP, CoCoRaHS, and
NIDIS Intermountain West Drought Early Warning System May 23, 2017
 NIDIS Drought and Water Assessment NIDIS Intermountain West Drought Early Warning System May 23, 2017 Precipitation The images above use daily precipitation statistics from NWS COOP, CoCoRaHS, and CoAgMet
NIDIS Intermountain West Drought Early Warning System February 6, 2018
 NIDIS Intermountain West Drought Early Warning System February 6, 2018 Precipitation The images above use daily precipitation statistics from NWS COOP, CoCoRaHS, and CoAgMet stations. From top to bottom,
NIDIS Intermountain West Drought Early Warning System January 15, 2019
 NIDIS Drought and Water Assessment NIDIS Intermountain West Drought Early Warning System January 15, 2019 Precipitation The images above use daily precipitation statistics from NWS COOP, CoCoRaHS, and
NIDIS Intermountain West Drought Early Warning System March 26, 2019
 NIDIS Intermountain West Drought Early Warning System March 26, 2019 The images above use daily precipitation statistics from NWS COOP, CoCoRaHS, and CoAgMet stations. From top to bottom, and left to right:
NIDIS Intermountain West Drought Early Warning System December 4, 2018
 12/4/2018 NIDIS Drought and Water Assessment NIDIS Intermountain West Drought Early Warning System December 4, 2018 Precipitation The images above use daily precipitation statistics from NWS COOP, CoCoRaHS,
NIDIS Intermountain West Drought Early Warning System January 16, 2018
 NIDIS Drought and Water Assessment NIDIS Intermountain West Drought Early Warning System January 16, 2018 Precipitation The images above use daily precipitation statistics from NWS COOP, CoCoRaHS, and
NIDIS Intermountain West Drought Early Warning System December 30, 2018
 1/2/2019 NIDIS Drought and Water Assessment NIDIS Intermountain West Drought Early Warning System December 30, 2018 Precipitation The images above use daily precipitation statistics from NWS COOP, CoCoRaHS,
Precipitation. Standardized Precipitation Index. NIDIS Intermountain West Drought Early Warning System September 5, 2017
 9/6/2017 NIDIS Drought and Water Assessment NIDIS Intermountain West Drought Early Warning System September 5, 2017 Precipitation The images above use daily precipitation statistics from NWS COOP, CoCoRaHS,
NIDIS Intermountain West Drought Early Warning System May 1, 2018
 NIDIS Intermountain West Drought Early Warning System May 1, 2018 Precipitation The images above use daily precipitation statistics from NWS COOP, CoCoRaHS, and CoAgMet stations. From top to bottom, and
Precipitation. Standardized Precipitation Index. NIDIS Intermountain West Regional Drought Early Warning System December 6, 2016
 12/9/2016 NIDIS Drought and Water Assessment NIDIS Intermountain West Regional Drought Early Warning System December 6, 2016 Precipitation The images above use daily precipitation statistics from NWS COOP,
NIDIS Intermountain West Drought Early Warning System April 18, 2017
 1 of 11 4/18/2017 3:42 PM Precipitation NIDIS Intermountain West Drought Early Warning System April 18, 2017 The images above use daily precipitation statistics from NWS COOP, CoCoRaHS, and CoAgMet stations.
NIDIS Intermountain West Drought Early Warning System April 24, 2018
 NIDIS Intermountain West Drought Early Warning System April 24, 2018 Precipitation The images above use daily precipitation statistics from NWS COOP, CoCoRaHS, and CoAgMet stations. From top to bottom,
NIDIS Drought and Water Assessment
 NIDIS Drought and Water Assessment PRECIPITATION The images above use daily precipitation statistics from NWS COOP, CoCoRaHS, and CoAgMet stations. From top to bottom, and left to right: most recent 7-days
NIDIS Drought and Water Assessment
 7/23/13 1:57 PM PRECIPITATION The images above use daily precipitation statistics from NWS COOP, CoCoRaHS, and CoAgMet stations. From top to bottom, and left to right: most recent 7-days of accumulated
PRECIPITATION. Last Week Precipitation:
 12/3/2014 NIDIS Drought and Water Assessment PRECIPITATION The images above use daily precipitation statistics from NWS COOP, CoCoRaHS, and CoAgMet stations. From top to bottom, and left to right: most
PRECIPITATION. Last Week Precipitation:
 2/24/2015 NIDIS Drought and Water Assessment PRECIPITATION The images above use daily precipitation statistics from NWS COOP, CoCoRaHS, and CoAgMet stations. From top to bottom, and left to right: most
PRECIPITATION. Last Week Precipitation:
 PRECIPITATION The images above use daily precipitation statistics from NWS COOP, CoCoRaHS, and CoAgMet stations. From top to bottom, and left to right: most recent 7-days of accumulated precipitation in
PRECIPITATION. Last Week Precipitation:
 7/23/2014 NIDIS Drought and Water Assessment PRECIPITATION The images above use daily precipitation statistics from NWS COOP, CoCoRaHS, and CoAgMet stations. From top to bottom, and left to right: most
NIDIS Weekly Climate, Water and Drought Assessment Summary. Upper Colorado River Basin July 31, 2012
 NIDIS Weekly Climate, Water and Drought Assessment Summary Upper Colorado River Basin July 31, 2012 Fig. 1: July month-to-date precipitation in inches. Fig. 2: SNOTEL WYTD precipitation percentiles (50%
NIDIS Weekly Climate, Water and Drought Assessment Summary Upper Colorado River Basin Pilot Project 13 July 2010
 NIDIS Weekly Climate, Water and Drought Assessment Summary Upper Colorado River Basin Pilot Project 13 July 2010 Precipitation and Snowpack Over the past week, precipitation in the Upper Colorado River
-Assessment of current water conditions. - Precipitation Forecast. - Recommendations for Drought Monitor
 2 June 26 th, 2012 -Assessment of current water conditions - Precipitation Forecast - Recommendations for Drought Monitor CMPDSI Value Percentile Rank Characteristic -1.0 - -1.9 21-30 Abnormally
NIDIS Drought and Water Assessment
 NIDIS Drought and Water Assessment PRECIPITATION The images above use daily precipitation statistics from NWS COOP, CoCoRaHS, and CoAgMet stations. From top to bottom, and left to right: most recent 7-days
PRECIPITATION. Last Week Precipitation:
 PRECIPITATION The images above use daily precipitation statistics from NWS COOP, CoCoRaHS, and CoAgMet stations. From top to bottom, and left to right: most recent 7-days of accumulated precipitation in
PRECIPITATION. Last Week Precipitation:
 3/30/2016 NIDIS Drought and Water Assessment PRECIPITATION The images above use daily precipitation statistics from NWS COOP, CoCoRaHS, and CoAgMet stations. From top to bottom, and left to right: most
NIDIS Weekly Climate, Water and Drought Assessment Summary. Upper Colorado River Basin
 NIDIS Weekly Climate, Water and Drought Assessment Summary Upper Colorado River Basin August 3, 2010 Precipitation and Snowpack Fig. 1: July precipitation in inches Fig. 2: July precip as percent of average
-Assessment of current water conditions. - Precipitation Forecast. - Recommendations for Drought Monitor
 2 May 8 th, 2012 -Assessment of current water conditions - Precipitation Forecast - Recommendations for Drought Monitor AHPS Analysis 5/7/12 7-day average discharge compared to historical
-Assessment of current water conditions. - Precipitation Forecast. - Recommendations for Drought Monitor
 2 May 1 st, 2012 -Assessment of current water conditions - Precipitation Forecast - Recommendations for Drought Monitor AHPS Water Year Precipitation as Percentage of Normal 7-day average
PRECIPITATION. Last Week Precipitation:
 12/30/2014 NIDIS Drought and Water Assessment PRECIPITATION The images above use daily precipitation statistics from NWS COOP, CoCoRaHS, and CoAgMet stations. From top to bottom, and left to right: most
 October 16 th, 2012 2010-12 La Niña event reached its biggest peak since the mid-70s in late 2010, followed by a brief excursion to ENSOneutral conditions during mid-2011; it reached a second peak last
PRECIPITATION. Last Week Precipitation:
 12/1/2015 NIDIS Drought and Water Assessment PRECIPITATION The images above use daily precipitation statistics from NWS COOP, CoCoRaHS, and CoAgMet stations. From top to bottom, and left to right: most
-Assessment of current water conditions. - Precipitation Forecast. - Recommendations for Drought Monitor
 2 June 12, 2012 -Assessment of current water conditions - Precipitation Forecast - Recommendations for Drought Monitor 7-day average discharge compared to historical discharge for the day
Webinar and Weekly Summary February 15th, 2011
 Webinar and Weekly Summary February 15th, 2011 -Assessment of current water conditions - Precipitation Forecast - Recommendations for Drought Monitor Upper Colorado Normal Precipitation Upper Colorado
NIDIS Weekly Climate, Water and Drought Assessment Summary. Upper Colorado River Basin February 12, 2013
 NIDIS Weekly Climate, Water and Drought Assessment Summary Upper Colorado River Basin February 12, 2013 Fig. 1: January precipitagon as a percent of average. Fig. 2: February 1 9 precipitagon in inches.
PRECIPITATION. Last Week Precipitation:
 4/28/2015 NIDIS Drought and Water Assessment PRECIPITATION The images above use daily precipitation statistics from NWS COOP, CoCoRaHS, and CoAgMet stations. From top to bottom, and left to right: most
NIDIS Weekly Climate, Water and Drought Assessment Summary. Upper Colorado River Basin September 20, 2011
 NIDIS Weekly Climate, Water and Drought Assessment Summary Upper Colorado River Basin September 20, 2011 PrecipitaEon and Snowpack Fig. 1: September month to date precipitaeon in inches. Fig. 2: September
NIDIS Weekly Climate, Water and Drought Assessment Summary. Upper Colorado River Basin June 26, 2012
 NIDIS Weekly Climate, Water and Drought Assessment Summary Upper Colorado River Basin June 26, 2012 Fig. 1: June 17 23 precipitafon in inches. Fig. 2: SNOTEL WYTD precipitafon percenfles (50% is median,
NIDIS Weekly Climate, Water and Drought Assessment Summary. Upper Colorado River Basin January 3, 2012
 NIDIS Weekly Climate, Water and Drought Assessment Summary Upper Colorado River Basin January 3, 2012 PrecipitaFon and Snowpack Fig. 1: December precipitafon as a percent of average. Fig. 2: December 25
PRECIPITATION. Last Week Precipitation:
 5/19/2015 NIDIS Drought and Water Assessment PRECIPITATION The images above use daily precipitation statistics from NWS COOP, CoCoRaHS, and CoAgMet stations. From top to bottom, and left to right: most
NIDIS Weekly Climate, Water and Drought Assessment Summary. Upper Colorado River Basin February 28, 2012
 NIDIS Weekly Climate, Water and Drought Assessment Summary Upper Colorado River Basin February 28, 2012 PrecipitaGon and Snowpack Fig. 1: February month- to- date precipitagon in inches. Fig. 2: February
PRECIPITATION. Last Week Precipitation:
 1/28/2015 NIDIS Drought and Water Assessment PRECIPITATION The images above use daily precipitation statistics from NWS COOP, CoCoRaHS, and CoAgMet stations. From top to bottom, and left to right: most
-Assessment of current water conditions. - Precipitation Forecast. - Recommendations for Drought Monitor
 April 27, 2010 -Assessment of current water conditions - Precipitation Forecast - Recommendations for Drought Monitor 7 Day Precipitation 19-25 April 2010 Month-to-Date Precipitation 1-25 April 2010
-Assessment of current water conditions. - Precipitation Forecast. - Recommendations for Drought Monitor
 June 1, 2010 -Assessment of current water conditions - Precipitation Forecast - Recommendations for Drought Monitor Snotel WYTD Precipitation as Percentage of Average Upper Colorado Headwaters 88% of
-Assessment of current water conditions. - Precipitation Forecast. - Recommendations for Drought Monitor
 May 31 st, 2011 -Assessment of current water conditions - Precipitation Forecast - Recommendations for Drought Monitor Upper Colorado River Basin Snow Snowpack % of average to date: 347% Percent
PRECIPITATION. Last Week Precipitation:
 9/9/2015 NIDIS Drought and Water Assessment PRECIPITATION The images above use daily precipitation statistics from NWS COOP, CoCoRaHS, and CoAgMet stations. From top to bottom, and left to right: most
NIDIS Weekly Climate, Water and Drought Assessment Summary. Upper Colorado River Basin November 22, 2011
 NIDIS Weekly Climate, Water and Drought Assessment Summary Upper Colorado River Basin November 22, 2011 PrecipitaEon and Snowpack Fig. 1: November month to date precipitaeon in inches. Fig. 2: November
NIDIS Weekly Climate, Water and Drought Assessment Summary. Upper Colorado River Basin May 29, 2012
 NIDIS Weekly Climate, Water and Drought Assessment Summary Upper Colorado River Basin May 29, 2012 PrecipitaFon and Snowpack Fig. 1: May 1 19 precipitafon in inches. Fig. 2: May 20 27 precipitafon in inches.
PRECIPITATION. Last Week Precipitation:
 10/21/2015 NIDIS Drought and Water Assessment PRECIPITATION The images above use daily precipitation statistics from NWS COOP, CoCoRaHS, and CoAgMet stations. From top to bottom, and left to right: most
NIDIS Weekly Climate, Water and Drought Assessment Summary. Upper Colorado River Basin September 27, 2011
 NIDIS Weekly Climate, Water and Drought Assessment Summary Upper Colorado River Basin September 27, 2011 PrecipitaFon and Snowpack Fig. 1: Water year to date precipitafon as a percent of average. Fig.
PRECIPITATION. Last Week Precipitation:
 7/14/2015 NIDIS Drought and Water Assessment PRECIPITATION The images above use daily precipitation statistics from NWS COOP, CoCoRaHS, and CoAgMet stations. From top to bottom, and left to right: most
PRECIPITATION. Last Week Precipitation:
 6/23/2015 NIDIS Drought and Water Assessment PRECIPITATION The images above use daily precipitation statistics from NWS COOP, CoCoRaHS, and CoAgMet stations. From top to bottom, and left to right: most
NIDIS Weekly Climate, Water and Drought Assessment Summary. Upper Colorado River Basin June 28, 2011
 NIDIS Weekly Climate, Water and Drought Assessment Summary Upper Colorado River Basin June 28, 2011 PrecipitaFon and Snowpack Fig. 1: June month to date precipitafon in inches. Fig. 2: June 19 25 precipitafon
NIDIS Weekly Climate, Water and Drought Assessment Summary. Upper Colorado River Basin July 12, 2011
 NIDIS Weekly Climate, Water and Drought Assessment Summary Upper Colorado River Basin July 12, 2011 PrecipitaEon and Snowpack Fig. 1: October June precipitaeon as a percent of average. Fig. 2: July month
NIDIS Weekly Climate, Water and Drought Assessment Summary. Upper Colorado River Basin June 21, 2011
 NIDIS Weekly Climate, Water and Drought Assessment Summary Upper Colorado River Basin June 21, 2011 PrecipitaEon and Snowpack Fig. 1: June month to date precipitaeon in inches. Fig. 2: 24 hour accumulated
PRECIPITATION. Last Week Precipitation:
 9/29/2015 NIDIS Drought and Water Assessment PRECIPITATION The images above use daily precipitation statistics from NWS COOP, CoCoRaHS, and CoAgMet stations. From top to bottom, and left to right: most
NIDIS Weekly Climate, Water and Drought Assessment Summary. Upper Colorado River Basin May 31, 2011
 NIDIS Weekly Climate, Water and Drought Assessment Summary Upper Colorado River Basin May 31, 2011 PrecipitaFon and Snowpack Fig. 1: May month to date precipitafon in inches. Fig. 2: May 22 28 precipitafon
-Assessment of current water conditions. - Precipitation Forecast. - Recommendations for Drought Monitor
 April 20 th, 2010 -Assessment of current water conditions - Precipitation Forecast - Recommendations for Drought Monitor 7 Day Precipitation 12-18 April 2010 Month-to-Date Precipitation 1-28 March 2010
NIDIS Weekly Climate, Water and Drought Assessment Summary. Upper Colorado River Basin July 26, 2011
 NIDIS Weekly Climate, Water and Drought Assessment Summary Upper Colorado River Basin July 26, 2011 PrecipitaFon and Snowpack Fig. 1: July month to date precipitafon in inches. Fig. 2: July 17 23 precipitafon
Oregon Water Conditions Report April 17, 2017
 Oregon Water Conditions Report April 17, 2017 Mountain snowpack continues to maintain significant levels for mid-april. By late March, statewide snowpack had declined to 118 percent of normal after starting
PRECIPITATION. Last Week Precipitation:
 8/11/2015 NIDIS Drought and Water Assessment PRECIPITATION The images above use daily precipitation statistics from NWS COOP, CoCoRaHS, and CoAgMet stations. From top to bottom, and left to right: most
WeatherManager Weekly
 Issue 288 July 14, 2016 WeatherManager Weekly Industries We Serve Agriculture Energy/Utilities Construction Transportation Retail Our Weather Protection Products Standard Temperature Products Lowest Daily
Oregon Water Conditions Report May 1, 2017
 Oregon Water Conditions Report May 1, 2017 Mountain snowpack in the higher elevations has continued to increase over the last two weeks. Statewide, most low and mid elevation snow has melted so the basin
Illinois Drought Update, December 1, 2005 DROUGHT RESPONSE TASK FORCE Illinois State Water Survey, Department of Natural Resources
 Illinois Drought Update, December 1, 2005 DROUGHT RESPONSE TASK FORCE Illinois State Water Survey, Department of Natural Resources For more drought information please go to http://www.sws.uiuc.edu/. SUMMARY.
Monthly Long Range Weather Commentary Issued: February 15, 2015 Steven A. Root, CCM, President/CEO
 Monthly Long Range Weather Commentary Issued: February 15, 2015 Steven A. Root, CCM, President/CEO sroot@weatherbank.com JANUARY 2015 Climate Highlights The Month in Review During January, the average
Funding provided by NOAA Sectoral Applications Research Project MONITORING DROUGHT. Basic Climatology Colorado Climate Center
 Funding provided by NOAA Sectoral Applications Research Project MONITORING DROUGHT Basic Climatology Colorado Climate Center DEFINING DROUGHT First off, just what is drought? Define a tornado Define a
March 1, 2003 Western Snowpack Conditions and Water Supply Forecasts
 Natural Resources Conservation Service National Water and Climate Center 101 SW Main Street, Suite 1600 Portland, OR 97204-3224 Date: March 17, 2003 Subject: March 1, 2003 Western Snowpack Conditions and
Drought Update May 11, 2018
 Drought Update May 11, 2018 Current status After a record cold April, May has started with much warmer than normal temperatures. The statewide average temperature for the week ending on May 8th was 65.7
The U.S. Drought Monitor and tools from the National Drought Mitigation Center
 The U.S. Drought Monitor and tools from the National Drought Mitigation Center Brian Fuchs, Climatologist National Drought Mitigation Center School of Natural Resources University of Nebraska-Lincoln Winter
Upper Missouri River Basin December 2017 Calendar Year Runoff Forecast December 5, 2017
 Upper Missouri River Basin December 2017 Calendar Year Runoff Forecast December 5, 2017 Calendar Year Runoff Forecast Explanation and Purpose of Forecast U.S. Army Corps of Engineers, Northwestern Division
Wind River Indian Reservation and Surrounding Area Climate and Drought Summary
 Northern Arapaho Tribe Wind River Indian Reservation and Surrounding Area Climate and Drought Summary Summer Events & Fall Outlook 2015 Summer Was Near, Precipitation Was Highly Variable Across The Region
The United States Drought Monitor How is it Made?
 The United States Drought Monitor How is it Made? Brian Fuchs, Climatologist National Drought Mitigation Center School of Natural Resources University of Nebraska-Lincoln September 14-17, 2009 Bamako,
Monthly Long Range Weather Commentary Issued: APRIL 1, 2015 Steven A. Root, CCM, President/CEO
 Monthly Long Range Weather Commentary Issued: APRIL 1, 2015 Steven A. Root, CCM, President/CEO sroot@weatherbank.com FEBRUARY 2015 Climate Highlights The Month in Review The February contiguous U.S. temperature
Arizona Climate Summary
 August 2015 Temperature and Precipitation Summary Arizona Climate Summary September 2015 Summary of conditions for August 2015 August 1 st 16 th : August was a wet month across the state with only 3 days
The following information is provided for your use in describing climate and water supply conditions in the West as of April 1, 2003.
 Natural Resources Conservation Service National Water and Climate Center 101 SW Main Street, Suite 1600 Portland, OR 97204-3224 Date: April 8, 2003 Subject: April 1, 2003 Western Snowpack Conditions and
Highlights of the 2006 Water Year in Colorado
 Highlights of the 2006 Water Year in Colorado Nolan Doesken, State Climatologist Atmospheric Science Department Colorado State University http://ccc.atmos.colostate.edu Presented to 61 st Annual Meeting
A Review of the 2007 Water Year in Colorado
 A Review of the 2007 Water Year in Colorado Nolan Doesken Colorado Climate Center, CSU Mike Gillespie Snow Survey Division, USDA, NRCS Presented at the 28 th Annual AGU Hydrology Days, March 26, 2008,
Arizona Climate Summary February 2012
 Arizona Climate Summary February 2012 Summary of conditions for January 2012 January 2012 Temperature and Precipitation Summary January 1 st 20 th : The New Year has started on a very dry note. The La
The U.S. Drought Monitor: A Composite Indicator Approach
 The U.S. Drought Monitor: A Composite Indicator Approach Mark Svoboda, Climatologist Monitoring Program Area Leader National Drought Mitigation Center School of Natural Resources University of Nebraska-Lincoln
January 25, Summary
 January 25, 2013 Summary Precipitation since the December 17, 2012, Drought Update has been slightly below average in parts of central and northern Illinois and above average in southern Illinois. Soil
Climate Impacts to Southwest Water Sector. Dr. Dave DuBois New Mexico State Climatologist
 Climate Impacts to Southwest Water Sector Dr. Dave DuBois New Mexico State Climatologist Presented at EPA Extreme Events and Climate Adaptation Planning Workshop June 3, 2015 Water Year Precip. % of Average
Becky Bolinger Water Availability Task Force November 13, 2018
 Colorado Climate Center WATF Climate Update Becky Bolinger Water Availability Task Force November 13, 2018 COLORADO CLIMATE CENTER Water Year 2018 Colorado s Climate in Review COLORADO CLIMATE CENTER
Upper Missouri River Basin February 2018 Calendar Year Runoff Forecast February 6, 2018
 Upper Missouri River Basin February 2018 Calendar Year Runoff Forecast February 6, 2018 Calendar Year Runoff Forecast Explanation and Purpose of Forecast U.S. Army Corps of Engineers, Northwestern Division
DK DM M EMORANDUM D ECEMBER 28, 2018 SUBJECT:
 TO: CC: FROM: SUBJECT: BOARD OF DIRECTORS M EMORANDUM D ECEMBER 28, 2018 ANDY MUELLER, GENERAL MANAGER DAVE DK KANZER, P.E. & DON MEYER, P.E. DK DM COLORADO RIVER BASIN WATER SUPPLY CONDITIONS UPDATE AND
The History and Making of the U.S. Drought Monitor
 The History and Making of the U.S. Drought Monitor Mike Hayes, Director Mark Svoboda, Climatologist/Monitoring Program Area Leader Kelly Smith, Communications Specialist National Drought Mitigation Center
Arizona Climate Summary May 2018 Summary of conditions for April 2018
 April 2018 Temperature and Precipitation Summary Arizona Climate Summary May 2018 Summary of conditions for April 2018 April 1 st 16 th : April was a very dry month across Arizona. Several low pressure
The Colorado Drought : 2003: A Growing Concern. Roger Pielke, Sr. Colorado Climate Center.
 The Colorado Drought 2001-2003: 2003: A Growing Concern Roger Pielke, Sr. Colorado Climate Center Prepared by Tara Green and Odie Bliss http://climate.atmos.colostate.edu 2 2002 Drought History in Colorado