Kootenai Basin Water Supply Update and Sturgeon Flow Augmentation Kootenai Valley Resource Initiative
|
|
|
- Georgiana Cobb
- 6 years ago
- Views:
Transcription


1 Kootenai Basin Water Supply Update and Sturgeon Flow Augmentation Kootenai Valley Resource Initiative Greg Hoffman Fishery Biologist / Kootenai River Basin Flood Engineer Libby Dam 15 May 2017 US Army Corps of Engineers BUILDING STRONG

2 Percent of Average Precip 10/1/2016 4/2/2017 Average to Above-average precipitation fell in the basin over the winter
3 Precipitation by Month October November December January February March

4 Bonners Ferry Records Record October Precip Accumulated Precipitation since October, 2016 Record February Precip 3 rd wettest March Record 27.6 Average Oct. Apr.

5 Soil Moisture

6 Temperatures by Month October November December January February March

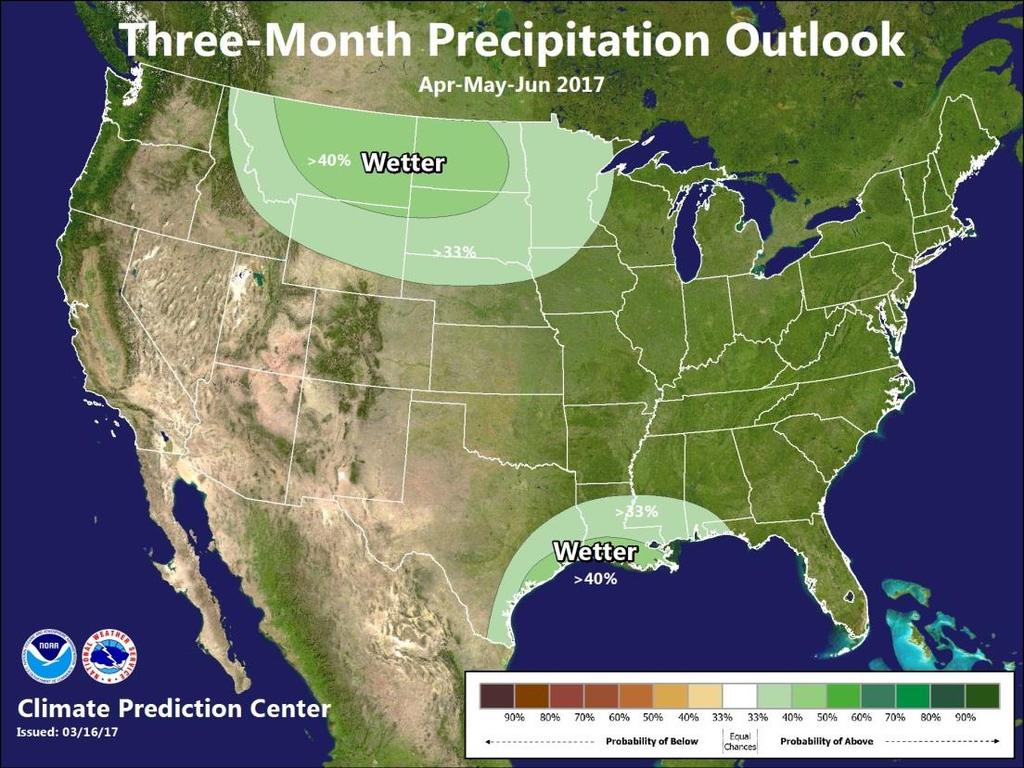
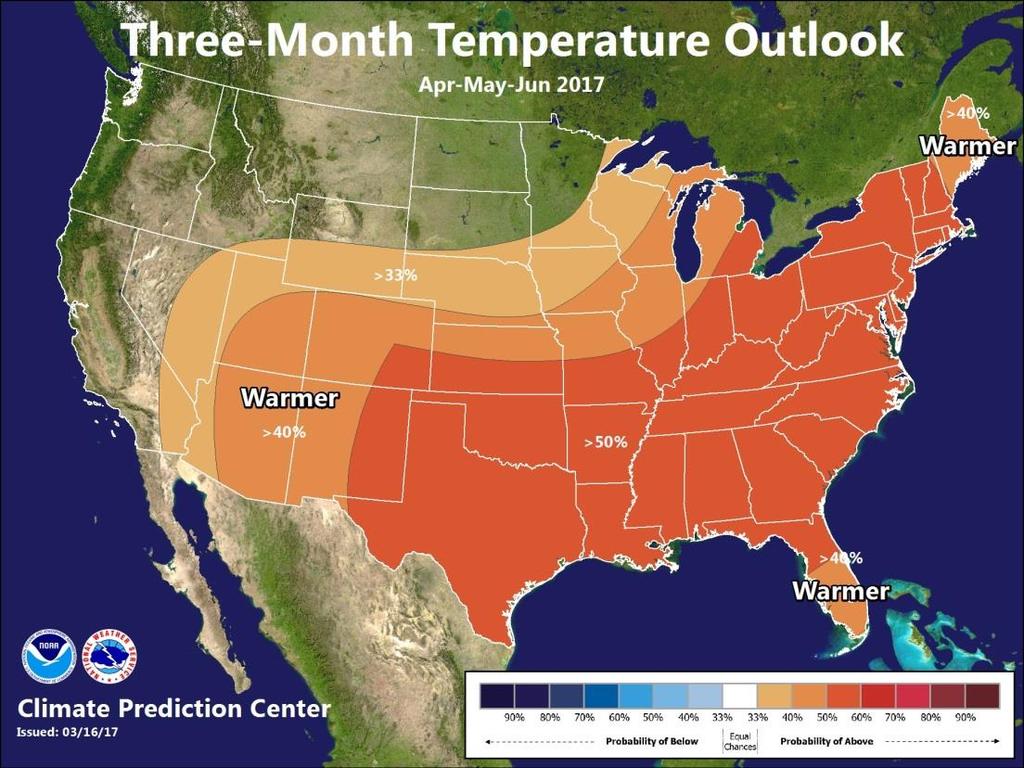
7 Climate Outlooks April-May-June

8 Flow (kcfs) Modeled using current ESP traces as of 05/10/17 85 Libby Dam Inflow- Probability Chart Corps of Engineers Projections Based on the 67 Ensemble Streamflow Prediction Traces Issued by the Northwest River Forecast Center, National Weather Service The data presented in this graph are provisional and are intended to provide an estimate of inflow to Libby Dam. How to read this graph: 75th percentile means that on that day, 75 percent of the traces were below this value. The median points indicate the values such that half of the traces were above and half were below The River Forecast Center public site for Libby Dam Forecasts is: 50th to 75th Percentile 25th to 50th Percentile Median Observed Bars Indicate 5th and 95th percentiles exeedances /1 11/1 12/1 1/1 2/1 3/1 4/1 Date 5/1 6/1 7/1 8/1 9/1 10/1

9 Elevation (ft) Modeled using current ESP traces as of 05/10/ th to 75th Percentile 25th to 50th Percentile Median Observed Bars Indicate 5th and 95th percentiles Lake Koocanusa Elevation - Probability Chart Corps of Engineers Projections Based on the 67 Ensemble Streamflow Prediction Traces Issued by the Northwest River Forecast Center, National Weather Service The data presented in this graph are provisional and are intended to provide an estimate of Libby Dam forebay elevation (Lake Koocanusa). How to read this graph: 75th percentile means that on that day, 75 percent of the traces were below this value. The median points indicate the values such that half of the traces were above and half were below. The River Forecast Center public site for Libby Dam Forecasts is: 10/1 11/1 12/1 1/1 2/1 3/1 4/1 5/1 6/1 7/1 8/1 9/1 Date 10/1
10 Flow (kcfs) Modeled using current ESP traces as of 05/10/17 40 Libby Dam Outflow - Probability Chart Corps of Engineers Projections Based on the 67 Ensemble Streamflow Prediction Traces Issued by the Northwest River Forecast Center, National Weather Service The data presented in this graph are provisional and are intended to provide an estimate of outflow from Libby Dam. How to read this graph: 75th percentile means that on that day, 75 percent of the traces were below this value. The median points indicate the values such that half of the traces were above and half were below The River Forecast Center public site for Libby Dam Forecasts is: 50th to 75th Percentile 25th to 50th Percentile Median Observed Bars Indicate 5th and 95th percentiles exeedances /1 11/1 12/1 1/1 2/1 3/1 4/1 Date 5/1 6/1 7/1 8/1 9/1 10/1

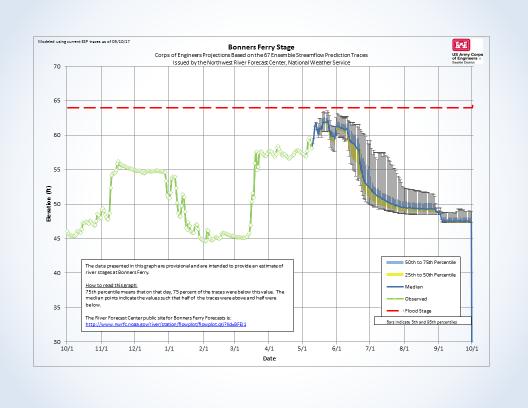
11 Elevation (ft) Modeled using current ESP traces as of 05/10/17 70 Bonners Ferry Stage Corps of Engineers Projections Based on the 67 Ensemble Streamflow Prediction Traces Issued by the Northwest River Forecast Center, National Weather Service The data presented in this graph are provisional and are intended to provide an estimate of river stages at Bonners Ferry. How to read this graph: 75th percentile means that on that day, 75 percent of the traces were below this value. The median points indicate the values such that half of the traces were above and half were below. The River Forecast Center public site for Bonners Ferry Forecasts is: 50th to 75th Percentile 25th to 50th Percentile Median Observed Flood Stage Bars Indicate 5th and 95th percentiles 30 10/1 11/1 12/1 1/1 2/1 3/1 4/1 Date 5/1 6/1 7/1 8/1 9/1 10/1
12 Bonners Ferry Stage (ft) Modeled using current ESP traces as of 05/10/ Maximum April-August Bonners Ferry Stage - Probability Chart Corps of Engineers Projections Based on the 67 Ensemble Streamflow Prediction Traces Issued by the Northwest River Forecast Center, National Weather Service The data presented in this graph is provisional and is intended to provide an estimate of the maximum river stage at Bonners Ferry. How to read this graph: The vertical lines indicate probabilities for the maximum stage this season at Bonners Ferry. For example, the line at 20% intersects with the curve at an elevation which is exceeded in 20% of the traces (model runs). A flat tail indicates that many runs have forecast peaks lower than an already observed peak. The River Forecast Center public site for Bonners Ferry Forecasts is: Maximum Bonners Ferry Elevation % 10% 20% 30% 40% 50% 60% 70% 80% 90% 100% Probability of Exceedence
13 Kootenai River Temperature and Flow Pre-Libby Dam vs Post-Libby Dam Temperature (C) Q (kcfs) /1 2/1 3/1 4/1 5/1 6/1 7/1 8/1 9/1 10/1 11/1 12/1 Copeland C '67-'72 Bonners Ferry Q '63-'72 Bonners Ferry C '94-'03 Bonners Ferry Q '94-'03
14
15 Flow (kcfs) Modeled using current ESP traces as of 05/10/17 40 Libby Dam Outflow - Probability Chart Corps of Engineers Projections Based on the 67 Ensemble Streamflow Prediction Traces Issued by the Northwest River Forecast Center, National Weather Service The data presented in this graph are provisional and are intended to provide an estimate of outflow from Libby Dam. How to read this graph: 75th percentile means that on that day, 75 percent of the traces were below this value. The median points indicate the values such that half of the traces were above and half were below The River Forecast Center public site for Libby Dam Forecasts is: 50th to 75th Percentile 25th to 50th Percentile Median Observed Bars Indicate 5th and 95th percentiles exeedances /1 11/1 12/1 1/1 2/1 3/1 4/1 Date 5/1 6/1 7/1 8/1 9/1 10/1
16 Questions?
Elevation (ft) 50th to 75th Percentile 25th to 50th Percentile Median Observed
 50th to 75th Percentile 25th to 50th Percentile Median Observed") 2470 Lake Koocanusa Elevation - Probability Chart Elevation (ft) 2460 2450 2440 2430 2420 2410 2400 2390 2380 2370 2360 2350 2340 2330 2320 2310 2300 The data presented in this graph are provisional and
2470 Lake Koocanusa Elevation - Probability Chart Elevation (ft) 2460 2450 2440 2430 2420 2410 2400 2390 2380 2370 2360 2350 2340 2330 2320 2310 2300 The data presented in this graph are provisional and
The data presented in this graph are provisional and are intended to provide an estimate of Libby Dam forebay elevation (Lake Koocanusa).
.") Elevation (ft) 2470 2460 2450 2440 2430 2420 2410 2400 2390 2380 2370 2360 2350 2340 2330 2320 2310 2300 2290 Lake Koocanusa Elevation - Probability Chart 2280 2270 The data presented in this graph are
Elevation (ft) 2470 2460 2450 2440 2430 2420 2410 2400 2390 2380 2370 2360 2350 2340 2330 2320 2310 2300 2290 Lake Koocanusa Elevation - Probability Chart 2280 2270 The data presented in this graph are
Elevation (ft) 50th to 75th Percentile 25th to 50th Percentile Median Observed /1 11/1 12/1 1/1 2/1 3/1 4/1 5/1 6/1 7/1 8/1 9/1 Date
 50th to 75th Percentile 25th to 50th Percentile Median Observed /1 11/1 12/1 1/1 2/1 3/1 4/1 5/1 6/1 7/1 8/1 9/1 Date") Elevation (ft) 2470 2460 2450 2440 2430 2420 2410 2400 2390 2380 2370 2360 2350 2340 2330 2320 2310 2300 2290 2280 2270 2260 2250 2240 2230 2220 Bars Indicate 5th and 95th percentiles Lake Koocanusa Elevation
Elevation (ft) 2470 2460 2450 2440 2430 2420 2410 2400 2390 2380 2370 2360 2350 2340 2330 2320 2310 2300 2290 2280 2270 2260 2250 2240 2230 2220 Bars Indicate 5th and 95th percentiles Lake Koocanusa Elevation
2017 Fall Conditions Report
 2017 Fall Conditions Report Prepared by: Hydrologic Forecast Centre Date: November 15, 2017 Table of Contents TABLE OF FIGURES... ii EXECUTIVE SUMMARY... 1 BACKGROUND... 4 SUMMER AND FALL PRECIPITATION...
Souris River Basin Spring Runoff Outlook As of March 15, 2018
 Souris River Basin Spring Runoff Outlook As of March 15, 2018 Prepared by: Flow Forecasting & Operations Planning Water Security Agency Basin Conditions Summer rainfall in 2017 in the Saskatchewan portion
Water Supply Conditions and Outlook October 1, 2018
 Water Supply Conditions and Outlook October 1, 2018 Flow Forecasting & Operations Planning Water Security Agency Overview Water supply conditions across Saskatchewan remain near normal, with most reservoirs
Upper Missouri River Basin February 2018 Calendar Year Runoff Forecast February 6, 2018
 Upper Missouri River Basin February 2018 Calendar Year Runoff Forecast February 6, 2018 Calendar Year Runoff Forecast Explanation and Purpose of Forecast U.S. Army Corps of Engineers, Northwestern Division
Sierra Weather and Climate Update
 Sierra Weather and Climate Update 2014-15 Kelly Redmond Western Regional Climate Center Desert Research Institute Reno Nevada Yosemite Hydroclimate Workshop Yosemite Valley, 2015 October 8-9 Percent of
Upper Missouri River Basin January 2018 Calendar Year Runoff Forecast January 3, 2018
 Calendar Year Runoff Forecast Upper Missouri River Basin January 2018 Calendar Year Runoff Forecast January 3, 2018 Explanation and Purpose of Forecast U.S. Army Corps of Engineers, Northwestern Division
2016 Fall Conditions Report
 2016 Fall Conditions Report Prepared by: Hydrologic Forecast Centre Date: December 13, 2016 Table of Contents TABLE OF FIGURES... ii EXECUTIVE SUMMARY... 1 BACKGROUND... 5 SUMMER AND FALL PRECIPITATION...
Modeling of peak inflow dates for a snowmelt dominated basin Evan Heisman. CVEN 6833: Advanced Data Analysis Fall 2012 Prof. Balaji Rajagopalan
 Modeling of peak inflow dates for a snowmelt dominated basin Evan Heisman CVEN 6833: Advanced Data Analysis Fall 2012 Prof. Balaji Rajagopalan The Dworshak reservoir, a project operated by the Army Corps
Upper Missouri River Basin December 2017 Calendar Year Runoff Forecast December 5, 2017
 Upper Missouri River Basin December 2017 Calendar Year Runoff Forecast December 5, 2017 Calendar Year Runoff Forecast Explanation and Purpose of Forecast U.S. Army Corps of Engineers, Northwestern Division
Flood Risk Assessment
 Flood Risk Assessment February 14, 2008 Larry Schick Army Corps of Engineers Seattle District Meteorologist General Assessment As promised, La Nina caused an active winter with above to much above normal
Souris River Basin Spring Runoff Outlook As of March 1, 2019
 Souris River Basin Spring Runoff Outlook As of March 1, 2019 Prepared by: Flow Forecasting & Operations Planning Water Security Agency Basin Conditions Summer rainfall in 2018 over the Saskatchewan portion
NIDIS Intermountain West Regional Drought Early Warning System February 7, 2017
 NIDIS Drought and Water Assessment NIDIS Intermountain West Regional Drought Early Warning System February 7, 2017 Precipitation The images above use daily precipitation statistics from NWS COOP, CoCoRaHS,
Great Lakes Update. Volume 193: 2015 January through June Summary. Vol. 193 Great Lakes Update August 2015
 Great Lakes Update Volume 193: 2015 January through June Summary The U.S. Army Corps of Engineers (USACE) monitors the water levels of each of the Great Lakes. This report provides a summary of the Great
 Water Supply Forecast - THE DALLES http://www.nwrfc.noaa.gov/water_supply/ws_forecasts.php?id=tdao3 Page 1 of 1 3/7/2013 Close Archive Data/Normals Rankings Adjustments Verification Verify All Years Help
Update on Seasonal Conditions & Summer Weather Outlook
 Update on Seasonal Conditions & Summer Weather Outlook Andy Bryant National Weather Service Portland, Oregon June 6, 2018 Overview Quick review of winter and spring conditions Seasonal water supply forecasts
Great Lakes Update. Volume 199: 2017 Annual Summary. Background
 Great Lakes Update Volume 199: 2017 Annual Summary Background The U.S. Army Corps of Engineers (USACE) tracks and forecasts the water levels of each of the Great Lakes. This report is primarily focused
Missouri River Basin Water Management
 Missouri River Basin Water Management US Army Corps of Engineers Missouri River Navigator s Meeting February 12, 2014 Bill Doan, P.E. Missouri River Basin Water Management US Army Corps of Engineers BUILDING
January 25, Summary
 January 25, 2013 Summary Precipitation since the December 17, 2012, Drought Update has been slightly below average in parts of central and northern Illinois and above average in southern Illinois. Soil
Oregon Water Conditions Report May 1, 2017
 Oregon Water Conditions Report May 1, 2017 Mountain snowpack in the higher elevations has continued to increase over the last two weeks. Statewide, most low and mid elevation snow has melted so the basin
Mobile District River System Status for October 25, 2018
 Mobile District River System Status for October 25, 2018 Weather Update The Quantitative Precipitation Forecast (QPF) in Figure 1 shows 0.4 to 2.5 inches of precipitation forecasted for the next 7 days.
Oregon Water Conditions Report April 17, 2017
 Oregon Water Conditions Report April 17, 2017 Mountain snowpack continues to maintain significant levels for mid-april. By late March, statewide snowpack had declined to 118 percent of normal after starting
Drought Monitoring in Mainland Portugal
 Drought Monitoring in Mainland Portugal 1. Accumulated precipitation since 1st October 2014 (Hydrological Year) The accumulated precipitation amount since 1 October 2014 until the end of April 2015 (Figure
November 2018 Weather Summary West Central Research and Outreach Center Morris, MN
 November 2018 Weather Summary Lower than normal temperatures occurred for the second month. The mean temperature for November was 22.7 F, which is 7.2 F below the average of 29.9 F (1886-2017). This November
Great Lakes Update. Volume 188: 2012 Annual Summary
 Great Lakes Update Volume 188: 2012 Annual Summary Background The U.S. Army Corps of Engineers (USACE) tracks the water levels of each of the Great Lakes. This report highlights hydrologic conditions of
Great Lakes Update. Volume 191: 2014 January through June Summary. Vol. 191 Great Lakes Update August 2014
 Great Lakes Update Volume 191: 2014 January through June Summary The U.S. Army Corps of Engineers (USACE) monitors the water levels of each of the Great Lakes. This report provides a summary of the Great
Integrating Weather Forecasts into Folsom Reservoir Operations
 Integrating Weather Forecasts into Folsom Reservoir Operations California Extreme Precipitation Symposium September 6, 2016 Brad Moore, PE US Army Corps of Engineers Biography Brad Moore is a Lead Civil
Preliminary Runoff Outlook February 2018
 Preliminary Runoff Outlook February 2018 Prepared by: Flow Forecasting & Operations Planning Water Security Agency General Overview The Water Security Agency (WSA) is preparing for 2018 spring runoff including
2015 Fall Conditions Report
 2015 Fall Conditions Report Prepared by: Hydrologic Forecast Centre Date: December 21 st, 2015 Table of Contents Table of Figures... ii EXECUTIVE SUMMARY... 1 BACKGROUND... 2 SUMMER AND FALL PRECIPITATION...
Mobile District River System Status for November 17, 2017
 Mobile District River System Status for November 17, 2017 Weather Update The Quantitative Precipitation Forecast (QPF) in Figure 1 shows forecasted precipitation for the next 7 days. Figure 2 shows the
Upper Missouri River Basin May 2018 Calendar Year Runoff Forecast May 4, 2018
 Calendar Year Runoff Forecast Explanation and Purpose of Forecast Upper Missouri River Basin May 2018 Calendar Year Runoff Forecast May 4, 2018 U.S. Army Corps of Engineers, Northwestern Division Missouri
Water Supply Outlook. Interstate Commission on the Potomac River Basin (ICPRB) 30 W. Gude Drive, Suite 450 Rockville, MD Tel: (301)
 30 W. Gude Drive, Suite 450 Rockville, MD Tel: (301)") Water Supply Outlook June 2, 2016 To subscribe: please email aseck@icprb.org Interstate Commission on the Potomac River Basin (ICPRB) 30 W. Gude Drive, Suite 450 Rockville, MD 20850 Tel: (301) 274-8120
Water Supply Outlook June 2, 2016 To subscribe: please email aseck@icprb.org Interstate Commission on the Potomac River Basin (ICPRB) 30 W. Gude Drive, Suite 450 Rockville, MD 20850 Tel: (301) 274-8120
Current Climate Trends and Implications
 Current Climate Trends and Implications Dr. Mark Seeley Professor emeritus Department of Soil, Water, and Climate University of Minnesota St Paul, MN 55108 Crop Insurance Conference September 12, 2018
SEPTEMBER 2013 REVIEW
 Monthly Long Range Weather Commentary Issued: October 21, 2013 Steven A. Root, CCM, President/CEO sroot@weatherbank.com SEPTEMBER 2013 REVIEW Climate Highlights The Month in Review The average temperature
Folsom Dam Water Control Manual Update Joint Federal Project, Folsom Dam
 Folsom Dam Water Control Manual Update Joint Federal Project, Folsom Dam Public Workshop May 25, 2016 Sacramento Library Galleria 828 I Street, Sacramento, CA US Army Corps of Engineers BUILDING STRONG
Monthly Long Range Weather Commentary Issued: APRIL 1, 2015 Steven A. Root, CCM, President/CEO
 Monthly Long Range Weather Commentary Issued: APRIL 1, 2015 Steven A. Root, CCM, President/CEO sroot@weatherbank.com FEBRUARY 2015 Climate Highlights The Month in Review The February contiguous U.S. temperature
Monthly Long Range Weather Commentary Issued: SEPTEMBER 19, 2016 Steven A. Root, CCM, Chief Analytics Officer, Sr. VP,
 Monthly Long Range Weather Commentary Issued: SEPTEMBER 19, 2016 Steven A. Root, CCM, Chief Analytics Officer, Sr. VP, sroot@weatherbank.com SEPTEMBER 2016 Climate Highlights The Month in Review The contiguous
Becky Bolinger Water Availability Task Force November 13, 2018
 Colorado Climate Center WATF Climate Update Becky Bolinger Water Availability Task Force November 13, 2018 COLORADO CLIMATE CENTER Water Year 2018 Colorado s Climate in Review COLORADO CLIMATE CENTER
Water Supply Conditions and Outlook June 4, 2018
 Water Supply Conditions and Outlook June 4, 2018 Flow Forecasting & Operations Planning Water Security Agency Overview Water supply conditions across Saskatchewan are generally good with most reservoir
Illinois Drought Update, December 1, 2005 DROUGHT RESPONSE TASK FORCE Illinois State Water Survey, Department of Natural Resources
 Illinois Drought Update, December 1, 2005 DROUGHT RESPONSE TASK FORCE Illinois State Water Survey, Department of Natural Resources For more drought information please go to http://www.sws.uiuc.edu/. SUMMARY.
A Report on a Statistical Model to Forecast Seasonal Inflows to Cowichan Lake
 A Report on a Statistical Model to Forecast Seasonal Inflows to Cowichan Lake Prepared by: Allan Chapman, MSc, PGeo Hydrologist, Chapman Geoscience Ltd., and Former Head, BC River Forecast Centre Victoria
APR-SEP. Forecast Are in KAF % Average 10 % 30 Year. Forecast Period
 Water Supply Forecast - THE DALLES file://v:\nwrfc_forecast\2013\tdao3\04-05.html Page 1 of 1 4/8/2013 Header for Water Supply Information Page Close Archive Data/Normals Rankings Adjustments Verification
January 2011 Calendar Year Runoff Forecast
 January 2011 Calendar Year Runoff Forecast 2010 Runoff Year Calendar Year 2010 was the third highest year of runoff in the Missouri River Basin above Sioux City with 38.8 MAF, behind 1978 and 1997 which
NIDIS Intermountain West Drought Early Warning System May 23, 2017
 NIDIS Drought and Water Assessment NIDIS Intermountain West Drought Early Warning System May 23, 2017 Precipitation The images above use daily precipitation statistics from NWS COOP, CoCoRaHS, and CoAgMet
Chiang Rai Province CC Threat overview AAS1109 Mekong ARCC
 Chiang Rai Province CC Threat overview AAS1109 Mekong ARCC This threat overview relies on projections of future climate change in the Mekong Basin for the period 2045-2069 compared to a baseline of 1980-2005.
Precipitation. Standardized Precipitation Index. NIDIS Intermountain West Regional Drought Early Warning System January 3, 2017
 1/3/2017 NIDIS Drought and Water Assessment NIDIS Intermountain West Regional Drought Early Warning System January 3, 2017 Precipitation The images above use daily precipitation statistics from NWS COOP,
2015 January Conditions Report
 2015 January Conditions Report Prepared by: Hydrologic Forecast Centre Date: January 28, 2015 1 P a g e Table of Contents List of Figures... 3 SUMMARY... 5 2 P a g e List of Figures Figure 1. Antecedent
2016 Water Management Plan Seasonal Update November 8, Introduction
 Water Management Plan Seasonal Update November 8, 1. Introduction The annual Water Management Plan (WMP) is developed prior to the implementation of Federal Columbia River Power System (FCRPS) operational
NIDIS Drought and Water Assessment
 NIDIS Drought and Water Assessment PRECIPITATION The images above use daily precipitation statistics from NWS COOP, CoCoRaHS, and CoAgMet stations. From top to bottom, and left to right: most recent 7-days
NATIONAL WEATHER SERVICE
 January 2016 February 9, 2016 This was a dry month across the HSA despite one large and several smaller snowfalls. Most locations ended up 1-2 inches below normal for the month. The driest locations at
9. PROBABLE MAXIMUM PRECIPITATION AND PROBABLE MAXIMUM FLOOD
 9. PROBABLE MAXIMUM PRECIPITATION AND PROBABLE MAXIMUM FLOOD 9.1. Introduction Due to the size of Watana Dam and the economic importance of the Project to the Railbelt, the Probable Maximum Flood (PMF)
California 120 Day Precipitation Outlook Issued Tom Dunklee Global Climate Center
 California 120 Day Precipitation Outlook Issued 11-01-2008 Tom Dunklee Global Climate Center This is my second updated outlook for precipitation patterns and amounts for the next 4 s of the current rainy
NIDIS Intermountain West Drought Early Warning System April 16, 2019
 NIDIS Intermountain West Drought Early Warning System April 16, 2019 Precipitation The images above use daily precipitation statistics from NWS COOP, CoCoRaHS, and CoAgMet stations. From top to bottom,
Albeni Falls Operations Meeting 2015
 Albeni Falls Operations Meeting 2015 Katherine Rowden NWS Joel Fenolio Corps of Engineers Agenda Introductions Drought-Weather Conditions Free flow operations Review of Clarified Operations Albeni Falls
Midwest/Great Plains Climate-Drought Outlook August 17, 2017
 Midwest/Great Plains Climate-Drought Outlook August 17, 2017 Brian Fuchs National Drought Mitigation Center University of Nebraska-Lincoln School of Natural Resources General Information Providing climate
Monthly Long Range Weather Commentary Issued: February 15, 2015 Steven A. Root, CCM, President/CEO
 Monthly Long Range Weather Commentary Issued: February 15, 2015 Steven A. Root, CCM, President/CEO sroot@weatherbank.com JANUARY 2015 Climate Highlights The Month in Review During January, the average
PRELIMINARY DRAFT FOR DISCUSSION PURPOSES
 Memorandum To: David Thompson From: John Haapala CC: Dan McDonald Bob Montgomery Date: February 24, 2003 File #: 1003551 Re: Lake Wenatchee Historic Water Levels, Operation Model, and Flood Operation This
Monthly Long Range Weather Commentary Issued: APRIL 18, 2017 Steven A. Root, CCM, Chief Analytics Officer, Sr. VP,
 Monthly Long Range Weather Commentary Issued: APRIL 18, 2017 Steven A. Root, CCM, Chief Analytics Officer, Sr. VP, sroot@weatherbank.com MARCH 2017 Climate Highlights The Month in Review The average contiguous
Missouri River Basin Water Management Monthly Update
 Missouri River Basin Water Management Monthly Update Participating Agencies 255 255 255 237 237 237 0 0 0 217 217 217 163 163 163 200 200 200 131 132 122 239 65 53 80 119 27 National Oceanic and Atmospheric
FORECAST-BASED OPERATIONS AT FOLSOM DAM AND LAKE
 FORECAST-BASED OPERATIONS AT FOLSOM DAM AND LAKE 255 237 237 237 217 217 217 200 200 200 0 163 131 Bridging the Gap163Conference 255 0 132 255 0 163 122 The Dana on Mission Bay San Diego, CA January 28,
APPLICATIONS OF DOWNSCALING: HYDROLOGY AND WATER RESOURCES EXAMPLES
 APPLICATIONS OF DOWNSCALING: HYDROLOGY AND WATER RESOURCES EXAMPLES Dennis P. Lettenmaier Department of Civil and Environmental Engineering For presentation at Workshop on Regional Climate Research NCAR
HyMet Company. Streamflow and Energy Generation Forecasting Model Columbia River Basin
 HyMet Company Streamflow and Energy Generation Forecasting Model Columbia River Basin HyMet Inc. Courthouse Square 19001 Vashon Hwy SW Suite 201 Vashon Island, WA 98070 Phone: 206-463-1610 Columbia River
Weather Update. Flood Seminars Natalie Hasell Meteorological Service of Canada Mid-March 2018
 Weather Update Flood Seminars Natalie Hasell Meteorological Service of Canada Mid-March 2018 Table of contents Current conditions Temperatures Precipitation El Niño Southern Oscillation (ENSO) Forecasts
2012 Water Management Plan Seasonal Update October 31, Introduction
 2012 Water Management Plan Seasonal Update October 31, 2012 1. Introduction The annual Water Management Plan (WMP) is developed prior to the implementation of operational measures identified in the BiOp.
Monthly Long Range Weather Commentary Issued: APRIL 25, 2016 Steven A. Root, CCM, Chief Analytics Officer, Sr. VP, sales
 Monthly Long Range Weather Commentary Issued: APRIL 25, 2016 Steven A. Root, CCM, Chief Analytics Officer, Sr. VP, sales sroot@weatherbank.com MARCH 2016 Climate Highlights The Month in Review The March
Midwest and Great Plains Climate- Drought Outlook 20 October 2016
 Midwest and Great Plains Climate- Drought Outlook 20 October 2016 Laura Edwards Acting State Climatologist SDSU Extension, Aberdeen, SD Laura.edwards@sdstate.edu 605-626-2870 Cottonwood Fire 17 Oct 2016
Midwest and Great Plains Drought and Climate Summary 20 February 2014
 Midwest and Great Plains Drought and Climate Summary 20 February 2014 Wendy Ryan Assistant State Climatologist Colorado Climate Center Colorado State University wendy.ryan@colostate.edu 970-491-8506 General
NIDIS Intermountain West Drought Early Warning System February 6, 2018
 NIDIS Intermountain West Drought Early Warning System February 6, 2018 Precipitation The images above use daily precipitation statistics from NWS COOP, CoCoRaHS, and CoAgMet stations. From top to bottom,
-Assessment of current water conditions. - Precipitation Forecast. - Recommendations for Drought Monitor
 April 27, 2010 -Assessment of current water conditions - Precipitation Forecast - Recommendations for Drought Monitor 7 Day Precipitation 19-25 April 2010 Month-to-Date Precipitation 1-25 April 2010
Great Lakes Update. Volume 194: 2015 Annual Summary
 Great Lakes Update Volume 194: 2015 Annual Summary Background The U.S. Army Corps of Engineers (USACE) tracks and forecasts the water levels of each of the Great Lakes. This report summarizes the hydrologic
Drought Characterization. Examination of Extreme Precipitation Events
 Drought Characterization Examination of Extreme Precipitation Events Extreme Precipitation Events During the Drought For the drought years (1999-2005) daily precipitation data was analyzed to find extreme
March 1, 2003 Western Snowpack Conditions and Water Supply Forecasts
 Natural Resources Conservation Service National Water and Climate Center 101 SW Main Street, Suite 1600 Portland, OR 97204-3224 Date: March 17, 2003 Subject: March 1, 2003 Western Snowpack Conditions and
NIDIS Intermountain West Drought Early Warning System February 12, 2019
 NIDIS Intermountain West Drought Early Warning System February 12, 2019 Precipitation The images above use daily precipitation statistics from NWS COOP, CoCoRaHS, and CoAgMet stations. From top to bottom,
Great Lakes Update. Background
 Great Lakes Update Background The U.S. Army Corps of Engineers, Detroit District, monitors and forecasts the water levels of the Great Lakes. This report summarizes the hydrologic conditions of the Great
DK DM M EMORANDUM D ECEMBER 28, 2018 SUBJECT:
 TO: CC: FROM: SUBJECT: BOARD OF DIRECTORS M EMORANDUM D ECEMBER 28, 2018 ANDY MUELLER, GENERAL MANAGER DAVE DK KANZER, P.E. & DON MEYER, P.E. DK DM COLORADO RIVER BASIN WATER SUPPLY CONDITIONS UPDATE AND
NATIONAL WATER RESOURCES OUTLOOK
 NATIONAL WATER RESOURCES OUTLOOK American Meteorological Society Annual Meeting 24 th Hydrology Conference 9.2 James Noel Service Coordination Hydrologist National Weather Service-Ohio River Forecast Center
Billion Dollar U.S. Flood Disasters in 2016
 Billion Dollar U.S. Flood Disasters in 2016 ArkLaMiss, Mar. 16 Houston, Apr. 16 WV, June 16 LA, Aug. 16 Matthew, Oct. 16 Greg Carbin Chief, Forecast Operations Branch NCEP/Weather Prediction Center College
NIDIS Intermountain West Drought Early Warning System January 22, 2019
 NIDIS Drought and Water Assessment NIDIS Intermountain West Drought Early Warning System January 22, 2019 Precipitation The images above use daily precipitation statistics from NWS COOP, CoCoRaHS, and
Office of the Washington State Climatologist
 Office of the Washington State Climatologist December 3, 2009 November Precipitation Records Western WA was extremely wet this November, and some monthly records were broken. Table 1 shows the precipitation
Colorado weather and climate update: a bit more than halfway through the water year (Or: What s going on with the weather?? )
") Colorado weather and climate update: a bit more than halfway through the water year (Or: What s going on with the weather?? ) Russ S. Schumacher Colorado State Climatologist Director, Colorado Climate
Colorado weather and climate update: a bit more than halfway through the water year (Or: What s going on with the weather?? ) Russ S. Schumacher Colorado State Climatologist Director, Colorado Climate
USA National Weather Service Community Hydrologic Prediction System
 USA National Weather Service Community Hydrologic Prediction System Rob Hartman Hydrologist in Charge NOAA / National Weather Service California-Nevada River Forecast Center Sacramento, CA Background Outline
Robert Shedd Northeast River Forecast Center National Weather Service Taunton, Massachusetts, USA
 Robert Shedd Northeast River Forecast Center National Weather Service Taunton, Massachusetts, USA Outline River Forecast Centers FEWS Implementation Status Forcing Data Ensemble Forecasting The Northeast
MINNESOTA POWER ST LOUIS RIVER PROJECT FERC 2360 ISLAND LAKE RESERVOIR TECHNICAL COMMITTEE MEETING SUMMARY
 5/14/18 Spring Refill Meeting held via email Late spring snowmelt resulted in late start to refill. Spring runoff was not enhanced by rain on snow on frozen ground. Near record dry spring. Refill will
2017 Water Management Plan Seasonal Update March 1, Introduction
 2017 Water Management Plan Seasonal Update March 1, 2017 1. Introduction The annual Water Management Plan (WMP) is developed prior to the implementation of Federal Columbia River Power System (FCRPS) operational
NIDIS Intermountain West Drought Early Warning System April 18, 2017
 1 of 11 4/18/2017 3:42 PM Precipitation NIDIS Intermountain West Drought Early Warning System April 18, 2017 The images above use daily precipitation statistics from NWS COOP, CoCoRaHS, and CoAgMet stations.
Winter Climate Forecast
 Winter 2018-2019 Climate Forecast 26 th Winter Weather Meeting, OMSI and Oregon AMS, Portland Kyle Dittmer Hydrologist-Meteorologist Columbia River Inter-Tribal Fish Commission Portland, Oregon Professor
February 27, Jim Ruff, Manager, Mainstem Passage and River Operations. March 2008 Runoff Forecast and Power Supply Status
 W. Bill Booth Chair Idaho James A. Yost Idaho Tom Karier Washington Richard K. Wallace Washington Bruce A. Measure Vice-Chair Montana Rhonda Whiting Montana Melinda S. Eden Oregon Joan M. Dukes Oregon
National Weather Service. Harold H. Opitz Hydrologist in Charge
 National Weather Service Harold H. Opitz Hydrologist in Charge Goals Organization Role of the River Forecast Center Describe Forecast System & Tools Other Details NWS River Forecast Centers Northwest River
NIDIS Intermountain West Drought Early Warning System May 1, 2018
 NIDIS Intermountain West Drought Early Warning System May 1, 2018 Precipitation The images above use daily precipitation statistics from NWS COOP, CoCoRaHS, and CoAgMet stations. From top to bottom, and
Winter Climate Forecast
 Winter 2017-2018 Climate Forecast 25 th Winter Weather Meeting, OMSI and Oregon AMS, Portland Kyle Dittmer Hydrologist-Meteorologist Columbia River Inter-Tribal Fish Commission Portland, Oregon Professor
The Climate of Haskell County
 The Climate of Haskell County Haskell County is part of the Hardwood Forest. The Hardwood Forest is characterized by its irregular landscape and the largest lake in Oklahoma, Lake Eufaula. Average annual
NIDIS Intermountain West Drought Early Warning System November 21, 2017
 NIDIS Drought and Water Assessment NIDIS Intermountain West Drought Early Warning System November 21, 2017 Precipitation The images above use daily precipitation statistics from NWS COOP, CoCoRaHS, and
September 2018 Weather Summary West Central Research and Outreach Center Morris, MN
 September 2018 Weather Summary The mean temperature for September was 60.6 F, which is 1.5 F above the average of 59.1 F (1886-2017). The high temperature for the month was 94 F on September 16 th. The
Monthly Long Range Weather Commentary Issued: May 15, 2014 Steven A. Root, CCM, President/CEO
 Monthly Long Range Weather Commentary Issued: May 15, 2014 Steven A. Root, CCM, President/CEO sroot@weatherbank.com APRIL 2014 REVIEW Climate Highlights The Month in Review The average temperature for
The Climate of Grady County
 The Climate of Grady County Grady County is part of the Central Great Plains, encompassing some of the best agricultural land in Oklahoma. Average annual precipitation ranges from about 33 inches in northern
Great Lakes Update. Great Lakes Winter and Spring Summary January June Vol. 187 Great Lakes Update August 2012
 Great Lakes Update Great Lakes Winter and Spring Summary January June 2012 The US Army Corps of Engineers (USACE) Detroit District monitors hydraulic and hydrologic conditions of the Great Lakes. This
Monthly Long Range Weather Commentary Issued: NOVEMBER 16, 2015 Steven A. Root, CCM, Chief Analytics Officer, Sr. VP, sales
 Monthly Long Range Weather Commentary Issued: NOVEMBER 16, 2015 Steven A. Root, CCM, Chief Analytics Officer, Sr. VP, sales sroot@weatherbank.com OCTOBER 2015 Climate Highlights The Month in Review The
Midwest/Great Plains Climate-Drought Outlook September 20, 2018
 Midwest/Great Plains Climate-Drought Outlook September 20, 2018 Brian Fuchs National Drought Mitigation Center University of Nebraska-Lincoln School of Natural Resources September 20, 2018 General Information