Colorado s 2003 Moisture Outlook
|
|
|
- Todd Bishop
- 6 years ago
- Views:
Transcription
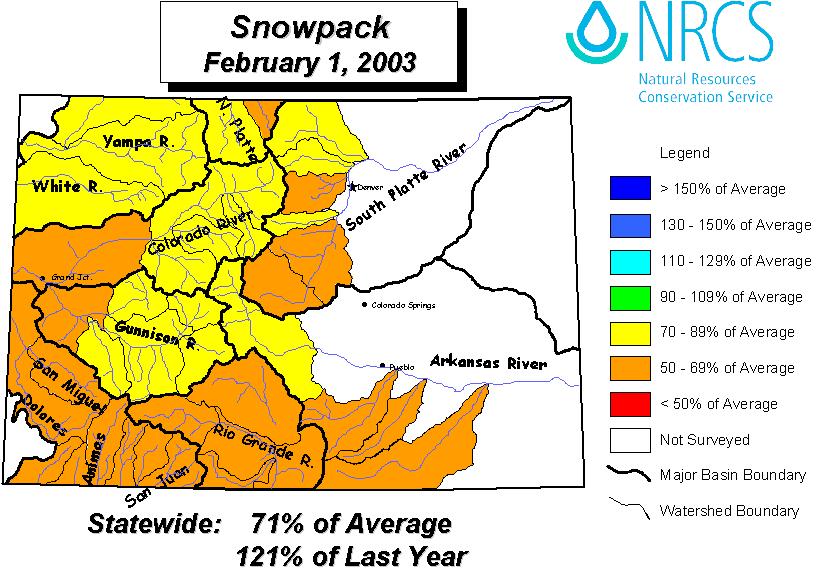
1 Colorado s 2003 Moisture Outlook Nolan Doesken and Roger Pielke, Sr. Colorado Climate Center Prepared by Tara Green and Odie Bliss

2 How we got into this drought!
3 Fort Collins Total Water Year Precipitation (Oct-Sep) Precipitation (inches) Month
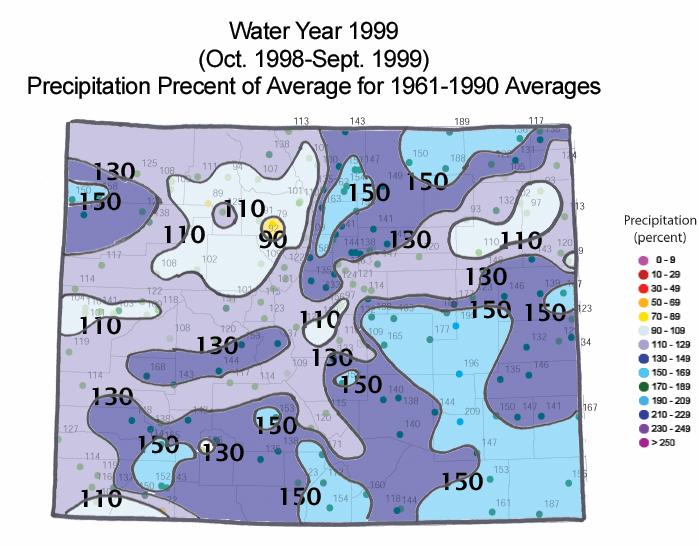
4 Through 1999
5 Through 1999
6
7
8
9
10 Reservoir Storage Statewide Reservoir Levels for Colorado Percent of Average Oct Oct Oct Oct Oct Feb Date Provisional Data Provided by NRCS
11 Colorado Statewide Annual Temperatures through Colorado Average Annual Temperature ( ) Temperature (degrees F) Year From NOAA, National Climatic Data Center
12 Summer Temperatures Fort Collins, Fort Collins Summer Average Temperature (June - August), Summer Total 7 year running mean 74 Temperature (Deg. F) Years

13 Where do we stand now?

14 Oct Jan 2003 Precipitation as percent of average
15 Temperature - Water Year Departure from average, degree F Oct Nov Dec Jan Feb Mar Apr May Jun Jul Aug Sep Eastern Plains Foothills Mountains Western Valleys
16 Water Year 2003 UPPER SAN JUAN SNOTEL
17 Water Year 2003 HOOSIER PASS SNOTEL
18 Water Year 2003 JOE WRIGHT SNOTEL
19
20
21 Grand Lake 1 NW 2003 Water Year (through October '02-January '03) 30 Year Averages Max Year Min Year Period of Record Average Water Year Accumulated 35 Accumulated Precipitation (Inches) OCT NOV DEC JAN FEB MAR APR MAY JUN JUL AUG SEP Months
22 Akron 4E 2003 Water Year (through October '02-January'03) Year Averages Max Year Min Year Period of Record Average Water Year Accumulated Accumulated Precipitation (Inches) OCT NOV DEC JAN FEB MAR APR MAY JUN JUL AUG SEP Months
23

24 What May Be Ahead in 2003
25 Precipitation Monthly Average Precipitation for Selected Sites in the South Platte Basin Hoosier Pass Denver Stapleton Sterling Precipitation (inches) Oct Nov Dec Jan Feb Mar Apr May Jun Jul Aug Sep Month
26 Monthly Average Precipitation for Precipitation (inches) Jan Feb Mar Apr May Jun Jul Aug Sep Oct Nov Dec Month Lamar Cheyenne Wells Walsh Center Fruita

27 A few storms contribute a large fraction of annual precipitation while many small events contribute a small fraction. Precipitation
28 Greeley Daily Accumulated Precipitation 20 Accumulated Daily Precipitation (inches) Jan Feb Mar Apr May Jun Jul Aug Sep Oct Nov Dec Day
29 What Happens Next We have never experienced 2 consecutive extreme statewide drought years. Past multi-year drought, characterized by one extreme year preceded and followed by other dry year. Entire State rarely all recovers quickly and at the same time. Hope for the best, plan for the worst!!


30 Our Path For 2003 Precipitation (inches) Greeley, Colorado Monthly Accumulated Precipitation for Water Year 2003 vs. 30-year Averages ( ). 30-yr Acc WY2003 Acc Oct Nov Dec Jan Feb Mar Apr May Jun Jul Aug Sep Month

31 Positive Indicators Late winter snows Cool spring Multi-day precipitation Low intensity rainfall Light winds High humidity Abundant cloud cover

32 Negative Indicators Little late winter snow Missed opportunities Warm spring Brief, sporadic precipitation High intensity rainfall Frequent, strong winds Low humidity Abundant sunshine
33 Current Indicators El Niño still present Unfavorable Pacific decadal oscillation Missed opportunities February not a good indicator Wet often follows dry Most extreme dry periods last one year (Exceptions: SE CO)
34 Temperature March-May May 2003 From the Colorado Prediction Center
35 Precipitation March-May May 2003 From the Colorado Prediction Center

36 Temperature June-Aug 2003 From the Colorado Prediction Center
37 Precipitation June-Aug 2003 From the Colorado Prediction Center


38 Breaking This Drought A wet spring is essential to begin that process. Will Be Tough


39 COAGMET Weather Data for Agriculture Automated weather stations with daily and hourly readings of: Temperature Humidity Wind Precipitation Solar energy Evapotranspiration

40 Colorado Climate Magazine Good bedtime reading about the climate of Colorado -- recent and historic $15/year subscription pays printing and mailing costs
41

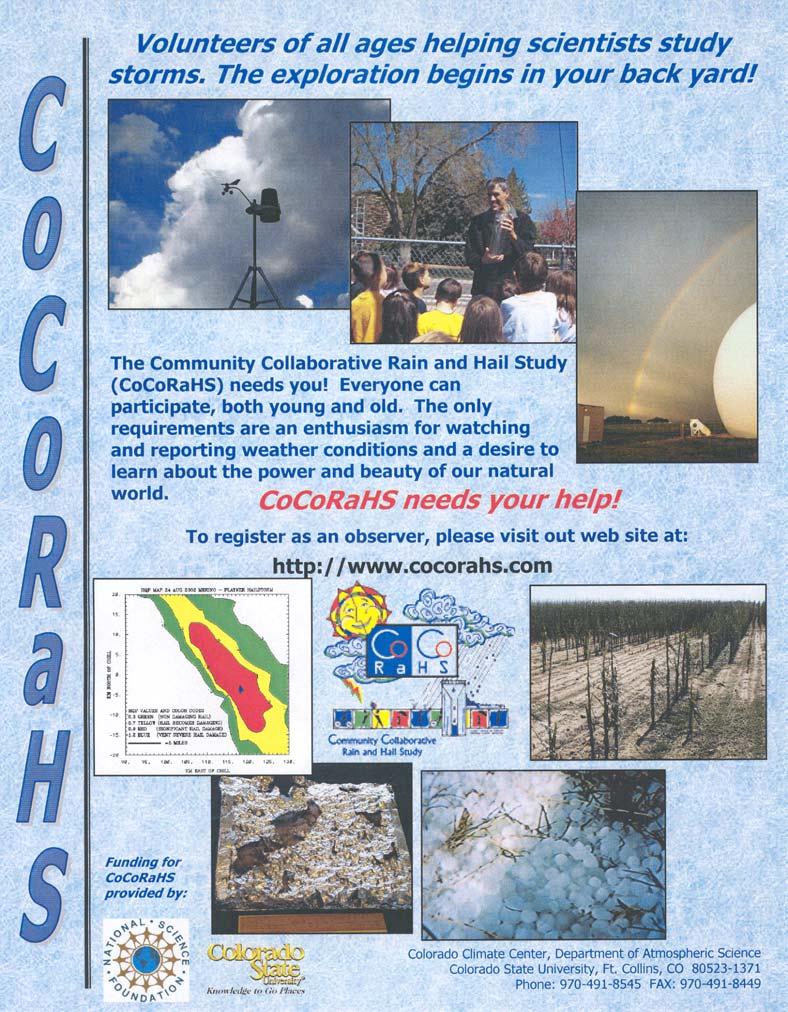
42 CoCo RaHS YOU CAN HELP!
43 Colorado Climate Center Colorado State University Data and Power Point Presentations available for downloading click on Drought then click on Presentations
2003 Moisture Outlook
 2003 Moisture Outlook Nolan Doesken and Roger Pielke, Sr. Colorado Climate Center Prepared by Tara Green and Odie Bliss http://climate.atmos.colostate.edu Through 1999 Through 1999 Fort Collins Total Water
Drought in Southeast Colorado
 Drought in Southeast Colorado Nolan Doesken and Roger Pielke, Sr. Colorado Climate Center Prepared by Tara Green and Odie Bliss http://climate.atmos.colostate.edu 1 Historical Perspective on Drought Tourism
2003 Water Year Wrap-Up and Look Ahead
 2003 Water Year Wrap-Up and Look Ahead Nolan Doesken Colorado Climate Center Prepared by Odie Bliss http://ccc.atmos.colostate.edu Colorado Average Annual Precipitation Map South Platte Average Precipitation
What Does It Take to Get Out of Drought?
 What Does It Take to Get Out of Drought? Nolan J. Doesken Colorado Climate Center Colorado State University http://ccc.atmos.colostate.edu Presented at the Insects, Diseases and Drought Workshop, May 19,
Highlights of the 2006 Water Year in Colorado
 Highlights of the 2006 Water Year in Colorado Nolan Doesken, State Climatologist Atmospheric Science Department Colorado State University http://ccc.atmos.colostate.edu Presented to 61 st Annual Meeting
A Review of the 2007 Water Year in Colorado
 A Review of the 2007 Water Year in Colorado Nolan Doesken Colorado Climate Center, CSU Mike Gillespie Snow Survey Division, USDA, NRCS Presented at the 28 th Annual AGU Hydrology Days, March 26, 2008,
The Colorado Drought of 2002 in Perspective
 The Colorado Drought of 2002 in Perspective Colorado Climate Center Nolan Doesken and Roger Pielke, Sr. Prepared by Tara Green and Odie Bliss http://climate.atmos.colostate.edu Known Characteristics of
CoCoRaHS Monitoring Colorado s s Water Resources through Community Collaborations
 CoCoRaHS Monitoring Colorado s s Water Resources through Community Collaborations Nolan Doesken Colorado Climate Center Atmospheric Science Department Colorado State University Presented at Sustaining
Climate Update. Wendy Ryan and Nolan Doesken Colorado Climate Center. Atmospheric Science Department Colorado State University
 Climate Update Wendy Ryan and Nolan Doesken Colorado Climate Center Atmospheric Science Department Colorado State University Presented to Water Availability Task Force June 26, 2008 Denver, CO Prepared
The Colorado Drought : 2003: A Growing Concern. Roger Pielke, Sr. Colorado Climate Center.
 The Colorado Drought 2001-2003: 2003: A Growing Concern Roger Pielke, Sr. Colorado Climate Center Prepared by Tara Green and Odie Bliss http://climate.atmos.colostate.edu 2 2002 Drought History in Colorado
Long-term Precipitation Trends in Colorado. Nolan Doesken Colorado State Climatologist Presented: Friday, December 12, 2008
 Long-term Precipitation Trends in Colorado Nolan Doesken Colorado State Climatologist Presented: Friday, December 12, 28 Colorado Mean Annual Precipitation (1971-2) Of All Our Climate Observing Stations
Funding provided by NOAA Sectoral Applications Research Project CLIMATE. Basic Climatology Colorado Climate Center
 Funding provided by NOAA Sectoral Applications Research Project CLIMATE Basic Climatology Colorado Climate Center Remember These? Factor 1: Our Energy Source Factor 2: Revolution & Tilt Factor 3: Rotation!
Let s Talk Climate! Nolan Doesken Colorado Climate Center Colorado State University. Yampatika Seminar February 16, 2011 Steamboat Springs, Colorado
 Let s Talk Climate! Nolan Doesken Colorado Climate Center Colorado State University Yampatika Seminar February 16, 2011 Steamboat Springs, Colorado First -- A short background In 1973 the federal government
Tracking the Climate Of Northern Colorado Nolan Doesken State Climatologist Colorado Climate Center Colorado State University
 Tracking the Climate Of Northern Colorado Nolan Doesken State Climatologist Colorado Climate Center Colorado State University Northern Colorado Business Innovations November 20, 2013 Loveland, Colorado
Applications/Users for Improved S2S Forecasts
 Applications/Users for Improved S2S Forecasts Nolan Doesken Colorado Climate Center Colorado State University WSWC Precipitation Forecasting Workshop June 7-9, 2016 San Diego, CA First -- A short background
Webinar and Weekly Summary February 15th, 2011
 Webinar and Weekly Summary February 15th, 2011 -Assessment of current water conditions - Precipitation Forecast - Recommendations for Drought Monitor Upper Colorado Normal Precipitation Upper Colorado
A Review of the 2003 Water Year in Colorado
 Hydrology Days 24 A Review of the 23 Water Year in Colorado Nolan J. Doesken 1 Colorado Climate Center, Atmospheric Science Department, Colorado State University, Fort Collins, Colorado Michael A. Gillespie
A Report on a Statistical Model to Forecast Seasonal Inflows to Cowichan Lake
 A Report on a Statistical Model to Forecast Seasonal Inflows to Cowichan Lake Prepared by: Allan Chapman, MSc, PGeo Hydrologist, Chapman Geoscience Ltd., and Former Head, BC River Forecast Centre Victoria
2002 Drought History in Colorado A Brief Summary
 1 2002 Drought History in Colorado A Brief Summary Colorado Climate Center Roger Pielke, Sr, Director and Nolan Doesken, Research Associate Prepared by Odie Bliss & Tara Green http://climate.atmos.colostate.edu
Colorado weather and climate update: a bit more than halfway through the water year (Or: What s going on with the weather?? )
") Colorado weather and climate update: a bit more than halfway through the water year (Or: What s going on with the weather?? ) Russ S. Schumacher Colorado State Climatologist Director, Colorado Climate
Colorado weather and climate update: a bit more than halfway through the water year (Or: What s going on with the weather?? ) Russ S. Schumacher Colorado State Climatologist Director, Colorado Climate
Variability of Reference Evapotranspiration Across Nebraska
 Know how. Know now. EC733 Variability of Reference Evapotranspiration Across Nebraska Suat Irmak, Extension Soil and Water Resources and Irrigation Specialist Kari E. Skaggs, Research Associate, Biological
Becky Bolinger Water Availability Task Force November 13, 2018
 Colorado Climate Center WATF Climate Update Becky Bolinger Water Availability Task Force November 13, 2018 COLORADO CLIMATE CENTER Water Year 2018 Colorado s Climate in Review COLORADO CLIMATE CENTER
Climate also has a large influence on how local ecosystems have evolved and how we interact with them.
 The Mississippi River in a Changing Climate By Paul Lehman, P.Eng., General Manager Mississippi Valley Conservation (This article originally appeared in the Mississippi Lakes Association s 212 Mississippi
Montana Drought & Climate
 Montana Drought & Climate MARCH 219 MONITORING AND FORECASTING FOR AGRICULTURE PRODUCERS A SERVICE OF THE MONTANA CLIMATE OFFICE IN THIS ISSUE IN BRIEF PAGE 2 REFERENCE In a Word PAGE 3 REVIEW Winter 219:
Oregon Water Conditions Report April 17, 2017
 Oregon Water Conditions Report April 17, 2017 Mountain snowpack continues to maintain significant levels for mid-april. By late March, statewide snowpack had declined to 118 percent of normal after starting
Upper Missouri River Basin February 2018 Calendar Year Runoff Forecast February 6, 2018
 Upper Missouri River Basin February 2018 Calendar Year Runoff Forecast February 6, 2018 Calendar Year Runoff Forecast Explanation and Purpose of Forecast U.S. Army Corps of Engineers, Northwestern Division
Changing Hydrology under a Changing Climate for a Coastal Plain Watershed
 Changing Hydrology under a Changing Climate for a Coastal Plain Watershed David Bosch USDA-ARS, Tifton, GA Jeff Arnold ARS Temple, TX and Peter Allen Baylor University, TX SEWRU Objectives 1. Project changes
NIDIS Intermountain West Drought Early Warning System January 15, 2019
 NIDIS Drought and Water Assessment NIDIS Intermountain West Drought Early Warning System January 15, 2019 Precipitation The images above use daily precipitation statistics from NWS COOP, CoCoRaHS, and
Minnesota s Climatic Conditions, Outlook, and Impacts on Agriculture. Today. 1. The weather and climate of 2017 to date
 Minnesota s Climatic Conditions, Outlook, and Impacts on Agriculture Kenny Blumenfeld, State Climatology Office Crop Insurance Conference, Sep 13, 2017 Today 1. The weather and climate of 2017 to date
Chiang Rai Province CC Threat overview AAS1109 Mekong ARCC
 Chiang Rai Province CC Threat overview AAS1109 Mekong ARCC This threat overview relies on projections of future climate change in the Mekong Basin for the period 2045-2069 compared to a baseline of 1980-2005.
Monthly Long Range Weather Commentary Issued: APRIL 18, 2017 Steven A. Root, CCM, Chief Analytics Officer, Sr. VP,
 Monthly Long Range Weather Commentary Issued: APRIL 18, 2017 Steven A. Root, CCM, Chief Analytics Officer, Sr. VP, sroot@weatherbank.com MARCH 2017 Climate Highlights The Month in Review The average contiguous
NIDIS Intermountain West Drought Early Warning System February 12, 2019
 NIDIS Intermountain West Drought Early Warning System February 12, 2019 Precipitation The images above use daily precipitation statistics from NWS COOP, CoCoRaHS, and CoAgMet stations. From top to bottom,
NIDIS Intermountain West Regional Drought Early Warning System February 7, 2017
 NIDIS Drought and Water Assessment NIDIS Intermountain West Regional Drought Early Warning System February 7, 2017 Precipitation The images above use daily precipitation statistics from NWS COOP, CoCoRaHS,
Missouri River Basin Climate Outlook 1 May Dr. Dennis Todey State Climatologist South Dakota State Univ.
 Missouri River Basin Climate Outlook 1 May 2014 Dr. Dennis Todey State Climatologist South Dakota State Univ. dennis.todey@sdstate.edu 605-688-5141 Photo taken Feb 19, 2013 General Information Providing
Presentation Overview. Southwestern Climate: Past, present and future. Global Energy Balance. What is climate?
 Southwestern Climate: Past, present and future Mike Crimmins Climate Science Extension Specialist Dept. of Soil, Water, & Env. Science & Arizona Cooperative Extension The University of Arizona Presentation
Monthly Long Range Weather Commentary Issued: February 15, 2015 Steven A. Root, CCM, President/CEO
 Monthly Long Range Weather Commentary Issued: February 15, 2015 Steven A. Root, CCM, President/CEO sroot@weatherbank.com JANUARY 2015 Climate Highlights The Month in Review During January, the average
January 25, Summary
 January 25, 2013 Summary Precipitation since the December 17, 2012, Drought Update has been slightly below average in parts of central and northern Illinois and above average in southern Illinois. Soil
Colorado CoCoRaHS. Colorado CoCoRaHS. Because Every Drop Counts! October 2014 Volume 2, Issue 10
 U.S. PRECIPITATION (% OF AVERAGE) LOOKING BACK AT SEPTEMBER 2014 September was dry for much of the nation with a few exceptions; one of those being the central Rockies. In Colorado, it was wetter-than-average
Sierra Weather and Climate Update
 Sierra Weather and Climate Update 2014-15 Kelly Redmond Western Regional Climate Center Desert Research Institute Reno Nevada Yosemite Hydroclimate Workshop Yosemite Valley, 2015 October 8-9 Percent of
Missouri River Basin Water Management Monthly Update
 Missouri River Basin Water Management Monthly Update Participating Agencies 255 255 255 237 237 237 0 0 0 217 217 217 163 163 163 200 200 200 131 132 122 239 65 53 80 119 27 National Oceanic and Atmospheric
NIDIS Intermountain West Drought Early Warning System February 19, 2019
 NIDIS Intermountain West Drought Early Warning System February 19, 2019 Precipitation The images above use daily precipitation statistics from NWS COOP, CoCoRaHS, and CoAgMet stations. From top to bottom,
The Climate of Payne County
 The Climate of Payne County Payne County is part of the Central Great Plains in the west, encompassing some of the best agricultural land in Oklahoma. Payne County is also part of the Crosstimbers in the
The Weather Wire. Current Colorado Snowpack. Contents:
 The Weather Wire December 2018 Volume 25 Number 12 Contents: Current Colorado Snowpack Drought Monitor November Summary/Statistics December Preview Snowfall Totals Current Colorado Snowpack Although snowfall
The Climate of Murray County
 The Climate of Murray County Murray County is part of the Crosstimbers. This region is a transition between prairies and the mountains of southeastern Oklahoma. Average annual precipitation ranges from
NIDIS Intermountain West Drought Early Warning System February 6, 2018
 NIDIS Intermountain West Drought Early Warning System February 6, 2018 Precipitation The images above use daily precipitation statistics from NWS COOP, CoCoRaHS, and CoAgMet stations. From top to bottom,
The Climate of Marshall County
 The Climate of Marshall County Marshall County is part of the Crosstimbers. This region is a transition region from the Central Great Plains to the more irregular terrain of southeastern Oklahoma. Average
Midwest and Great Plains Climate and Drought Update
 Midwest and Great Plains Climate and Drought Update June 20,2013 Laura Edwards Climate Field Specialist Laura.edwards@sdstate.edu 605-626-2870 2012 Board of Regents, South Dakota State University General
Upper Missouri River Basin January 2018 Calendar Year Runoff Forecast January 3, 2018
 Calendar Year Runoff Forecast Upper Missouri River Basin January 2018 Calendar Year Runoff Forecast January 3, 2018 Explanation and Purpose of Forecast U.S. Army Corps of Engineers, Northwestern Division
Upper Missouri River Basin December 2017 Calendar Year Runoff Forecast December 5, 2017
 Upper Missouri River Basin December 2017 Calendar Year Runoff Forecast December 5, 2017 Calendar Year Runoff Forecast Explanation and Purpose of Forecast U.S. Army Corps of Engineers, Northwestern Division
What is happening to the Jamaican climate?
 What is happening to the Jamaican climate? Climate Change and Jamaica: Why worry? Climate Studies Group, Mona (CSGM) Department of Physics University of the West Indies, Mona Part 1 RAIN A FALL, BUT DUTTY
Local Ctimatotogical Data Summary White Hall, Illinois
 SWS Miscellaneous Publication 98-5 STATE OF ILLINOIS DEPARTMENT OF ENERGY AND NATURAL RESOURCES Local Ctimatotogical Data Summary White Hall, Illinois 1901-1990 by Audrey A. Bryan and Wayne Armstrong Illinois
Jackson County 2013 Weather Data
 Jackson County 2013 Weather Data 61 Years of Weather Data Recorded at the UF/IFAS Marianna North Florida Research and Education Center Doug Mayo Jackson County Extension Director 1952-2008 Rainfall Data
Missouri River Basin Water Management Monthly Update
 Missouri River Basin Water Management Monthly Update Participating Agencies 255 255 255 237 237 237 0 0 0 217 217 217 163 163 163 200 200 200 131 132 122 239 65 53 80 119 27 National Oceanic and Atmospheric
A Recap of Colorado s Water Year 2018
 A Recap of Colorado s Water Year 2018 For further inquiries, please contact: Russ Schumacher, State Climatologist (970) 491-8084 Becky Bolinger, Assistant State Climatologist (970) 491-8506 Peter Goble,
Weather and Climate Summary and Forecast Winter
 Weather and Climate Summary and Forecast Winter 2016-17 Gregory V. Jones Southern Oregon University February 7, 2017 What a difference from last year at this time. Temperatures in January and February
The Climate of Texas County
 The Climate of Texas County Texas County is part of the Western High Plains in the north and west and the Southwestern Tablelands in the east. The Western High Plains are characterized by abundant cropland
Detecting Trends in Evapotranspiration in Colorado
 Detecting Trends in Evapotranspiration in Colorado W. Austin Clifford and Nolan J. Doesken Colorado Climate Center Department of Atmospheric Science Colorado State University Presented at Colorado Water
Oregon Water Conditions Report May 1, 2017
 Oregon Water Conditions Report May 1, 2017 Mountain snowpack in the higher elevations has continued to increase over the last two weeks. Statewide, most low and mid elevation snow has melted so the basin
Precipitation. Standardized Precipitation Index. NIDIS Intermountain West Regional Drought Early Warning System January 3, 2017
 1/3/2017 NIDIS Drought and Water Assessment NIDIS Intermountain West Regional Drought Early Warning System January 3, 2017 Precipitation The images above use daily precipitation statistics from NWS COOP,
SEPTEMBER 2013 REVIEW
 Monthly Long Range Weather Commentary Issued: October 21, 2013 Steven A. Root, CCM, President/CEO sroot@weatherbank.com SEPTEMBER 2013 REVIEW Climate Highlights The Month in Review The average temperature
Climate Variability. Eric Salathé. Climate Impacts Group & Department of Atmospheric Sciences University of Washington. Thanks to Nathan Mantua
 Climate Variability Eric Salathé Climate Impacts Group & Department of Atmospheric Sciences University of Washington Thanks to Nathan Mantua Northwest Climate: the mean Factors that influence local/regional
UPPLEMENT A COMPARISON OF THE EARLY TWENTY-FIRST CENTURY DROUGHT IN THE UNITED STATES TO THE 1930S AND 1950S DROUGHT EPISODES
 UPPLEMENT A COMPARISON OF THE EARLY TWENTY-FIRST CENTURY DROUGHT IN THE UNITED STATES TO THE 1930S AND 1950S DROUGHT EPISODES Richard R. Heim Jr. This document is a supplement to A Comparison of the Early
The Climate of Kiowa County
 The Climate of Kiowa County Kiowa County is part of the Central Great Plains, encompassing some of the best agricultural land in Oklahoma. Average annual precipitation ranges from about 24 inches in northwestern
Climatography of the United States No
 Climate Division: CA 4 NWS Call Sign: Month (1) Min (2) Month(1) Extremes Lowest (2) Temperature ( F) Lowest Month(1) Degree s (1) Base Temp 65 Heating Cooling 100 Number of s (3) Jan 55.6 39.3 47.5 77
Climatography of the United States No
 Climate Division: CA 5 NWS Call Sign: Month (1) Min (2) Month(1) Extremes Lowest (2) Temperature ( F) Lowest Month(1) Degree s (1) Base Temp 65 Heating Cooling 100 Number of s (3) Jan 56.6 36.5 46.6 81
Climatography of the United States No
 Climate Division: CA 1 NWS Call Sign: Month (1) Min (2) Month(1) Extremes Lowest (2) Temperature ( F) Lowest Month(1) Degree s (1) Base Temp 65 Heating Cooling 100 Number of s (3) Jan 57.9 38.9 48.4 85
Climatography of the United States No
 Climate Division: CA 5 NWS Call Sign: Month (1) Min (2) Month(1) Extremes Lowest (2) Temperature ( F) Lowest Month(1) Degree s (1) Base Temp 65 Heating Cooling 100 Number of s (3) Jan 44.8 25.4 35.1 72
Climatography of the United States No
 Climate Division: CA 4 NWS Call Sign: Month (1) Min (2) Month(1) Extremes Lowest (2) Temperature ( F) Lowest Month(1) Degree s (1) Base Temp 65 Heating Cooling 100 Number of s (3) Jan 49.4 37.5 43.5 73
The Climate of Bryan County
 The Climate of Bryan County Bryan County is part of the Crosstimbers throughout most of the county. The extreme eastern portions of Bryan County are part of the Cypress Swamp and Forest. Average annual
Climatography of the United States No
 Climate Division: CA 6 NWS Call Sign: Month (1) Min (2) Month(1) Extremes Lowest (2) Temperature ( F) Lowest Month(1) Degree s (1) Base Temp 65 Heating Cooling 100 Number of s (3) Jan 69.4 46.6 58.0 92
Climatography of the United States No
 Climate Division: CA 4 NWS Call Sign: Month (1) Min (2) Month(1) Extremes Lowest (2) Temperature ( F) Lowest Month(1) Degree s (1) Base Temp 65 Heating Cooling 1 Number of s (3) Jan 58.5 38.8 48.7 79 1962
Climatography of the United States No
 Climate Division: CA 6 NWS Call Sign: Month (1) Min (2) Month(1) Extremes Lowest (2) Temperature ( F) Lowest Month(1) Degree s (1) Base Temp 65 Heating Cooling 1 Number of s (3) Jan 67.5 42. 54.8 92 1971
Climatography of the United States No
 Climate Division: CA 1 NWS Call Sign: Month (1) Min (2) Month(1) Extremes Lowest (2) Temperature ( F) Lowest Month(1) Degree s (1) Base Temp 65 Heating Cooling 1 Number of s (3) Jan 57.8 39.5 48.7 85 1962
NATIONAL HYDROPOWER ASSOCIATION MEETING. December 3, 2008 Birmingham Alabama. Roger McNeil Service Hydrologist NWS Birmingham Alabama
 NATIONAL HYDROPOWER ASSOCIATION MEETING December 3, 2008 Birmingham Alabama Roger McNeil Service Hydrologist NWS Birmingham Alabama There are three commonly described types of Drought: Meteorological drought
NIDIS Intermountain West Drought Early Warning System December 11, 2018
 NIDIS Drought and Water Assessment NIDIS Intermountain West Drought Early Warning System December 11, 2018 Precipitation The images above use daily precipitation statistics from NWS COOP, CoCoRaHS, and
The Climate of Seminole County
 The Climate of Seminole County Seminole County is part of the Crosstimbers. This region is a transition region from the Central Great Plains to the more irregular terrain of southeastern Oklahoma. Average
Climatography of the United States No
 Climate Division: ND 8 NWS Call Sign: BIS Month (1) Min (2) Month(1) Extremes Lowest (2) Temperature ( F) Lowest Month(1) Degree s (1) Base Temp 65 Heating Cooling 100 Number of s (3) Jan 21.1 -.6 10.2
Climatography of the United States No
 Climate Division: TN 1 NWS Call Sign: Month (1) Min (2) Month(1) Extremes Lowest (2) Temperature ( F) Lowest Month(1) Degree s (1) Base Temp 65 Heating Cooling 100 Number of s (3) Jan 47.6 24.9 36.3 81
Climatography of the United States No
 Climate Division: AK 5 NWS Call Sign: ANC Month (1) Min (2) Month(1) Extremes Lowest (2) Temperature ( F) Lowest Month(1) Degree s (1) Base Temp 65 Heating Cooling 90 Number of s (3) Jan 22.2 9.3 15.8
Climatography of the United States No
 Climate Division: CA 5 NWS Call Sign: FAT Month (1) Min (2) Month(1) Extremes Lowest (2) Temperature ( F) Lowest Month(1) Degree s (1) Base Temp 65 Heating Cooling 1 Number of s (3) Jan 53.6 38.4 46. 78
Climatography of the United States No
 Climate Division: CA 6 NWS Call Sign: 1L2 N Lon: 118 3W Month (1) Min (2) Month(1) Extremes Lowest (2) Temperature ( F) Lowest Month(1) Degree s (1) Base Temp 65 Heating Cooling 1 Number of s (3) Jan 63.7
Climatography of the United States No
 Climate Division: CA 5 NWS Call Sign: BFL Month (1) Min (2) Month(1) Extremes Lowest (2) Temperature ( F) Lowest Month(1) Degree s (1) Base Temp 65 Heating Cooling 1 Number of s (3) Jan 56.3 39.3 47.8
The Weather Wire. Current Colorado Snowpack. Contents:
 The Weather Wire January 2019 Volume 26 Number 1 Contents: Current Colorado Snowpack Denver Snowfall Since 1999-2000 Denver 2018 Climate Review Drought Monitor December Summary/Statistics January Preview
The Climate of Pontotoc County
 The Climate of Pontotoc County Pontotoc County is part of the Crosstimbers. This region is a transition region from the Central Great Plains to the more irregular terrain of southeast Oklahoma. Average
NIDIS Intermountain West Drought Early Warning System April 18, 2017
 1 of 11 4/18/2017 3:42 PM Precipitation NIDIS Intermountain West Drought Early Warning System April 18, 2017 The images above use daily precipitation statistics from NWS COOP, CoCoRaHS, and CoAgMet stations.
The Weather Wire. Contents: Summer 2018 Outlook. Summer 2018 Outlook Drought Monitor May Summary/Statistics June Preview Rainfall Totals
 The Weather Wire June 2018 Volume 25 Number 6 Contents: Summer 2018 Outlook Drought Monitor May Summary/Statistics June Preview Rainfall Totals Summer 2018 Outlook June 1 st marked the first day of meteorological
Climatography of the United States No
 Climate Division: TN 3 NWS Call Sign: BNA Month (1) Min (2) Month(1) Extremes Lowest (2) Temperature ( F) Lowest Month(1) Degree s (1) Base Temp 65 Heating Cooling 100 Number of s (3) Jan 45.6 27.9 36.8
The Climate of Grady County
 The Climate of Grady County Grady County is part of the Central Great Plains, encompassing some of the best agricultural land in Oklahoma. Average annual precipitation ranges from about 33 inches in northern
Champaign-Urbana 2001 Annual Weather Summary
 Champaign-Urbana 2001 Annual Weather Summary ILLINOIS STATE WATER SURVEY 2204 Griffith Dr. Champaign, IL 61820 wxobsrvr@sws.uiuc.edu Maria Peters, Weather Observer January: After a cold and snowy December,
Climatography of the United States No
 Climate Division: CA 5 NWS Call Sign: Elevation: 6 Feet Lat: 37 Month (1) Min (2) Month(1) Extremes Lowest (2) Temperature ( F) Lowest Month(1) Degree s (1) Base Temp 65 Heating Cooling 1 Number of s (3)
Climatography of the United States No
 Climate Division: CA 4 NWS Call Sign: Elevation: 2 Feet Lat: 37 Month (1) Min (2) Month(1) Extremes Lowest (2) Temperature ( F) Lowest Month(1) Degree s (1) Base Temp 65 Heating Cooling 1 Number of s (3)
Climatography of the United States No
 Climate Division: CA 4 NWS Call Sign: Elevation: 13 Feet Lat: 36 Month (1) Min (2) Month(1) Extremes Lowest (2) Temperature ( F) Lowest Month(1) Degree s (1) Base Temp 65 Heating Cooling 1 Number of s
Climatography of the United States No
 Climate Division: CA 5 NWS Call Sign: Elevation: 1,14 Feet Lat: 36 Month (1) Min (2) Month(1) Extremes Lowest (2) Temperature ( F) Lowest Month(1) Degree s (1) Base Temp 65 Heating Cooling 1 Number of
Missouri River Basin Water Management
 Missouri River Basin Water Management US Army Corps of Engineers Missouri River Navigator s Meeting February 12, 2014 Bill Doan, P.E. Missouri River Basin Water Management US Army Corps of Engineers BUILDING
2015 Fall Conditions Report
 2015 Fall Conditions Report Prepared by: Hydrologic Forecast Centre Date: December 21 st, 2015 Table of Contents Table of Figures... ii EXECUTIVE SUMMARY... 1 BACKGROUND... 2 SUMMER AND FALL PRECIPITATION...
WHEN IS IT EVER GOING TO RAIN? Table of Average Annual Rainfall and Rainfall For Selected Arizona Cities
 WHEN IS IT EVER GOING TO RAIN? Table of Average Annual Rainfall and 2001-2002 Rainfall For Selected Arizona Cities Phoenix Tucson Flagstaff Avg. 2001-2002 Avg. 2001-2002 Avg. 2001-2002 October 0.7 0.0
Climatography of the United States No
 Month (1) Min (2) Month(1) Extremes Lowest (2) Temperature ( F) Lowest Month(1) Degree s (1) Base Temp 65 Heating Cooling 100 Number of s (3) Jan 63.9 39.3 51.6 86 1976 16 56.6 1986 20 1976 2 47.5 1973
Climatography of the United States No
 Temperature ( F) Month (1) Min (2) Month(1) Extremes Lowest (2) Lowest Month(1) Degree s (1) Base Temp 65 Heating Cooling 100 Number of s (3) Jan 32.8 21.7 27.3 62 1918 1 35.8 1983-24 1950 29 10.5 1979
NIDIS Intermountain West Drought Early Warning System December 18, 2018
 NIDIS Intermountain West Drought Early Warning System December 18, 2018 Precipitation The images above use daily precipitation statistics from NWS COOP, CoCoRaHS, and CoAgMet stations. From top to bottom,
Climatography of the United States No
 Climate Division: CA 6 NWS Call Sign: LAX Elevation: 1 Feet Lat: 33 Month (1) Min (2) Month(1) Extremes Lowest (2) Temperature ( F) Lowest Month(1) Degree s (1) Base Temp 65 Heating Cooling 1 Number of