Zachary Holden - US Forest Service Region 1, Missoula MT Alan Swanson University of Montana Dept. of Geography David Affleck University of Montana
|
|
|
- Roger Lucas
- 5 years ago
- Views:
Transcription
1 Progress modeling topographic variation in temperature and moisture for inland Northwest forest management Zachary Holden - US Forest Service Region 1, Missoula MT Alan Swanson University of Montana Dept. of Geography David Affleck University of Montana (Forestry) Solomon Dobrowski University of Montana (Forestry) Marco Maneta University of Montana (Geosciences)


2 Vegetation management in Complex Terrain Fine-scale gradients drive large variation in vegetation and fuel dynamics We lack fundamental tools and data needed to make informed decisions about: What to plant where How fast it will grow How it will burn

3 What spatial resolution is needed to capture climatic/biophysical variation in complex terrain? 1 meter resolution gridded indices Sample of 10,000 pixels Semivariogram analysis
4 Penman-Montieth equation for evapotranspiration Integrates climate and energy into mechanistic variables Temperature Radiation Atmospheric Vapor Pressure (RH) Aerodynamic resistance (Wind) Each variable in the Penman-Monteith model varies with terrain position

5 Scaling Climate in Mountainous Terrain Mountains create steep biophysical gradients Every energy input to available moisture varies at fine scale in complex terrain Radiation Minimum temperature Max. temperature atmospheric humidity Wind speed Holden and Jolly (2011)

6 Scaling Climate in Mountainous Terrain Mountains create steep biophysical gradients Every energy input to available moisture varies at fine scale in complex terrain Radiation Min. temperature Max. temperature atmospheric humidity Wind speed Holden and Jolly (2011)


7 Scaling Climate in Mountainous Terrain Snow melt timing Earliest melt on southwest facing slopes 1 month delay high elevation north slopes Holden and Jolly 2011
8 Scaling Climate in Mountainous Terrain Mountains create steep biophysical gradients Every energy input to available moisture varies at fine scale in complex terrain Radiation Min. temperature Max. temperature atmospheric humidity Wind speed Holden and Jolly (2011)

9 Scaling Climate in Mountainous Terrain Mountains create steep biophysical gradients Every energy input to available moisture varies at fine scale in complex terrain Radiation Minimum temperature Max. temperature atmospheric humidity Wind speed Holden and Jolly (2011)
10


11 Topographic variation in windspeed Slower wind speeds in valley bottoms Higher wind speeds on ridge tops Large effect on ET WindNinja Simulation for August 13, 2013

12 Soil water holding capacity Soil depth and physical properties make up the bucket that stores water making it available for plants STATSGO raw SSURGO STATSGO data has complete US coverage But it s thought to poorly characterize soil variability SSURGO higher quality but large areas Of missing data in western US

13 Deeper soils in valley bottoms Deeper soils on Northfacing slopes


 300")
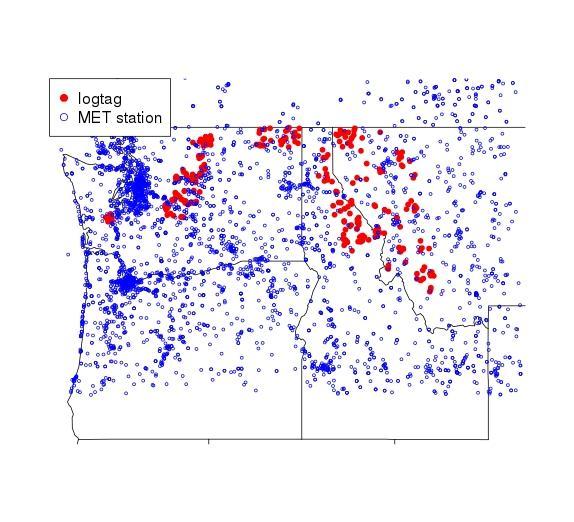
14 Massive microclimate sampling with low-cost sensor networks 2000 sites in N. Rockies and Canada ( ) 300 sites in WA/OR/CA in

15
 global")
 0.")
16 Temperature/humidity models for CONUS NOAA Climate Forecast System Reanalysis (CFS) global hourly data from 1979-present + forecasts 42 Pressure levels (geopotential heights) 0.5 degree resolution 16


17 Daily cloud/shade corrected radiation (1979-present) Covariate in maximum temperature model

18 Soil moisture as covariate for Tmax model - Fast All Season Soil Strength model (FASST) - Model run at ~ 15,000 points - interpolated to 250 m grid - Daily 0-10 cm soil moisture grids created for
")
19 Gridded daily FASST soil moisture Daily FASST runs generated each day at 240m Soil moisture (0-10 cm)

20 Maximum daily temperature Empirical model with physical basis: Tmax = reanalysis lapse + radiation * FASST soil moisture + MODIS VCF Tmax: captures differences in north and South slope temperatures Tmax: captures interaction between Surface moisture and insolation

21 Cold air drainage potential (CAD-P) Difference between free air temperature and observed surface temperature Modeled as a function of topography Holden et al
 and sensor observations Modeled as a function of terrain covariates")
22 Cold Air Drainage potential model Difference between free air temperature (NARR) and sensor observations Modeled as a function of terrain covariates 22

23 Development of high resolution daily gridded air temperature data with distributed sensor networks For the US Northern Rockies 240 meter daily air temperature grids daily Tmin and Tmax Holden et al. (2015) 23

24 Minimum temperature High resolution daily air temperature models for the US Northern Rockies Tmin = reanalysis lapse + CAD * pressure + humidity + MODIS VCF 24

25 TOPOFIRE technical progress: weather obs. database TOPOFIRE weather obs database 25
26
 Daily Penman-Monteith")

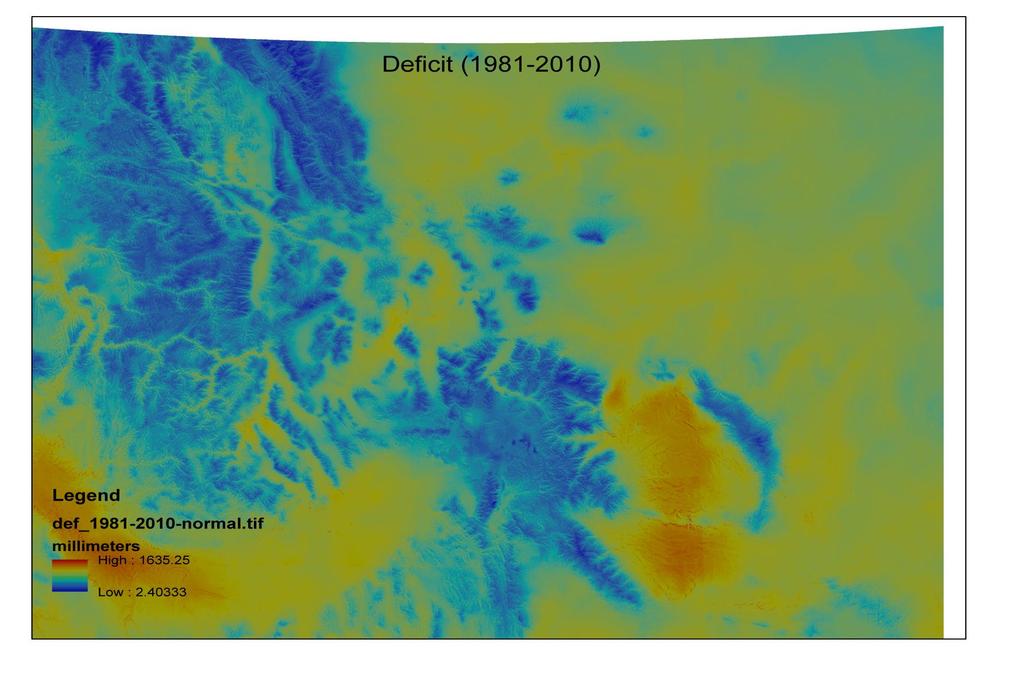
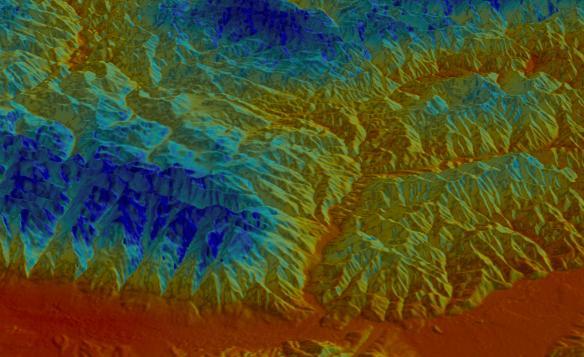
27 Daily evapotranspiration and soil moisture (1979-present) Daily Penman-Monteith evapotranspiration -250 m resolution, including solar radiation -Strong aspect differences/drier south facing slopes 27


28 Daily snow accumulation and melt model (1979-present) 28
")
29 Daily Minimum/Maximum air temperature (2000-present) 29

30 Daily average dewpoint temperature (2000-present) 30

31 Spatially complete maps of soil properties (gssurgo) Imputation of missing SSURGO data using terrain and satellite data Deeper soils in areas of local accumulation Deeper soils on Shaded slopes shallow soils on steep slopes 31
32

33 Modeling biophysical controls on plant stress and productivity with water and energy balance models ECH2O ecohydrology model Spatially distributed model Surface/subsurface flow Excellent snow model


34 Priest River Experimental Forest, Idaho Sites on North and South facing slopes Full weather station at each site Small, medium and mature stand ~ 700 leaf water potential measurements ( )
35 Empirical modeling of Leaf Water Potential (Psi) LWP depends on supply (soil moisture) and demand (vapor pressure deficit) Under high demand (high temperature, low RH) trees close stomates/minimize water loss Low soil moistures increase resistance; more difficult to move water from soil to atmosphere Species-specific responses
36 Generalized linear model LWP = f(vwc + SOLAR + VPD + species*vwc + species*vpd) Empirical modeling of LWP VWC = volumetric water content VPD = vapor pressure deficit
 Solar insolation Wind speed (windninja) Soil properties (gssurgo) Tmax (corrected for insolation effects)")
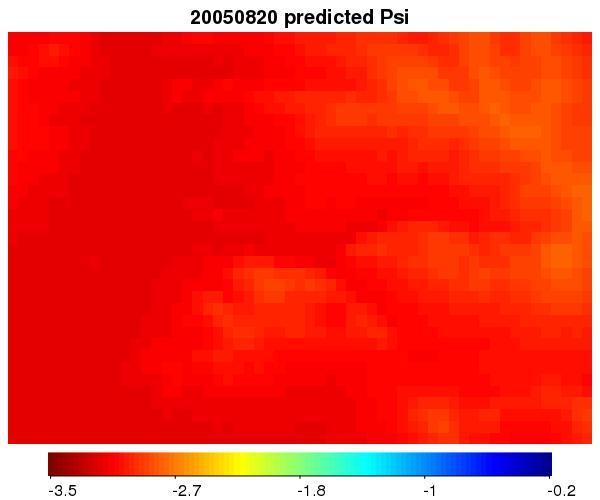
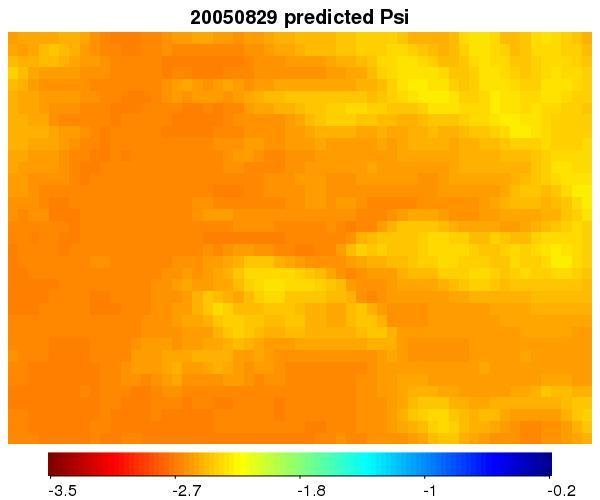
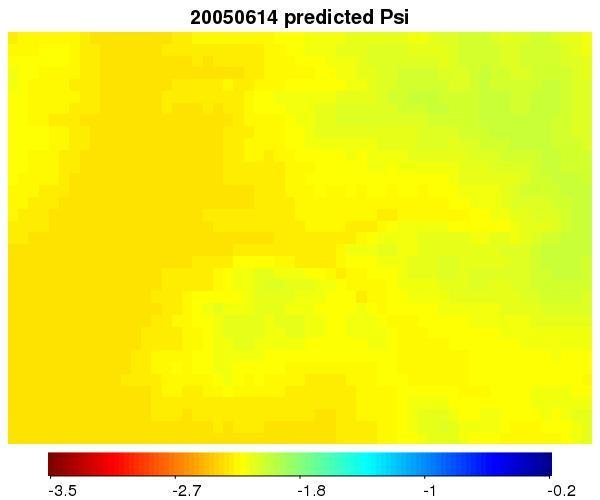
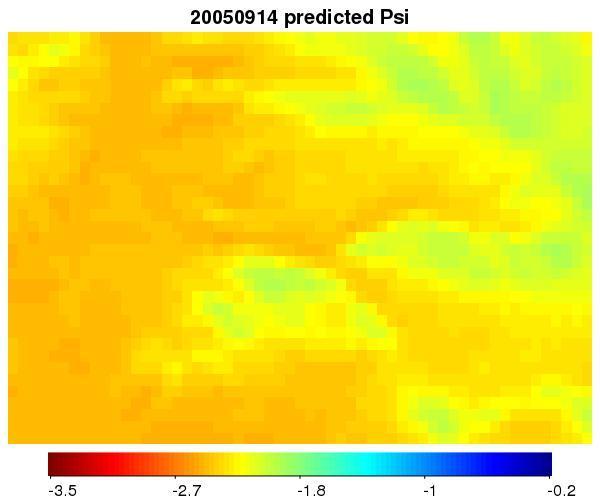
37 Spatial modeling LWP with ech2o All terrain-varying physical processes Are accounted for using TOPOFIRE data Tmin (cold air drainage) Solar insolation Wind speed (windninja) Soil properties (gssurgo) Tmax (corrected for insolation effects)

38 Soil moisture modeling with ech2o
39

40 ECH2O coupled with 3P-G Models carbon assimilation in roots and above ground Tracks stand age and LAI Potentially powerful tool for understanding site productivity Climatic influences on tree growth, stress, mortality
41 summary Rapid progress developing topographically resolved temperature/humdity gridded data Preliminary PNW datasets should be completed by August 2016 Coupling these datasets with hydrologic models could be useful for characterizing physical controls on tree occurrence/growth

42 TOPOFIRE: a system for mapping terrain influences on climate for improved wildfire decision support Topofire.dbs.umt.edu
43 questions
4.5 Comparison of weather data from the Remote Automated Weather Station network and the North American Regional Reanalysis
 4.5 Comparison of weather data from the Remote Automated Weather Station network and the North American Regional Reanalysis Beth L. Hall and Timothy. J. Brown DRI, Reno, NV ABSTRACT. The North American
METRIC tm. Mapping Evapotranspiration at high Resolution with Internalized Calibration. Shifa Dinesh
 METRIC tm Mapping Evapotranspiration at high Resolution with Internalized Calibration Shifa Dinesh Outline Introduction Background of METRIC tm Surface Energy Balance Image Processing Estimation of Energy
EVAPORATION GEOG 405. Tom Giambelluca
 EVAPORATION GEOG 405 Tom Giambelluca 1 Evaporation The change of phase of water from liquid to gas; the net vertical transport of water vapor from the surface to the atmosphere. 2 Definitions Evaporation:
Climate Variables for Energy: WP2
 Climate Variables for Energy: WP2 Phil Jones CRU, UEA, Norwich, UK Within ECEM, WP2 provides climate data for numerous variables to feed into WP3, where ESCIIs will be used to produce energy-relevant series
US National Fire Danger Rating System: Past, Present and Future
 US National Fire Danger System: Past, Present and Future Dr. W. Matt Jolly US Forest Service, Fire Sciences Laboratory Missoula, MT 17/09/2008 NWCG IRMWT 1 Outline Introduction to the US National Fire
Effects of forest cover and environmental variables on snow accumulation and melt
 Effects of forest cover and environmental variables on snow accumulation and melt Mariana Dobre, William J. Elliot, Joan Q. Wu, Timothy E. Link, Ina S. Miller Abstract The goal of this study was to assess
NIDIS Intermountain West Drought Early Warning System February 12, 2019
 NIDIS Intermountain West Drought Early Warning System February 12, 2019 Precipitation The images above use daily precipitation statistics from NWS COOP, CoCoRaHS, and CoAgMet stations. From top to bottom,
NIDIS Intermountain West Drought Early Warning System February 6, 2018
 NIDIS Intermountain West Drought Early Warning System February 6, 2018 Precipitation The images above use daily precipitation statistics from NWS COOP, CoCoRaHS, and CoAgMet stations. From top to bottom,
NIDIS Intermountain West Drought Early Warning System May 23, 2017
 NIDIS Drought and Water Assessment NIDIS Intermountain West Drought Early Warning System May 23, 2017 Precipitation The images above use daily precipitation statistics from NWS COOP, CoCoRaHS, and CoAgMet
Development of High Resolution Gridded Dew Point Data from Regional Networks
 Development of High Resolution Gridded Dew Point Data from Regional Networks North Central Climate Science Center Open Science Conference May 20, 2015 Ruben Behnke Numerical Terradynamic Simulation Group
Assimilation of satellite derived soil moisture for weather forecasting
 Assimilation of satellite derived soil moisture for weather forecasting www.cawcr.gov.au Imtiaz Dharssi and Peter Steinle February 2011 SMOS/SMAP workshop, Monash University Summary In preparation of the
RAL Advances in Land Surface Modeling Part I. Andrea Hahmann
 RAL Advances in Land Surface Modeling Part I Andrea Hahmann Outline The ATEC real-time high-resolution land data assimilation (HRLDAS) system - Fei Chen, Kevin Manning, and Yubao Liu (RAL) The fine-mesh
NIDIS Intermountain West Drought Early Warning System November 14, 2017
 NIDIS Intermountain West Drought Early Warning System November 14, 2017 Precipitation The images above use daily precipitation statistics from NWS COOP, CoCoRaHS, and CoAgMet stations. From top to bottom,
NIDIS Intermountain West Drought Early Warning System November 21, 2017
 NIDIS Drought and Water Assessment NIDIS Intermountain West Drought Early Warning System November 21, 2017 Precipitation The images above use daily precipitation statistics from NWS COOP, CoCoRaHS, and
MT-CLIM for Excel. William M. Jolly Numerical Terradynamic Simulation Group College of Forestry and Conservation University of Montana c 2003
 MT-CLIM for Excel William M. Jolly Numerical Terradynamic Simulation Group College of Forestry and Conservation University of Montana c 2003 1 Contents 1 INTRODUCTION 3 2 MTCLIM for Excel (MTCLIM-XL) 3
Vermont Soil Climate Analysis Network (SCAN) sites at Lye Brook and Mount Mansfield
 sites at Lye Brook and Mount Mansfield") Vermont Soil Climate Analysis Network (SCAN) sites at Lye Brook and Mount Mansfield 13 Years of Soil Temperature and Soil Moisture Data Collection September 2000 September 2013 Soil Climate Analysis Network
Vermont Soil Climate Analysis Network (SCAN) sites at Lye Brook and Mount Mansfield 13 Years of Soil Temperature and Soil Moisture Data Collection September 2000 September 2013 Soil Climate Analysis Network
NIDIS Intermountain West Drought Early Warning System September 4, 2018
 NIDIS Drought and Water Assessment NIDIS Intermountain West Drought Early Warning System September 4, 2018 Precipitation The images above use daily precipitation statistics from NWS COOP, CoCoRaHS, and
NIDIS Intermountain West Drought Early Warning System December 11, 2018
 NIDIS Drought and Water Assessment NIDIS Intermountain West Drought Early Warning System December 11, 2018 Precipitation The images above use daily precipitation statistics from NWS COOP, CoCoRaHS, and
NIDIS Intermountain West Drought Early Warning System April 16, 2019
 NIDIS Intermountain West Drought Early Warning System April 16, 2019 Precipitation The images above use daily precipitation statistics from NWS COOP, CoCoRaHS, and CoAgMet stations. From top to bottom,
8-km Historical Datasets for FPA
 Program for Climate, Ecosystem and Fire Applications 8-km Historical Datasets for FPA Project Report John T. Abatzoglou Timothy J. Brown Division of Atmospheric Sciences. CEFA Report 09-04 June 2009 8-km
NIDIS Intermountain West Regional Drought Early Warning System February 7, 2017
 NIDIS Drought and Water Assessment NIDIS Intermountain West Regional Drought Early Warning System February 7, 2017 Precipitation The images above use daily precipitation statistics from NWS COOP, CoCoRaHS,
Water information system advances American River basin. Roger Bales, Martha Conklin, Steve Glaser, Bob Rice & collaborators UC: SNRI & CITRIS
 Water information system advances American River basin Roger Bales, Martha Conklin, Steve Glaser, Bob Rice & collaborators UC: SNRI & CITRIS Opportunities Unprecedented level of information from low-cost
CIMIS. California Irrigation Management Information System
 CIMIS California Irrigation Management Information System What is CIMIS? A network of over 130 fully automated weather stations that collect weather data throughout California and provide estimates of
Precipitation. Standardized Precipitation Index. NIDIS Intermountain West Regional Drought Early Warning System January 3, 2017
 1/3/2017 NIDIS Drought and Water Assessment NIDIS Intermountain West Regional Drought Early Warning System January 3, 2017 Precipitation The images above use daily precipitation statistics from NWS COOP,
Manoa Watershed Water Balance Study: Potential ET
 Manoa Watershed Water Balance Study: Potential ET Wyatt Blair, Josh Donovan, Max Irion, Jordan Muratsuchi, and David Heir Geography 405 Fall 2016 Overview Introduction Objectives Methodology Results Summary/Conclusion
NIDIS Intermountain West Drought Early Warning System April 18, 2017
 1 of 11 4/18/2017 3:42 PM Precipitation NIDIS Intermountain West Drought Early Warning System April 18, 2017 The images above use daily precipitation statistics from NWS COOP, CoCoRaHS, and CoAgMet stations.
NIDIS Intermountain West Drought Early Warning System July 18, 2017
 NIDIS Drought and Water Assessment NIDIS Intermountain West Drought Early Warning System July 18, 2017 Precipitation The images above use daily precipitation statistics from NWS COOP, CoCoRaHS, and CoAgMet
Research Note COMPUTER PROGRAM FOR ESTIMATING CROP EVAPOTRANSPIRATION IN PUERTO RICO 1,2. J. Agric. Univ. P.R. 89(1-2): (2005)
: (2005)") Research Note COMPUTER PROGRAM FOR ESTIMATING CROP EVAPOTRANSPIRATION IN PUERTO RICO 1,2 Eric W. Harmsen 3 and Antonio L. González-Pérez 4 J. Agric. Univ. P.R. 89(1-2):107-113 (2005) Estimates of crop
Research Note COMPUTER PROGRAM FOR ESTIMATING CROP EVAPOTRANSPIRATION IN PUERTO RICO 1,2 Eric W. Harmsen 3 and Antonio L. González-Pérez 4 J. Agric. Univ. P.R. 89(1-2):107-113 (2005) Estimates of crop
NIDIS Intermountain West Drought Early Warning System January 15, 2019
 NIDIS Drought and Water Assessment NIDIS Intermountain West Drought Early Warning System January 15, 2019 Precipitation The images above use daily precipitation statistics from NWS COOP, CoCoRaHS, and
NIDIS Intermountain West Drought Early Warning System December 4, 2018
 12/4/2018 NIDIS Drought and Water Assessment NIDIS Intermountain West Drought Early Warning System December 4, 2018 Precipitation The images above use daily precipitation statistics from NWS COOP, CoCoRaHS,
Atmospheric Moisture, Precipitation, and Weather Systems
 Atmospheric Moisture, Precipitation, and Weather Systems 6 Chapter Overview The atmosphere is a complex system, sometimes described as chaotic in nature. In this chapter we examine one of the principal
5B.1 DEVELOPING A REFERENCE CROP EVAPOTRANSPIRATION CLIMATOLOGY FOR THE SOUTHEASTERN UNITED STATES USING THE FAO PENMAN-MONTEITH ESTIMATION TECHNIQUE
 DEVELOPING A REFERENCE CROP EVAPOTRANSPIRATION CLIMATOLOGY FOR THE SOUTHEASTERN UNITED STATES USING THE FAO PENMAN-MONTEITH ESTIMATION TECHNIQUE Heather A. Dinon*, Ryan P. Boyles, and Gail G. Wilkerson
NIDIS Intermountain West Drought Early Warning System December 18, 2018
 NIDIS Intermountain West Drought Early Warning System December 18, 2018 Precipitation The images above use daily precipitation statistics from NWS COOP, CoCoRaHS, and CoAgMet stations. From top to bottom,
The Colorado Agricultural no Meteorological Network (CoAgMet) and Crop ET Reports
 and Crop ET Reports") C R O P S E R I E S Irrigation Quick Facts The Colorado Agricultural no. 4.723 Meteorological Network (CoAgMet) and Crop ET Reports A.A. Andales, T. A. Bauder and N. J. Doesken 1 (10/09) CoAgMet is a network
C R O P S E R I E S Irrigation Quick Facts The Colorado Agricultural no. 4.723 Meteorological Network (CoAgMet) and Crop ET Reports A.A. Andales, T. A. Bauder and N. J. Doesken 1 (10/09) CoAgMet is a network
Lake parameters climatology for cold start runs (lake initialization) in the ECMWF forecast system
 in the ECMWF forecast system") 2nd Workshop on Parameterization of Lakes in Numerical Weather Prediction and Climate Modelling Lake parameters climatology for cold start runs (lake initialization) in the ECMWF forecast system R. Salgado(1),
2nd Workshop on Parameterization of Lakes in Numerical Weather Prediction and Climate Modelling Lake parameters climatology for cold start runs (lake initialization) in the ECMWF forecast system R. Salgado(1),
NIDIS Intermountain West Drought Early Warning System October 30, 2018
 10/30/2018 NIDIS Drought and Water Assessment NIDIS Intermountain West Drought Early Warning System October 30, 2018 Precipitation The images above use daily precipitation statistics from NWS COOP, CoCoRaHS,
NIDIS Intermountain West Drought Early Warning System January 22, 2019
 NIDIS Drought and Water Assessment NIDIS Intermountain West Drought Early Warning System January 22, 2019 Precipitation The images above use daily precipitation statistics from NWS COOP, CoCoRaHS, and
NIDIS Intermountain West Drought Early Warning System January 16, 2018
 NIDIS Drought and Water Assessment NIDIS Intermountain West Drought Early Warning System January 16, 2018 Precipitation The images above use daily precipitation statistics from NWS COOP, CoCoRaHS, and
TREE WATER USE PATTERNS ARE MAINLY DRIVEN BY ENVIRONMENTAL VARIABLES AND TREE STRUCTURAL PARAMETERS IN HUMID TEMPERATE DECIDUOUS HARDWOOD FORESTS
 TREE WATER USE PATTERNS ARE MAINLY DRIVEN BY ENVIRONMENTAL VARIABLES AND TREE STRUCTURAL PARAMETERS IN HUMID TEMPERATE DECIDUOUS HARDWOOD FORESTS Virginia Hernandez-Santana, Heidi Asbjornsen Presented
Lake Tahoe Watershed Model. Lessons Learned through the Model Development Process
 Lake Tahoe Watershed Model Lessons Learned through the Model Development Process Presentation Outline Discussion of Project Objectives Model Configuration/Special Considerations Data and Research Integration
NIDIS Intermountain West Drought Early Warning System March 26, 2019
 NIDIS Intermountain West Drought Early Warning System March 26, 2019 The images above use daily precipitation statistics from NWS COOP, CoCoRaHS, and CoAgMet stations. From top to bottom, and left to right:
ATMOSPHERIC CIRCULATION AND WIND
 ATMOSPHERIC CIRCULATION AND WIND The source of water for precipitation is the moisture laden air masses that circulate through the atmosphere. Atmospheric circulation is affected by the location on the
Mapping Temperature across Complex Terrain
 Mapping Temperature across Complex Terrain Jessica Lundquist 1, Nick Pepin 2, Phil Mote 3 1 Assistant Professor, Civil and Environmental Engineering, University of Washington 2 Lecturer, Department of
Evapotranspiration. Rabi H. Mohtar ABE 325
 Evapotranspiration Rabi H. Mohtar ABE 325 Introduction What is it? Factors affecting it? Why we need to estimate it? Latent heat of vaporization: Liquid gas o Energy needed o Cooling process Saturation
Presented by Jerry A. Gomez, P.E. National Hydropower Association Northeast Regional Meeting - September 17, 2009
 Presented by Jerry A. Gomez, P.E. National Hydropower Association Northeast Regional Meeting - September 17, 2009 Defining Probable Maximum Precipitation (PMP) PMP is the theoretically greatest depth of
Cooperative Institute for Research in Environmental Sciences (CIRES) CU-Boulder 2. National Oceanic and Atmospheric Administration
 CU-Boulder 2. National Oceanic and Atmospheric Administration") Moisture transport during the inland penetrating atmospheric river of early November 006 in the Pacific Northwest: A high-resolution model-based study Michael J. Mueller 1 and Kelly Mahoney 1 Cooperative
Moisture transport during the inland penetrating atmospheric river of early November 006 in the Pacific Northwest: A high-resolution model-based study Michael J. Mueller 1 and Kelly Mahoney 1 Cooperative
NIDIS Intermountain West Drought Early Warning System February 19, 2019
 NIDIS Intermountain West Drought Early Warning System February 19, 2019 Precipitation The images above use daily precipitation statistics from NWS COOP, CoCoRaHS, and CoAgMet stations. From top to bottom,
Precipitation. Standardized Precipitation Index. NIDIS Intermountain West Drought Early Warning System September 5, 2017
 9/6/2017 NIDIS Drought and Water Assessment NIDIS Intermountain West Drought Early Warning System September 5, 2017 Precipitation The images above use daily precipitation statistics from NWS COOP, CoCoRaHS,
NIDIS Intermountain West Drought Early Warning System August 8, 2017
 NIDIS Drought and Water Assessment 8/8/17, 4:43 PM NIDIS Intermountain West Drought Early Warning System August 8, 2017 Precipitation The images above use daily precipitation statistics from NWS COOP,
INTERPOLATING SURFACE AIR TEMPERATURE FOR USE IN SEMI-DISTRIBUTED SNOWMELT RUNOFF MODELS
 INTERPOLATING SURFACE AIR TEMPERATURE FOR USE IN SEMI-DISTRIBUTED SNOWMELT RUNOFF MODELS Best Poster Award, WSC 2005 - T. R. Blandford, B. J. Harshburger, K. S. Humes, B. C. Moore, V. P. Walden 1 ABSTRACT
MxVision WeatherSentry Web Services Content Guide
 MxVision WeatherSentry Web Services Content Guide July 2014 DTN 11400 Rupp Drive Minneapolis, MN 55337 00.1.952.890.0609 This document and the software it describes are copyrighted with all rights reserved.
Southern Sierra Critical Zone Observatory (CZO): hydrochemical characteristics, science & measurement strategy
: hydrochemical characteristics, science & measurement strategy") Southern Sierra Critical Zone Observatory (CZO): hydrochemical characteristics, science & measurement strategy R. Bales, C. Hunsaker, M. Conklin, J. Kirchner, B. Boyer, P. Kirchner underlying hypothesis:
Southern Sierra Critical Zone Observatory (CZO): hydrochemical characteristics, science & measurement strategy R. Bales, C. Hunsaker, M. Conklin, J. Kirchner, B. Boyer, P. Kirchner underlying hypothesis:
AQRP Monthly Technical Report
 AQRP Monthly Technical Report PROJECT TITLE PROJECT PARTICIPANTS Improving Modeled Biogenic Isoprene Emissions under Drought Conditions and Evaluating Their Impact on Ozone Formation Qi Ying, Gunnar W.
Combining Deterministic and Probabilistic Methods to Produce Gridded Climatologies
 Combining Deterministic and Probabilistic Methods to Produce Gridded Climatologies Michael Squires Alan McNab National Climatic Data Center (NCDC - NOAA) Asheville, NC Abstract There are nearly 8,000 sites
P1.34 MULTISEASONALVALIDATION OF GOES-BASED INSOLATION ESTIMATES. Jason A. Otkin*, Martha C. Anderson*, and John R. Mecikalski #
 P1.34 MULTISEASONALVALIDATION OF GOES-BASED INSOLATION ESTIMATES Jason A. Otkin*, Martha C. Anderson*, and John R. Mecikalski # *Cooperative Institute for Meteorological Satellite Studies, University of
ENGRG Introduction to GIS
 ENGRG 59910 Introduction to GIS Michael Piasecki March 17, 2014 Lecture 08: Terrain Analysis Outline: Terrain Analysis Earth Surface Representation Contour TIN Mass Points Digital Elevation Models Slope
Name the surface winds that blow between 0 and 30. GEO 101, February 25, 2014 Monsoon Global circulation aloft El Niño Atmospheric water
 GEO 101, February 25, 2014 Monsoon Global circulation aloft El Niño Atmospheric water Name the surface winds that blow between 0 and 30 What is the atmospheric pressure at 0? What is the atmospheric pressure
Promoting Rainwater Harvesting in Caribbean Small Island Developing States Water Availability Mapping for Grenada Preliminary findings
 Promoting Rainwater Harvesting in Caribbean Small Island Developing States Water Availability Mapping for Grenada Preliminary findings National Workshop Pilot Project funded by The United Nations Environment
Implementation of CLIMAP and GIS for Mapping the Climatic Dataset of Northern Iraq
 Implementation of CLIMAP and GIS for Mapping the Climatic Dataset of Northern Iraq Sabah Hussein Ali University of Mosul/Remote sensing Center KEYWORDS: CLIMAP, GIS, DEM, Climatic, IRAQ ABSTRACT The main
Deliverable 1.1 Historic Climate
 Deliverable 1.1 Historic Climate 16.04.2013 Christopher Thurnher ARANGE - Grant no. 289437- Advanced multifunctional forest management in European mountain ranges www.arange-project.eu Document Properties
ENGRG Introduction to GIS
 ENGRG 59910 Introduction to GIS Michael Piasecki November 17, 2017 Lecture 11: Terrain Analysis Outline: Terrain Analysis Earth Surface Representation Contour TIN Mass Points Digital Elevation Models Slope
Using Multivariate Adaptive Constructed Analogs (MACA) data product for climate projections
 data product for climate projections") Using Multivariate Adaptive Constructed Analogs (MACA) data product for climate projections Maria Herrmann and Ray Najjar Chesapeake Hypoxia Analysis and Modeling Program (CHAMP) Conference Call 2017-04-21
Using Multivariate Adaptive Constructed Analogs (MACA) data product for climate projections Maria Herrmann and Ray Najjar Chesapeake Hypoxia Analysis and Modeling Program (CHAMP) Conference Call 2017-04-21
Appendix A Calibration Memos
 Appendix A Calibration Memos University of Washington Department of Civil and Environmental Engineering TO: Joe Dvorak FROM: Margaret Hahn and Richard Palmer RE: DVSVM Calibration DATE: June 28, 21 This
NIDIS Intermountain West Drought Early Warning System October 17, 2017
 NIDIS Drought and Water Assessment NIDIS Intermountain West Drought Early Warning System October 17, 2017 Precipitation The images above use daily precipitation statistics from NWS COOP, CoCoRaHS, and
Flood Forecasting Tools for Ungauged Streams in Alberta: Status and Lessons from the Flood of 2013
 Flood Forecasting Tools for Ungauged Streams in Alberta: Status and Lessons from the Flood of 2013 John Pomeroy, Xing Fang, Kevin Shook, Tom Brown Centre for Hydrology, University of Saskatchewan, Saskatoon
Advances in Statistical Downscaling of Meteorological Data:
 Advances in Statistical Downscaling of Meteorological Data: Development, Validation and Applications John Abatzoglou University of Idaho Department t of Geography EPSCoR Western Tri-State Consortium 7
Joseph M. Shea 1, R. Dan Moore, Faron S. Anslow University of British Columbia, Vancouver, BC, Canada. 1 Introduction
 17th Conference on Applied Climatology, American Meteorological Society, 11-1 August, 28, Whistler, BC, Canada P2. - Estimating meteorological variables within glacier boundary layers, Southern Coast Mountains,
Evapotranspiration. Andy Black. CCRN Processes Workshop, Hamilton, ON, Sept Importance of evapotranspiration (E)
") Evapotranspiration Andy Black CCRN Processes Workshop, Hamilton, ON, 12-13 Sept 213 Importance of evapotranspiration (E) This process is important in CCRN goals because 1. Major component of both terrestrial
Evapotranspiration Andy Black CCRN Processes Workshop, Hamilton, ON, 12-13 Sept 213 Importance of evapotranspiration (E) This process is important in CCRN goals because 1. Major component of both terrestrial
Assimilation of ASCAT soil wetness
 EWGLAM, October 2010 Assimilation of ASCAT soil wetness Bruce Macpherson, on behalf of Imtiaz Dharssi, Keir Bovis and Clive Jones Contents This presentation covers the following areas ASCAT soil wetness
2011 National Seasonal Assessment Workshop for the Eastern, Southern, & Southwest Geographic Areas
 2011 National Seasonal Assessment Workshop for the Eastern, Southern, & Southwest Geographic Areas On January 11-13, 2011, wildland fire, weather, and climate met virtually for the ninth annual National
Projection of Evapotranspiration from Regional Climate Models: Challenges
 Projection of Evapotranspiration from Regional Climate Models: Challenges Jayantha Obeysekera ( Obey ) Chief Modeler, SFWMD Affiliate Research Professor, CES, FAU Hydrology of the Everglades in the Context
Prediction of Snow Water Equivalent in the Snake River Basin
 Hobbs et al. Seasonal Forecasting 1 Jon Hobbs Steve Guimond Nate Snook Meteorology 455 Seasonal Forecasting Prediction of Snow Water Equivalent in the Snake River Basin Abstract Mountainous regions of
The National Integrated Drought Information System (NIDIS) Moving the Nation from Reactive to Proactive Drought Risk Management
 Moving the Nation from Reactive to Proactive Drought Risk Management") The National Integrated Drought Information System (NIDIS) Moving the Nation from Reactive to Proactive Drought Risk Management CSG-West Annual Meeting Agriculture & Water Committee Snowbird, UT September
The National Integrated Drought Information System (NIDIS) Moving the Nation from Reactive to Proactive Drought Risk Management CSG-West Annual Meeting Agriculture & Water Committee Snowbird, UT September
The National Operational Hydrologic Remote Sensing Center Operational Snow Analysis
 The National Operational Hydrologic Remote Sensing Center Operational Snow Analysis World Meteorological Organization Global Cryosphere Watch Snow-Watch Workshop Session 3: Snow Analysis Products Andrew
ECPC/NCEP March 2008 Seasonal Fire Danger Forecasts J. Roads 1, P. Tripp 1, H. Juang 2, J. Wang 2, S. Chen 3, F. Fujioka 3
 Roads, J., P. Tripp, H. Juang, J. Wang, S. Chen, F. Fujioka, 2008: ECPC/NCEP March 2008 Seasonal Fire Danger Forecasts. Experimental Long-Lead Forecasts Bulletin, 17, 7 pp. ECPC/NCEP March 2008 Seasonal
NIDIS Intermountain West Drought Early Warning System May 1, 2018
 NIDIS Intermountain West Drought Early Warning System May 1, 2018 Precipitation The images above use daily precipitation statistics from NWS COOP, CoCoRaHS, and CoAgMet stations. From top to bottom, and
Spatial Survey of Surface Soil Moisture in a Sub-alpine Watershed Colloquium Presentation, University of Denver, Department of Geography
 Thank you all for coming today. I will be talking about my thesis work concerning the spatial distribution of soil moisture in an alpine catchment. But first we need some background in soil moisture. Why
The Colorado Climate Center at CSU. residents of the state through its threefold
 The CoAgMet Network: Overview History and How It Overview, Works N l Doesken Nolan D k and d Wendy W d Ryan R Colorado Climate Center Colorado State University First -- A short background In 1973 the federal
FOREST FIRE HAZARD MODEL DEFINITION FOR LOCAL LAND USE (TUSCANY REGION)
") FOREST FIRE HAZARD MODEL DEFINITION FOR LOCAL LAND USE (TUSCANY REGION) C. Conese 3, L. Bonora 1, M. Romani 1, E. Checcacci 1 and E. Tesi 2 1 National Research Council - Institute of Biometeorology (CNR-
FOREST FIRE HAZARD MODEL DEFINITION FOR LOCAL LAND USE (TUSCANY REGION) C. Conese 3, L. Bonora 1, M. Romani 1, E. Checcacci 1 and E. Tesi 2 1 National Research Council - Institute of Biometeorology (CNR-
Influence of variations in low-level moisture and soil moisture on the organization of summer convective systems in the US Midwest
 Influence of variations in low-level moisture and soil moisture on the organization of summer convective systems in the US Midwest Jimmy O. Adegoke 1, Sajith Vezhapparambu 1, Christopher L. Castro 2, Roger
Regional Precipitation and ET Patterns: Impacts on Agricultural Water Management
 Regional Precipitation and ET Patterns: Impacts on Agricultural Water Management Christopher H. Hay, PhD, PE Ag. and Biosystems Engineering South Dakota State University 23 November 2010 Photo: USDA-ARS
The 21 st Century Colorado River Hot Drought and Implications for the Future
 Coauthor: Jonathan Overpeck The 21 st Century Colorado River Hot Drought and Implications for the Future CRWCD State of the River May 4, 2017 Brad Udall Colorado State University Bradley.udall@colostate.edu
Eric. W. Harmsen 1, John Mecikalski 2, Vanessa Acaron 3 and Jayson Maldonado 3
 Estimating Ground-Level Solar Radiation and Evapotranspiration In Puerto Rico Using Satellite Remote Sensing Eric. W. Harmsen 1, John Mecikalski 2, Vanessa Acaron 3 and Jayson Maldonado 3 1 Department
NIDIS Intermountain West Drought Early Warning System November 13, 2018
 NIDIS Intermountain West Drought Early Warning System November 13, 2018 Precipitation The images above use daily precipitation statistics from NWS COOP, CoCoRaHS, and CoAgMet stations. From top to bottom,
NIDIS Intermountain West Drought Early Warning System December 30, 2018
 1/2/2019 NIDIS Drought and Water Assessment NIDIS Intermountain West Drought Early Warning System December 30, 2018 Precipitation The images above use daily precipitation statistics from NWS COOP, CoCoRaHS,
Development of the Canadian Precipitation Analysis (CaPA) and the Canadian Land Data Assimilation System (CaLDAS)
 and the Canadian Land Data Assimilation System (CaLDAS)") Development of the Canadian Precipitation Analysis (CaPA) and the Canadian Land Data Assimilation System (CaLDAS) Marco L. Carrera, Vincent Fortin and Stéphane Bélair Meteorological Research Division Environment
Development of the Canadian Precipitation Analysis (CaPA) and the Canadian Land Data Assimilation System (CaLDAS) Marco L. Carrera, Vincent Fortin and Stéphane Bélair Meteorological Research Division Environment
Thermal / Solar. When air is warmed it... Rises. Solar Energy. Evaporation. Condensation Forms Clouds
 Thermal / Solar Light from the Sun is transformed into what type of energy when it hits Earth's surface? Rises When air is warmed it... Solar Energy Water moves through the water cycle using what type
Contents. 1. Evaporation
 Contents 1 Evaporation 1 1a Evaporation from Wet Surfaces................... 1 1b Evaporation from Wet Surfaces in the absence of Advection... 4 1c Bowen Ratio Method........................ 4 1d Potential
Climates of NYS. Definitions. Climate Regions of NYS. Storm Tracks. Climate Controls 10/13/2011. Characteristics of NYS s Climates
 Definitions Climates of NYS Prof. Anthony Grande 2011 Weather and Climate Weather the state of the atmosphere at one point in time. The elements of weather are temperature, air pressure, wind and moisture.
Central Asia Regional Flash Flood Guidance System 4-6 October Hydrologic Research Center A Nonprofit, Public-Benefit Corporation
 http://www.hrcwater.org Central Asia Regional Flash Flood Guidance System 4-6 October 2016 Hydrologic Research Center A Nonprofit, Public-Benefit Corporation FFGS Snow Components Snow Accumulation and
Direction and range of change expected in the future
 Direction and range of Air Temperature Over the past 30 years, air Across the greater PNW and temperature has been Columbia Basin, an ensemble increasing an average of forecast from ten of the best 0.13
ATMOSPHERIC ENERGY and GLOBAL TEMPERATURES. Physical Geography (Geog. 300) Prof. Hugh Howard American River College
 Prof. Hugh Howard American River College") ATMOSPHERIC ENERGY and GLOBAL TEMPERATURES Physical Geography (Geog. 300) Prof. Hugh Howard American River College RADIATION FROM the SUN SOLAR RADIATION Primarily shortwave (UV-SIR) Insolation Incoming
ATMOSPHERIC ENERGY and GLOBAL TEMPERATURES Physical Geography (Geog. 300) Prof. Hugh Howard American River College RADIATION FROM the SUN SOLAR RADIATION Primarily shortwave (UV-SIR) Insolation Incoming
RELATIONSHIP BETWEEN CLIMATIC CONDITIONS AND SOIL PROPERTIES AT SCAN AND SNOTEL SITES IN UTAH. Karen Vaughan 1 and Randy Julander 2 ABSTRACT
 RELATIONSHIP BETWEEN CLIMATIC CONDITIONS AND SOIL PROPERTIES AT SCAN AND SNOTEL SITES IN UTAH Karen Vaughan 1 and Randy Julander 2 ABSTRACT To improve our understanding of the influence of climatic conditions
Lecture 4 Air Temperature. Measuring Temperature. Measuring Temperature. Surface & Air Temperature. Environmental Contrasts 3/27/2012
 Lecture 4 Air Temperature Geo210 An Introduction to Physical Geography Temperature Concepts and Measurement Temperature the average kinetic energy (motion) of molecules of matter Temperature Scales Fahrenheit
Georgy V. Mostovoy*¹, Valentine Anantharaj¹, Paul R. Houser², and Christa D. Peters-Lidard³
 P2.3 USE OF SCAN OBSERVATIONS FOR VALIDATION OF SOIL MOISTURE SPATIAL DISTRIBUTION SIMULATED BY THE LAND-SURFACE MODEL OVER THE LOWER MISSISSIPPI DELTA REGION Georgy V. Mostovoy*¹, Valentine Anantharaj¹,
John R. Mecikalski #1, Martha C. Anderson*, Ryan D. Torn #, John M. Norman*, George R. Diak #
 P4.22 THE ATMOSPHERE-LAND EXCHANGE INVERSE (ALEXI) MODEL: REGIONAL- SCALE FLUX VALIDATIONS, CLIMATOLOGIES AND AVAILABLE SOIL WATER DERIVED FROM REMOTE SENSING INPUTS John R. Mecikalski #1, Martha C. Anderson*,
National Wildland Significant Fire Potential Outlook
 National Wildland Significant Fire Potential Outlook National Interagency Fire Center Predictive Services Issued: April 1, 2008 Next Issue: May 1, 2008 Wildland Fire Outlook April 2008 through July 2008
BARRA: A high-resolution atmospheric reanalysis over Australia for
 BARRA: A high-resolution atmospheric reanalysis over Australia for 1990-2016 Chun-Hsu Su, Australian Bureau of Meteorology N. Eizenberg 1, G. Kuciuba 1, P. Steinle 1, D. Jakob 1, P. Fox-Hughes 1, R. Renshaw
Alberta Climate Information Service (ACIS) Definitions. Disclaimer. Overview
 Definitions. Disclaimer. Overview") Alberta Climate Information Service (ACIS) Definitions Disclaimer Please note that due to technical difficulties AF s IT team has only committed to having ACIS and Roping the web services achieve a 95%
Alberta Climate Information Service (ACIS) Definitions Disclaimer Please note that due to technical difficulties AF s IT team has only committed to having ACIS and Roping the web services achieve a 95%
Potential (Reference) and Actual Evapotranspiration Trends across U.S. High Plains in Relation to Irrigation Development and Climate Change
 and Actual Evapotranspiration Trends across U.S. High Plains in Relation to Irrigation Development and Climate Change") EXTENSION Know how. Know now. EC712 Potential (Reference) and Actual Evapotranspiration Trends across U.S. High Plains in Relation to Irrigation Development and Climate Change Suat Irmak, Extension Soil
EXTENSION Know how. Know now. EC712 Potential (Reference) and Actual Evapotranspiration Trends across U.S. High Plains in Relation to Irrigation Development and Climate Change Suat Irmak, Extension Soil