Central Asia Regional Flash Flood Guidance System 4-6 October Hydrologic Research Center A Nonprofit, Public-Benefit Corporation
|
|
|
- Kathleen Kennedy
- 5 years ago
- Views:
Transcription


1 Central Asia Regional Flash Flood Guidance System 4-6 October 2016 Hydrologic Research Center A Nonprofit, Public-Benefit Corporation
2
3 FFGS Snow Components Snow Accumulation and Ablation Model Model Input (MAT and MAP) Snow Cover (IMS) Model Evaluation
4 Satellite Rainfall GHE -CMORPH Gauge Rainfall Radar Rainfall (Real Time 1-Hourly) Rainfall Data Quality Control & Merging (Real Time/ 6-Hourly) MAP & MAT Snow Model Temperature Estimate Gauge/GFS Climatological Reference ET Forecaster Review and Warning Dissemination Flash Flood Guidance Model Flash Flood Guidance Soil Model Threshold Runoff Satellite (IMS) Snow Cover Area Spatial Data Terrain, LULC, Soils Streams
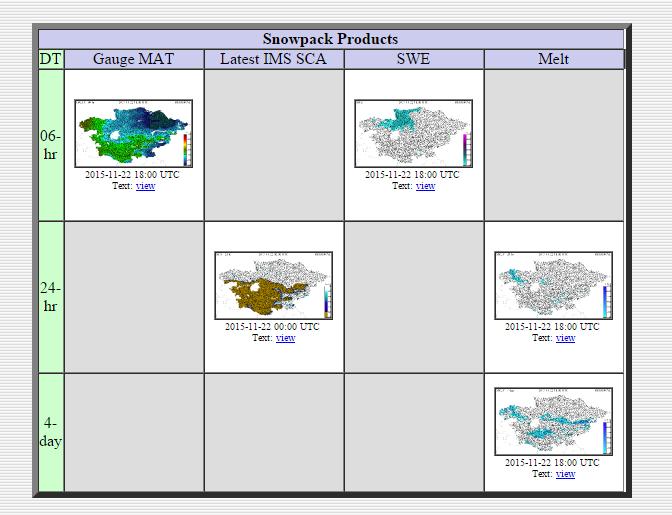
5 Gauge GFS Climate Rain MAP Surface Temperature MAT FFT Obs. Snow depth & SWE Snow Model Frozen Ground SACSMA FFG Observed & Forecast MAP For SCA > 0.4 IN= Rain *(1-SCA) For SCA < 0.4 SWE Melt RAIN Satellite Snow Cover
6 Anderson, Eric A., 1973: "National Weather Service River Forecast System -- Snow Accumulation and Ablation Model", NOAA Technical Memorandum NWS HYDRO-17, US Dept. of Commerce, Silver Spring, MD, 217p. Anderson, Eric, A., 1976: "A Point Energy and Mass Balance Model of a Snow Cover", NOAA Technical Report 19, U.S. Dept. of Commerce, Silver Spring, MD, 1p. snow17.pdf
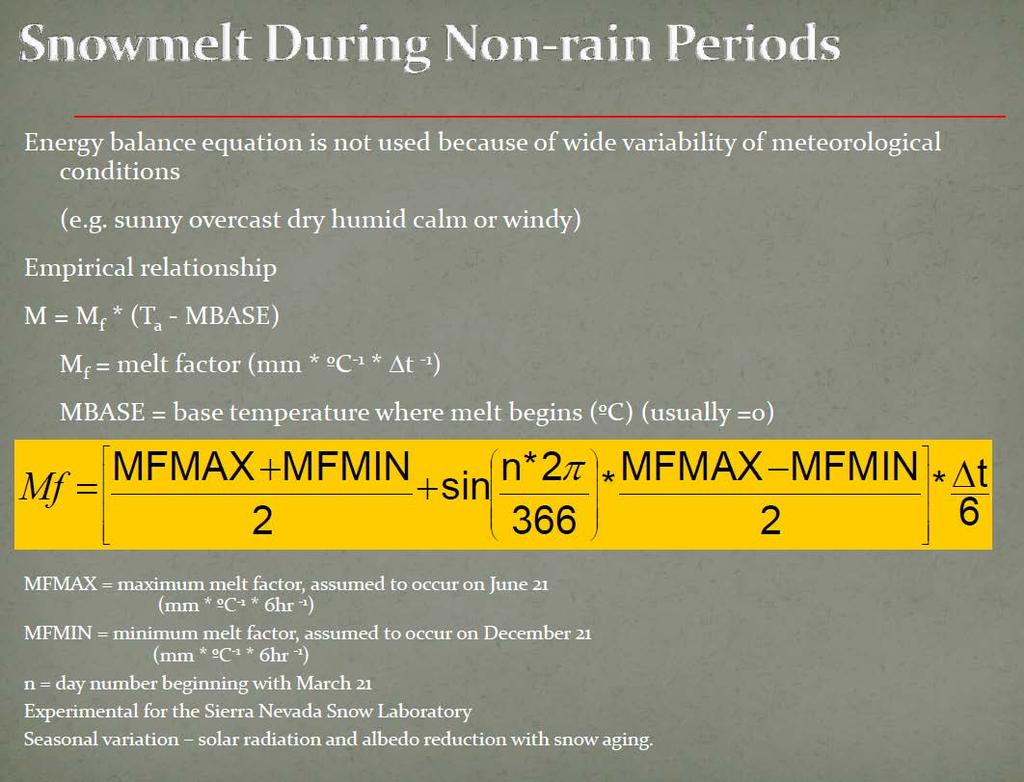
7 Snow Accumulation and Ablation Model (SNOW-17) of the U.S. NWS (Anderson, 1973; Anderson, 2005) Operational model at the National Weather Service, U.S.A A conceptual areal lumped energy and mass balance model Air Temperature used as an index for pack energy and division of precipitation as rain or snow Considers: melt during no rain; melt during rain; no melt Model states track: snow water equivalent (SWE), heat deficit, liquid content, and snow cover area
8 SNOW-17 MODEL: Rain on Bare Ground Rain Plus Melt Precipitation and Air Temperature Rain or Snow Accumulated Snow Cover Energy Exchange at Snow-Air Interface Snow Cover Heat Deficit Ground Melt Snow Cover Outflow Snow-17: Conceptual energy and mass balance Require MAP and MAT data Single vertical layer Three modules: Melt during rain Melt during no rain Heat accounting during no melt Describe the snow cover extent using the Snow Depletion Curve Deficit = 0 Areal Extent of the Snow Cover Liquid Water Storage Transmission of Excess Water
9 States SWE - Snow water equivalent Liquid content PLWHC parameter (vertical transmission through the pack) Heat Deficit - Energy required to bring the snowpack to isothermal 0º C ATI Antecedent Temperature Index Snow Pack Depth (Optional) SCA - Snow Cover Area Rain plus Melt Output
10 Surface Air Temperature Index for the pack energy balance and determine the form of precipitation (rain or snow) Precipitation determine amount of snowfall and amount of rain-on-snow (PXTEMP) SCF - Multiplying factor that adjusts precipitation data for gage catch deficiencies during periods of snowfall Other Data (when available) Snowfall Snow course and/or snow sensors (water-equivalent) Areal extent of snow cover (satellite)

11 ( Anderson 2006) PXTEMP threshold temperature parameter (2 C)
12
13
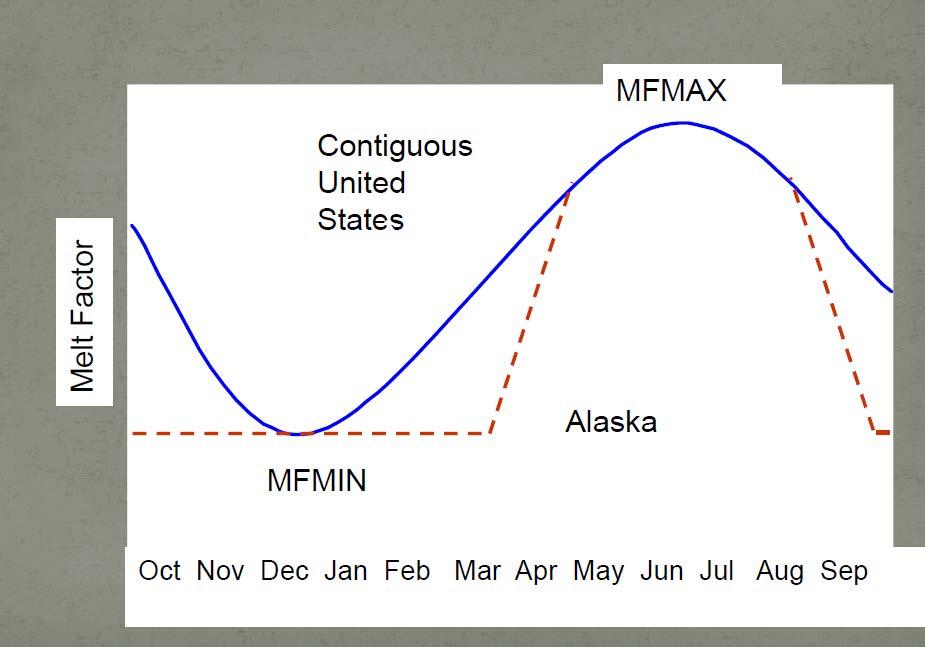
14 LAND COVER Coniferous forest /persistent cloud cover Mixed forest Coniferous plus open and/or deciduous MF MAX MF MIN (mm C 6hr -1 ) (mm C 6hr -1 ) Predominantly Deciduous Open Areas flat terrain Mountainous terrain Table 2. Recommendation for MF MAX and MF MIN values (Anderson 2002) 14


15 AVHRR Global Land Cover Product GLCF 1 km resolution GTOPO DEM (~km)
16
17 Interactive Multisensor Snow and Ice Mapping System (IMS), made available through National Snow and Ice Data Center, NOAA. Northern Hemisphere daily snow cover based on summary of multiple satellites at 4km x 4km resolution. Product defines: Snow covered land, sea ice, sea land (no snow) Since December 2014 a 1 km SCA and snow depth (4-km) products are available (to be evaluated for FFGS) Generally available within 1 day (often within several hours) following date of observation Archive is available for 2006-current Helfrich et al., 2007 Hydrological Processes

18 43 42 Turkey: Location of Snow stations All Stations Selected Stations 41 Latitude o N Longitude o W
19 GOOD AGGREMMENT BETWEEN SNOW AT THE STATION AND THE CLOSEST GRID CELL Comparison between snow stations to the 4km snow cover from the satellite Data from 289 stations 139 stations reported one daily event or more. The map shows the station locations that have frequent reports 7224 Daily total reports for these period As the SWE increase as the t-hold for cover by the satellite the percent agreement and disagreement between the station and the satellite increases and decreases respectively Percent YES-station ; YES-Satellite YES-station ; NO-Satellite Number of snow stations Exceedance of daily reports of snow for Threshold of SWE (mm) at the Stations
20 Incorporating Glacier mapping information in the FFGS GLIMS: Global Land Ice Measurements from Space ( ) National Snow and Ice Data Center Contribution from more than 60 institutions Based on data from ASTER (Advanced Spaceborne Thermal Emission and reflection Radiometer) and the Landsat Enhanced Thematic Mapper Plus (ETM+) as well as historical information derived from maps and aerial photographs. Map was updated in December 2014 Raup, B.H.; A. Racoviteanu; S.J.S. Khalsa; C. Helm; R. Armstrong; Y. Arnaud (2007). "The GLIMS Geospatial Glacier Database: a New Tool for Studying Glacier Change". Global and Planetary Change 56: (doi: /j.gloplacha )

21 Basin fractional cover
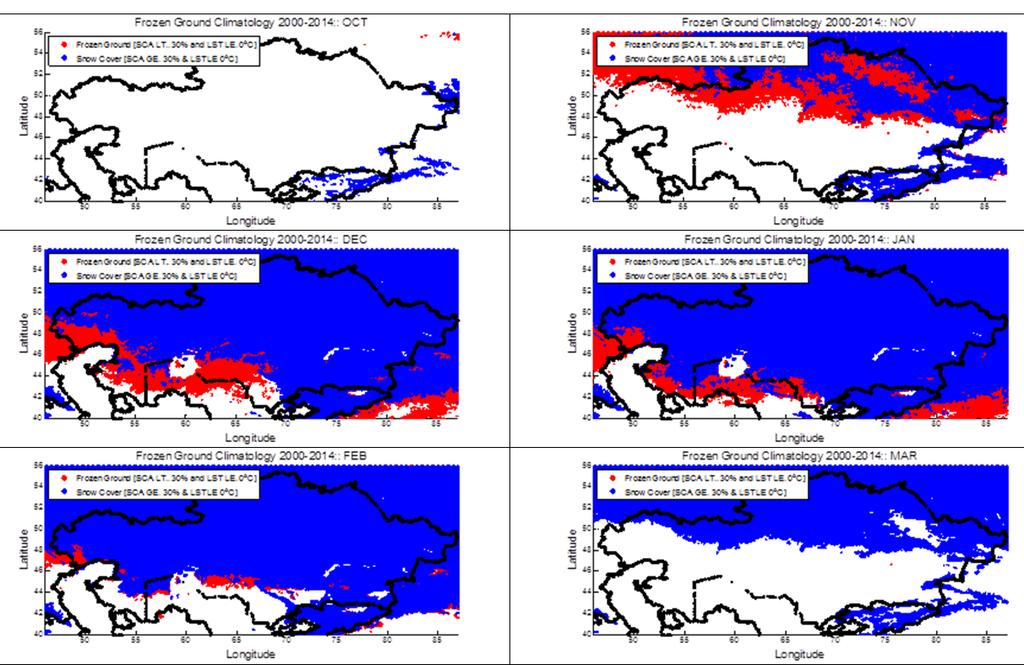
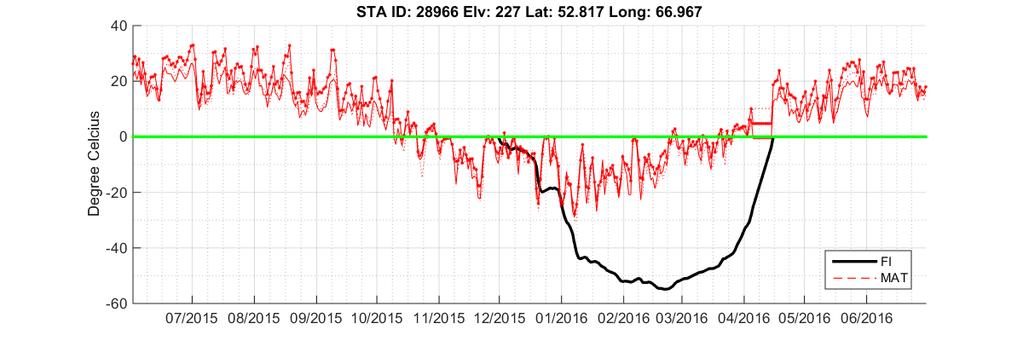
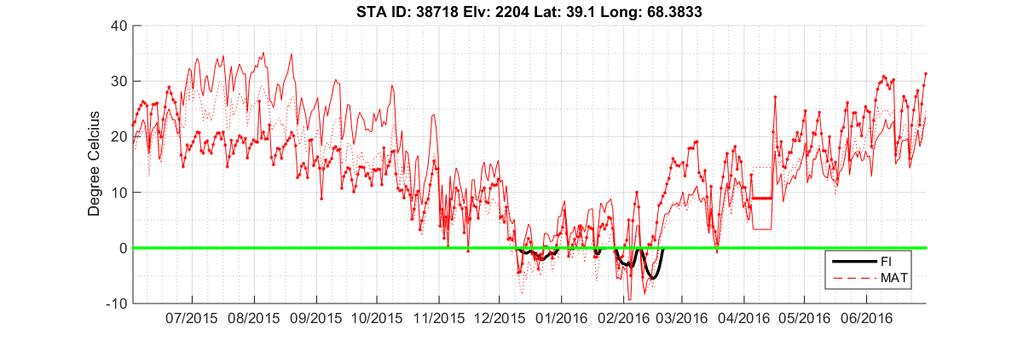
22 Frozen ground can have a significant effect on streamflow The modeling of frozen ground using a Frost Index (FI) Operational data source that can be used operationally in the FFGS (CFSv2) Evaluation of Regional Frost Index
23 NWSRFS Frost Index model (Anderson & Neuman, 1984) The importance of simulating frozen ground
24 Calculating an empirical Frost Index [FI] as a function of: Air Surface Temperature [Ta] Snow depth [SD] Snow cover area [SCA] Ta Frost Index
25 A multiplier that reduces percolation and interflow withdrawal rates as a function of soil moisture NO REDUCTION MAX. REDUCTION WET DRY
26 Reduction Factor

27 Land cover map: Klein et al., 2012
28
29 Thaw Onset - Frost Index [FI] Density Function(Fraction) Days from Jan NCDC 2013 NCDC 2014 CFS 2013 CFS Latitude ( o N) Difference of Thaw Onset [NCDC-CFS] (days) Difference of Thaw Onset [NCDC-CFS] (days) Elevation (m)
30 Thaw Onset Skin 2012 Thaw Onset Skin 2013 Thaw Onset Skin Thaw Onset 0-0.1m 2012 Thaw Onset 0-0.1m 2013 Thaw Onset 0-0.1m Latitude Thaw Onset m Latitude Thaw Onset m Latitude Thaw Onset m Thaw Onset 0.4-1m 2012 Thaw Onset 0.4-1m 2013 Thaw Onset 0.4-1m Thaw Onset 1-2m 2012 Thaw Onset 1-2m 2013 Thaw Onset 1-2m Longitude Feb Mar Apr May Longitude Longitude
31 Freezing Onset Skin 2012 Freezing Onset Skin 2013 Freezing Onset Skin Freezing Onset 0-0.1m 2012 Freezing Onset 0-0.1m 2013 Freezing Onset 0-0.1m Latitude Freezing Onset m Latitude Freezing Onset m Latitude Freezing Onset m Freezing Onset 0.4-1m 2012 Freezing Onset 0.4-1m 2013 Freezing Onset 0.4-1m Freezing Onset 1-2m 2012 Freezing Onset 1-2m 2013 Freezing Onset 1-2m Longitude Sept Oct Nov Dec Longitude Longitude
32

33
Precipitation, Soil Moisture, Snow, and Flash Flood Guidance Components
 Precipitation, Soil Moisture, Snow, and Flash Flood Guidance Components HYDROLOGIC RESEARCH CENTER 6 May 2015 Flash Flood Basin Delineation GIS processing of digital elevation data to delineate small flash
CARFFG System Development and Theoretical Background
 CARFFG Steering Committee Meeting 15 SEPTEMBER 2015 Astana, KAZAKHSTAN CARFFG System Development and Theoretical Background Theresa M. Modrick, PhD Hydrologic Research Center Key Technical Components -
Haiti-Dominican Republic Flash Flood Guidance (HDRFFG) System: Development of System Products
 System: Development of System Products") Haiti-Dominican Republic Flash Flood Guidance (HDRFFG) System: Development of System Products Theresa M. Modrick, PhD Hydrologic Research Center HDRFFG Initial Planning Meeting 07-09 Sep 2015 Santo Domingo,
Haiti-Dominican Republic Flash Flood Guidance (HDRFFG) System: Development of System Products Theresa M. Modrick, PhD Hydrologic Research Center HDRFFG Initial Planning Meeting 07-09 Sep 2015 Santo Domingo,
2015 Fall Conditions Report
 2015 Fall Conditions Report Prepared by: Hydrologic Forecast Centre Date: December 21 st, 2015 Table of Contents Table of Figures... ii EXECUTIVE SUMMARY... 1 BACKGROUND... 2 SUMMER AND FALL PRECIPITATION...
Regional Flash Flood Guidance and Early Warning System
 WMO Training for Trainers Workshop on Integrated approach to flash flood and flood risk management 24-28 October 2010 Kathmandu, Nepal Regional Flash Flood Guidance and Early Warning System Dr. W. E. Grabs
ESTIMATING SNOWMELT CONTRIBUTION FROM THE GANGOTRI GLACIER CATCHMENT INTO THE BHAGIRATHI RIVER, INDIA ABSTRACT INTRODUCTION
 ESTIMATING SNOWMELT CONTRIBUTION FROM THE GANGOTRI GLACIER CATCHMENT INTO THE BHAGIRATHI RIVER, INDIA Rodney M. Chai 1, Leigh A. Stearns 2, C. J. van der Veen 1 ABSTRACT The Bhagirathi River emerges from
2017 Fall Conditions Report
 2017 Fall Conditions Report Prepared by: Hydrologic Forecast Centre Date: November 15, 2017 Table of Contents TABLE OF FIGURES... ii EXECUTIVE SUMMARY... 1 BACKGROUND... 4 SUMMER AND FALL PRECIPITATION...
Modeling of peak inflow dates for a snowmelt dominated basin Evan Heisman. CVEN 6833: Advanced Data Analysis Fall 2012 Prof. Balaji Rajagopalan
 Modeling of peak inflow dates for a snowmelt dominated basin Evan Heisman CVEN 6833: Advanced Data Analysis Fall 2012 Prof. Balaji Rajagopalan The Dworshak reservoir, a project operated by the Army Corps
An Overview of Operations at the West Gulf River Forecast Center Gregory Waller Service Coordination Hydrologist NWS - West Gulf River Forecast Center
 National Weather Service West Gulf River Forecast Center An Overview of Operations at the West Gulf River Forecast Center Gregory Waller Service Coordination Hydrologist NWS - West Gulf River Forecast
January 25, Summary
 January 25, 2013 Summary Precipitation since the December 17, 2012, Drought Update has been slightly below average in parts of central and northern Illinois and above average in southern Illinois. Soil
Flash Flood Guidance: SARFFG modeling system
 Flash Flood Guidance: SARFFG modeling system Eugene Poolman Chief Forecasting: Disaster Risk Reduction RSMC Pretoria FCAST-PRES-20141021-001.1 Flash Floods vs. River Floods River floods are caused by heavy
Global Flash Flood Guidance System Status and Outlook
 Global Flash Flood Guidance System Status and Outlook HYDROLOGIC RESEARCH CENTER San Diego, CA 92130 http://www.hrcwater.org Initial Planning Meeting on the WMO HydroSOS, Entebbe, Uganda 26-28 September
Operational Perspectives on Hydrologic Model Data Assimilation
 Operational Perspectives on Hydrologic Model Data Assimilation Rob Hartman Hydrologist in Charge NOAA / National Weather Service California-Nevada River Forecast Center Sacramento, CA USA Outline Operational
Northwest Outlook October 2016
 Northwest Outlook October 2016 Rainfall Opportunities and Challenges Rainfall over the month of September presented some challenges for the fall harvest while other producers benefitted. Figure 1a shows
The Climate of Marshall County
 The Climate of Marshall County Marshall County is part of the Crosstimbers. This region is a transition region from the Central Great Plains to the more irregular terrain of southeastern Oklahoma. Average
NIDIS Intermountain West Regional Drought Early Warning System February 7, 2017
 NIDIS Drought and Water Assessment NIDIS Intermountain West Regional Drought Early Warning System February 7, 2017 Precipitation The images above use daily precipitation statistics from NWS COOP, CoCoRaHS,
CLIMATE CHANGE AND REGIONAL HYDROLOGY ACROSS THE NORTHEAST US: Evidence of Changes, Model Projections, and Remote Sensing Approaches
 CLIMATE CHANGE AND REGIONAL HYDROLOGY ACROSS THE NORTHEAST US: Evidence of Changes, Model Projections, and Remote Sensing Approaches Michael A. Rawlins Dept of Geosciences University of Massachusetts OUTLINE
NWS FORM E-5 U.S. DEPARTMENT OF COMMERCE I HYDRO SERVICE AREA NOAA, NATIONAL WEATHER SERVICE I Indianapolis, IN MONTHLY REPORT
 NWS FORM E-5 U.S. DEPARTMENT OF COMMERCE I HYDRO SERVICE AREA NOAA, NATIONAL WEATHER SERVICE I Indianapolis, IN. 1-------------------- MONTHLY REPORT OF RIVER AND FLOOD CONDITIONSI REPORT FOR I November
Flood Forecasting Tools for Ungauged Streams in Alberta: Status and Lessons from the Flood of 2013
 Flood Forecasting Tools for Ungauged Streams in Alberta: Status and Lessons from the Flood of 2013 John Pomeroy, Xing Fang, Kevin Shook, Tom Brown Centre for Hydrology, University of Saskatchewan, Saskatoon
FFGS Concept HYDROLOGIC RESEARCH CENTER. 2 May 2017
 FFGS Concept HYDROLOGIC RESEARCH CENTER 2 May 2017 Research and Development History 1970-1988: US NWS Produces FFG statistically for each River Forecast Center. Also, research in adaptive site specific
The Climate of Pontotoc County
 The Climate of Pontotoc County Pontotoc County is part of the Crosstimbers. This region is a transition region from the Central Great Plains to the more irregular terrain of southeast Oklahoma. Average
The Climate of Payne County
 The Climate of Payne County Payne County is part of the Central Great Plains in the west, encompassing some of the best agricultural land in Oklahoma. Payne County is also part of the Crosstimbers in the
Robert Shedd Northeast River Forecast Center National Weather Service Taunton, Massachusetts, USA
 Robert Shedd Northeast River Forecast Center National Weather Service Taunton, Massachusetts, USA Outline River Forecast Centers FEWS Implementation Status Forcing Data Ensemble Forecasting The Northeast
The Climate of Bryan County
 The Climate of Bryan County Bryan County is part of the Crosstimbers throughout most of the county. The extreme eastern portions of Bryan County are part of the Cypress Swamp and Forest. Average annual
The Climate of Seminole County
 The Climate of Seminole County Seminole County is part of the Crosstimbers. This region is a transition region from the Central Great Plains to the more irregular terrain of southeastern Oklahoma. Average
The Importance of Snowmelt Runoff Modeling for Sustainable Development and Disaster Prevention
 The Importance of Snowmelt Runoff Modeling for Sustainable Development and Disaster Prevention Muzafar Malikov Space Research Centre Academy of Sciences Republic of Uzbekistan Water H 2 O Gas - Water Vapor
Preliminary Runoff Outlook February 2018
 Preliminary Runoff Outlook February 2018 Prepared by: Flow Forecasting & Operations Planning Water Security Agency General Overview The Water Security Agency (WSA) is preparing for 2018 spring runoff including
Lake Tahoe Watershed Model. Lessons Learned through the Model Development Process
 Lake Tahoe Watershed Model Lessons Learned through the Model Development Process Presentation Outline Discussion of Project Objectives Model Configuration/Special Considerations Data and Research Integration
Presentation Overview. Southwestern Climate: Past, present and future. Global Energy Balance. What is climate?
 Southwestern Climate: Past, present and future Mike Crimmins Climate Science Extension Specialist Dept. of Soil, Water, & Env. Science & Arizona Cooperative Extension The University of Arizona Presentation
The Climate of Grady County
 The Climate of Grady County Grady County is part of the Central Great Plains, encompassing some of the best agricultural land in Oklahoma. Average annual precipitation ranges from about 33 inches in northern
PRELIMINARY DRAFT FOR DISCUSSION PURPOSES
 Memorandum To: David Thompson From: John Haapala CC: Dan McDonald Bob Montgomery Date: February 24, 2003 File #: 1003551 Re: Lake Wenatchee Historic Water Levels, Operation Model, and Flood Operation This
Speakers: NWS Buffalo Dan Kelly and Sarah Jamison, NERFC Jeane Wallace. NWS Flood Services for the Black River Basin
 Speakers: NWS Buffalo Dan Kelly and Sarah Jamison, NERFC Jeane Wallace NWS Flood Services for the Black River Basin National Weather Service Who We Are The National Oceanic and Atmospheric Administration
The Climate of Kiowa County
 The Climate of Kiowa County Kiowa County is part of the Central Great Plains, encompassing some of the best agricultural land in Oklahoma. Average annual precipitation ranges from about 24 inches in northwestern
Missouri River Basin Water Management Monthly Update
 Missouri River Basin Water Management Monthly Update Participating Agencies 255 255 255 237 237 237 0 0 0 217 217 217 163 163 163 200 200 200 131 132 122 239 65 53 80 119 27 National Oceanic and Atmospheric
The Climate of Murray County
 The Climate of Murray County Murray County is part of the Crosstimbers. This region is a transition between prairies and the mountains of southeastern Oklahoma. Average annual precipitation ranges from
The Climate of Haskell County
 The Climate of Haskell County Haskell County is part of the Hardwood Forest. The Hardwood Forest is characterized by its irregular landscape and the largest lake in Oklahoma, Lake Eufaula. Average annual
The Climate of Texas County
 The Climate of Texas County Texas County is part of the Western High Plains in the north and west and the Southwestern Tablelands in the east. The Western High Plains are characterized by abundant cropland
DETECTION AND FORECASTING - THE CZECH EXPERIENCE
 1 STORM RAINFALL DETECTION AND FORECASTING - THE CZECH EXPERIENCE J. Danhelka * Czech Hydrometeorological Institute, Prague, Czech Republic Abstract Contribution presents the state of the art of operational
Operational Hydrologic Ensemble Forecasting. Rob Hartman Hydrologist in Charge NWS / California-Nevada River Forecast Center
 Operational Hydrologic Ensemble Forecasting Rob Hartman Hydrologist in Charge NWS / California-Nevada River Forecast Center Mission of NWS Hydrologic Services Program Provide river and flood forecasts
Remote Sensing of SWE in Canada
 Remote Sensing of SWE in Canada Anne Walker Climate Research Division, Environment Canada Polar Snowfall Hydrology Mission Workshop, June 26-28, 2007 Satellite Remote Sensing Snow Cover Optical -- Snow
Global Flood Alert System based on satellite derived rainfall data -Targeting the era of Global Precipitation Measurement (GPM)-
-") Global Flood Alert System based on satellite derived rainfall data -Targeting the era of Global Precipitation Measurement (GPM)- Riko Oki, Misako Kachi (JAXA/EORC) Kazuhiko Fukami (PWRI) and Kazuo Umeda
Global Flood Alert System based on satellite derived rainfall data -Targeting the era of Global Precipitation Measurement (GPM)- Riko Oki, Misako Kachi (JAXA/EORC) Kazuhiko Fukami (PWRI) and Kazuo Umeda
Land Surface: Snow Emanuel Dutra
 Land Surface: Snow Emanuel Dutra emanuel.dutra@ecmwf.int Slide 1 Parameterizations training course 2015, Land-surface: Snow ECMWF Outline Snow in the climate system, an overview: Observations; Modeling;
Oregon Water Conditions Report April 17, 2017
 Oregon Water Conditions Report April 17, 2017 Mountain snowpack continues to maintain significant levels for mid-april. By late March, statewide snowpack had declined to 118 percent of normal after starting
Inter-linkage case study in Pakistan
 7 th GEOSS Asia Pacific Symposium GEOSS AWCI Parallel Session: 26-28 May, 2014, Tokyo, Japan Inter-linkage case study in Pakistan Snow and glaciermelt runoff modeling in Upper Indus Basin of Pakistan Maheswor
2016 HEPEX Workshop Université Laval, Quebec, Canada
 2016 HEPEX Workshop Université Laval, Quebec, Canada Evaluating the Usefulness of the US NWS Hydrologic Ensemble Forecast Service (HEFS) in the Middle Atlantic Region for Flood and Drought Applications
An Example of FFGS Implementation: Black Sea and Middle East FFG System. WMO; Name of Department (ND)
") An Example of FFGS Implementation: Black Sea and Middle East FFG System WMO; Name of Department (ND) Black Sea and Middle East FFGS 1 Flash Floods in Turkey Flood Frequencies: 80 60 40 20 0 Human and Economic
An Example of FFGS Implementation: Black Sea and Middle East FFG System WMO; Name of Department (ND) Black Sea and Middle East FFGS 1 Flash Floods in Turkey Flood Frequencies: 80 60 40 20 0 Human and Economic
Flash Flood Guidance System On-going Enhancements
 Flash Flood Guidance System On-going Enhancements Hydrologic Research Center, USA Technical Developer SAOFFG Steering Committee Meeting 1 10-12 July 2017 Jakarta, INDONESIA Theresa M. Modrick Hansen, PhD
Webinar and Weekly Summary February 15th, 2011
 Webinar and Weekly Summary February 15th, 2011 -Assessment of current water conditions - Precipitation Forecast - Recommendations for Drought Monitor Upper Colorado Normal Precipitation Upper Colorado
HyMet Company. Streamflow and Energy Generation Forecasting Model Columbia River Basin
 HyMet Company Streamflow and Energy Generation Forecasting Model Columbia River Basin HyMet Inc. Courthouse Square 19001 Vashon Hwy SW Suite 201 Vashon Island, WA 98070 Phone: 206-463-1610 Columbia River
2 nd Asia CryoNet Workshop Current methods of measurement of the cryosphere in Asia consistency and issues
 2 nd Asia CryoNet Workshop Current methods of measurement of the cryosphere in Asia consistency and issues Dongqi Zhang, Cunde Xiao, Vladimir Aizen and Wolfgang Schöner Feb.5, 2016, Salekhard, Russia 1.
A Preliminary Severe Winter Storms Climatology for Missouri from
 A Preliminary Severe Winter Storms Climatology for Missouri from 1960-2010 K.L. Crandall and P.S Market University of Missouri Department of Soil, Environmental and Atmospheric Sciences Introduction The
Upper Missouri River Basin December 2017 Calendar Year Runoff Forecast December 5, 2017
 Upper Missouri River Basin December 2017 Calendar Year Runoff Forecast December 5, 2017 Calendar Year Runoff Forecast Explanation and Purpose of Forecast U.S. Army Corps of Engineers, Northwestern Division
9. PROBABLE MAXIMUM PRECIPITATION AND PROBABLE MAXIMUM FLOOD
 9. PROBABLE MAXIMUM PRECIPITATION AND PROBABLE MAXIMUM FLOOD 9.1. Introduction Due to the size of Watana Dam and the economic importance of the Project to the Railbelt, the Probable Maximum Flood (PMF)
Quenching the Valley s thirst: The connection between Sierra Nevada snowpack & regional water supply
 Quenching the Valley s thirst: The connection between Sierra Nevada snowpack & regional water supply Roger Bales, UC Merced Snow conditions Snow & climate change Research directions Sierra Nevada snow
Bill Kappel. Doug Hultstrand. Applied Weather Associates
 Cool-Season PMP/PMF Meteorological Time Series for Snow Melt Calculations Bill Kappel Senior Meteorologist/Vice President Doug Hultstrand Hydrometeorologist Applied Weather Associates www.appliedweatherassociates.com
The Hydrologic Cycle: How Do River Forecast Centers Measure the Parts?
 The Hydrologic Cycle: How Do River Forecast Centers Measure the Parts? Greg Story Meteorologist National Weather Service Fort Worth, TX Overview n Introduction What is the mission of an RFC? n The Hydrologic
Real-Time Meteorological Gridded Data: What s New With HEC-RAS
 Real-Time Meteorological Gridded Data: What s New With HEC-RAS Acquisition and Application of Gridded Meteorological Data in Support of the USACE s Real-Time Water Management Mission Fauwaz Hanbali, Tom
Precipitation. Standardized Precipitation Index. NIDIS Intermountain West Regional Drought Early Warning System January 3, 2017
 1/3/2017 NIDIS Drought and Water Assessment NIDIS Intermountain West Regional Drought Early Warning System January 3, 2017 Precipitation The images above use daily precipitation statistics from NWS COOP,
Souris River Basin Spring Runoff Outlook As of March 15, 2018
 Souris River Basin Spring Runoff Outlook As of March 15, 2018 Prepared by: Flow Forecasting & Operations Planning Water Security Agency Basin Conditions Summer rainfall in 2017 in the Saskatchewan portion
Water information system advances American River basin. Roger Bales, Martha Conklin, Steve Glaser, Bob Rice & collaborators UC: SNRI & CITRIS
 Water information system advances American River basin Roger Bales, Martha Conklin, Steve Glaser, Bob Rice & collaborators UC: SNRI & CITRIS Opportunities Unprecedented level of information from low-cost
A Review of the 2007 Water Year in Colorado
 A Review of the 2007 Water Year in Colorado Nolan Doesken Colorado Climate Center, CSU Mike Gillespie Snow Survey Division, USDA, NRCS Presented at the 28 th Annual AGU Hydrology Days, March 26, 2008,
January 2011 Calendar Year Runoff Forecast
 January 2011 Calendar Year Runoff Forecast 2010 Runoff Year Calendar Year 2010 was the third highest year of runoff in the Missouri River Basin above Sioux City with 38.8 MAF, behind 1978 and 1997 which
2016 Fall Conditions Report
 2016 Fall Conditions Report Prepared by: Hydrologic Forecast Centre Date: December 13, 2016 Table of Contents TABLE OF FIGURES... ii EXECUTIVE SUMMARY... 1 BACKGROUND... 5 SUMMER AND FALL PRECIPITATION...
NIDIS Intermountain West Drought Early Warning System January 15, 2019
 NIDIS Drought and Water Assessment NIDIS Intermountain West Drought Early Warning System January 15, 2019 Precipitation The images above use daily precipitation statistics from NWS COOP, CoCoRaHS, and
BSYSE 456/556 Surface Hydrologic Processes and Modeling
 BSYSE 456/556 Surface Hydrologic Processes and Modeling Lab 9 (Prepared by Erin Brooks and Jan Boll, UI, and Joan Wu, WSU) P Introduction One of the most difficult tasks in watershed assessment and management
Drought Monitoring with Hydrological Modelling
 st Joint EARS/JRC International Drought Workshop, Ljubljana,.-5. September 009 Drought Monitoring with Hydrological Modelling Stefan Niemeyer IES - Institute for Environment and Sustainability Ispra -
NIDIS Intermountain West Drought Early Warning System February 12, 2019
 NIDIS Intermountain West Drought Early Warning System February 12, 2019 Precipitation The images above use daily precipitation statistics from NWS COOP, CoCoRaHS, and CoAgMet stations. From top to bottom,
Haiti and Dominican Republic Flash Flood Initial Planning Meeting
 Dr Rochelle Graham Climate Scientist Haiti and Dominican Republic Flash Flood Initial Planning Meeting September 7 th to 9 th, 2016 Hydrologic Research Center http://www.hrcwater.org Haiti and Dominican
Oregon Water Conditions Report May 1, 2017
 Oregon Water Conditions Report May 1, 2017 Mountain snowpack in the higher elevations has continued to increase over the last two weeks. Statewide, most low and mid elevation snow has melted so the basin
NIDIS Intermountain West Drought Early Warning System May 23, 2017
 NIDIS Drought and Water Assessment NIDIS Intermountain West Drought Early Warning System May 23, 2017 Precipitation The images above use daily precipitation statistics from NWS COOP, CoCoRaHS, and CoAgMet
Missouri River Basin Climate Outlook 1 May Dr. Dennis Todey State Climatologist South Dakota State Univ.
 Missouri River Basin Climate Outlook 1 May 2014 Dr. Dennis Todey State Climatologist South Dakota State Univ. dennis.todey@sdstate.edu 605-688-5141 Photo taken Feb 19, 2013 General Information Providing
ACCUMULATED PRECIPITATION IN INCHES
 CUMULATIVE PRECIPITATION WATER YEAR COLUMBIA BASIN ABOVE GRAND COULEE 84% of Normal 1971- Average ACCUMULATED PRECIPITATION IN INCHES 8 6 82% of Normal 85% of Normal 82% of Normal SNAKE RIVER BASIN ABOVE
Modelling snow accumulation and snow melt in a continuous hydrological model for real-time flood forecasting
 IOP Conference Series: Earth and Environmental Science Modelling snow accumulation and snow melt in a continuous hydrological model for real-time flood forecasting To cite this article: Ph Stanzel et al
SNOW AS POTENTIAL FLOOD THREAT
 SNOW AS POTENTIAL FLOOD THREAT DANIELA KYSELOVÁ, KATEŘINA HRUŠKOVÁ, ZORA SNOPKOVÁ Slovak hydrometeorological institute, Zelená 5, 974 04 Banská Bystrica, Slovakia In the physical-geographic conditions
Climatic and Ecological Conditions in the Klamath Basin of Southern Oregon and Northern California: Projections for the Future
 Climatic and Ecological Conditions in the Klamath Basin of Southern Oregon and Northern California: Projections for the Future A Collaborative Effort by: CLIMATE LEADERSHIP INITIATIVE INSTITUTE FOR A SUSTAINABLE
NIDIS Intermountain West Drought Early Warning System November 14, 2017
 NIDIS Intermountain West Drought Early Warning System November 14, 2017 Precipitation The images above use daily precipitation statistics from NWS COOP, CoCoRaHS, and CoAgMet stations. From top to bottom,
MINNESOTA POWER ST LOUIS RIVER PROJECT FERC 2360 ISLAND LAKE RESERVOIR TECHNICAL COMMITTEE MEETING SUMMARY
 5/14/18 Spring Refill Meeting held via email Late spring snowmelt resulted in late start to refill. Spring runoff was not enhanced by rain on snow on frozen ground. Near record dry spring. Refill will
Missouri River Basin Water Management Monthly Update
 Missouri River Basin Water Management Monthly Update Participating Agencies 255 255 255 237 237 237 0 0 0 217 217 217 163 163 163 200 200 200 131 132 122 239 65 53 80 119 27 National Oceanic and Atmospheric
Souris River Basin Spring Runoff Outlook As of March 1, 2019
 Souris River Basin Spring Runoff Outlook As of March 1, 2019 Prepared by: Flow Forecasting & Operations Planning Water Security Agency Basin Conditions Summer rainfall in 2018 over the Saskatchewan portion
Application of Satellite Data for Flood Forecasting and Early Warning in the Mekong River Basin in South-east Asia
 MEKONG RIVER COMMISSION Vientiane, Lao PDR Application of Satellite Data for Flood Forecasting and Early Warning in the Mekong River Basin in South-east Asia 4 th World Water Forum March 2006 Mexico City,
APPLICATIONS OF DOWNSCALING: HYDROLOGY AND WATER RESOURCES EXAMPLES
 APPLICATIONS OF DOWNSCALING: HYDROLOGY AND WATER RESOURCES EXAMPLES Dennis P. Lettenmaier Department of Civil and Environmental Engineering For presentation at Workshop on Regional Climate Research NCAR
NIDIS Intermountain West Drought Early Warning System March 26, 2019
 NIDIS Intermountain West Drought Early Warning System March 26, 2019 The images above use daily precipitation statistics from NWS COOP, CoCoRaHS, and CoAgMet stations. From top to bottom, and left to right:
NIDIS Intermountain West Drought Early Warning System December 11, 2018
 NIDIS Drought and Water Assessment NIDIS Intermountain West Drought Early Warning System December 11, 2018 Precipitation The images above use daily precipitation statistics from NWS COOP, CoCoRaHS, and
Snow Melt with the Land Climate Boundary Condition
 Snow Melt with the Land Climate Boundary Condition GEO-SLOPE International Ltd. www.geo-slope.com 1200, 700-6th Ave SW, Calgary, AB, Canada T2P 0T8 Main: +1 403 269 2002 Fax: +1 888 463 2239 Introduction
National Weather Service Flood Forecast Needs: Improved Rainfall Estimates
 National Weather Service Flood Forecast Needs: Improved Rainfall Estimates Weather Forecast Offices Cleveland and Northern Indiana Ohio River Forecast Center Presenter: Sarah Jamison, Service Hydrologist
Climate Change Impact Assessment on Indian Water Resources. Ashvin Gosain, Sandhya Rao, Debajit Basu Ray
 Climate Change Impact Assessment on Indian Water Resources Ashvin Gosain, Sandhya Rao, Debajit Basu Ray Objectives of the Study To quantify the impact of the climate change on the water resources of the
Changing Hydrology under a Changing Climate for a Coastal Plain Watershed
 Changing Hydrology under a Changing Climate for a Coastal Plain Watershed David Bosch USDA-ARS, Tifton, GA Jeff Arnold ARS Temple, TX and Peter Allen Baylor University, TX SEWRU Objectives 1. Project changes
Missouri River Basin Water Management
 Missouri River Basin Water Management US Army Corps of Engineers Missouri River Navigator s Meeting February 12, 2014 Bill Doan, P.E. Missouri River Basin Water Management US Army Corps of Engineers BUILDING
Studying snow cover in European Russia with the use of remote sensing methods
 40 Remote Sensing and GIS for Hydrology and Water Resources (IAHS Publ. 368, 2015) (Proceedings RSHS14 and ICGRHWE14, Guangzhou, China, August 2014). Studying snow cover in European Russia with the use
Forecast Challenges for the Colorado Basin River Forecast Center
 Forecast Challenges for the Colorado Basin River Forecast Center John Lhotak, Development and Operations Hydrologist Improving Sub-Seasonal to Seasonal (S2S) Workshop May 16th, 2018 1 River Forecast Centers
INCORPORATING MODIS LAND SURFACE TEMPERATURE IN AN OPERATIONAL SNOW ACCUMULATION AND ABLATION MODEL
 INCORPORATING MODIS LAND SURFACE TEMPERATURE IN AN OPERATIONAL SNOW ACCUMULATION AND ABLATION MODEL EYLON SHAMIR AND KONSTANTINE P. GEORGAKAKOS HRC TECHNICAL NOTE NO. 55 (Sponsored by NASA Grant No: NNX12AQ37G)
Validation of NOAA Interactive Snow Maps in the North American region with National Climatic Data Center Ground-based Data
 City University of New York (CUNY) CUNY Academic Works Master's Theses City College of New York 2011 Validation of NOAA Interactive Snow Maps in the North American region with National Climatic Data Center
NATIONAL HYDROPOWER ASSOCIATION MEETING. December 3, 2008 Birmingham Alabama. Roger McNeil Service Hydrologist NWS Birmingham Alabama
 NATIONAL HYDROPOWER ASSOCIATION MEETING December 3, 2008 Birmingham Alabama Roger McNeil Service Hydrologist NWS Birmingham Alabama There are three commonly described types of Drought: Meteorological drought
SEPTEMBER 2013 REVIEW
 Monthly Long Range Weather Commentary Issued: October 21, 2013 Steven A. Root, CCM, President/CEO sroot@weatherbank.com SEPTEMBER 2013 REVIEW Climate Highlights The Month in Review The average temperature
Existing NWS Flash Flood Guidance
 Introduction The Flash Flood Potential Index (FFPI) incorporates physiographic characteristics of an individual drainage basin to determine its hydrologic response. In flash flood situations, the hydrologic
Incorporation of SMOS Soil Moisture Data on Gridded Flash Flood Guidance for Arkansas Red River Basin
 Incorporation of SMOS Soil Moisture Data on Gridded Flash Flood Guidance for Arkansas Red River Basin Department of Civil and Environmental Engineering, The City College of New York, NOAA CREST Dugwon
Folsom Dam Water Control Manual Update
 Folsom Dam Water Control Manual Update Public Workshop April 3, 2014 Location: Sterling Hotel Ballroom 1300 H Street, Sacramento US Army Corps of Engineers BUILDING STRONG WELCOME & INTRODUCTIONS 2 BUILDING
Climatic Change Implications for Hydrologic Systems in the Sierra Nevada
 Climatic Change Implications for Hydrologic Systems in the Sierra Nevada Part Two: The HSPF Model: Basis For Watershed Yield Calculator Part two presents an an overview of why the hydrologic yield calculator
Mountain Snowpacks, Climate Change and the Silver Solution
 Mountain Snowpacks, Climate Change and the Silver Solution Climate Change Seminar Series University of Nevada Las Vegas 11 July 2012 Arlen Huggins Desert Research Institute Reno, Nevada Climate, snow and
Canadian Prairie Snow Cover Variability
 Canadian Prairie Snow Cover Variability Chris Derksen, Ross Brown, Murray MacKay, Anne Walker Climate Research Division Environment Canada Ongoing Activities: Snow Cover Variability and Links to Atmospheric