ENGRG Introduction to GIS
|
|
|
- Anthony Warren
- 5 years ago
- Views:
Transcription
1 ENGRG Introduction to GIS Michael Piasecki March 17, 2014 Lecture 08: Terrain Analysis

2 Outline: Terrain Analysis Earth Surface Representation Contour TIN Mass Points Digital Elevation Models Slope and Aspect Hydrology Analysis Flow direction Flow accumulation Watershed View sheds 3/17/2014 ENGRG Intro to GIS 2
3 The Big Picture: Raster Analysis Models Suitability modeling most spatial models involve finding optimum locations, such as finding the best location to build a new school, a landfill, or a resettlement site. Distance modeling what is the best path to build a highway between Gainesville and Jacksonville? Hydrologic modeling In which direction will the water flow? Surface modeling what is the pollution level for various locations in a county? 3/17/2014 ENGRG Intro to GIS 3
4 Representing Surfaces Surfaces involve a third elevation value (z) in addition to the x,y horizontal values Surfaces are complex to represent since there are an infinite number of potential points to model The basic data for terrain elevation are derived generally from one of three sources: digitized contours photogrammetric data capture (including aerial photography and digital satellite imagery); z surveying y x 3/17/2014 ENGRG Intro to GIS 4
5 Digital Representation of Terrain A digital representation of terrain is known as: Raster based Digital Elevation Model (DEM) or Digital Terrain Model (DTM) Regular spaced set of elevation points (z values) Vector based Triangulated Irregular Networks (TIN) Irregular triangles with elevations at the three corners Vector based contour lines Lines joining points of equal elevation, at a specified interval Massed points and breaklines Massed points: Any set of regular or irregularly spaced point elevations Breaklines: point elevations along a line of significant change in slope (valley floor, ridge crest) 3/17/2014 ENGRG Intro to GIS 5


6 Digital representation to Terrain 3/17/2014 ENGRG Intro to GIS 6

7 Contour (isolines) Lines Contour lines, or isolines connect points that have the same elevation Advantages Familiar to many people Easy to obtain mental picture of surface Close lines = steep slope Uphill V = stream Downhill V or bulge = ridge Circle = hill top or basin Disadvantages Poor for computer representation: no formal digital model Must convert to raster or TIN for analysis There is no information about how the terrain changes between lines 3/17/2014 ENGRG Intro to GIS 7
 Efficient since require few triangles in flat areas Easy")
8 Triangulated Irregular Network A set of adjacent, nonoverlapping triangles computed from irregularly spaced points, with x, y horizontal coordinates and z vertical elevations. The inclination of the terrain is assumed to be constant within each triangle Advantages Can capture significant slope features (ridges, etc) Efficient since require few triangles in flat areas Easy for certain analyses: slope, aspect, volume Disadvantages Analysis involving comparison with other layers difficult The coordinates of the vertices of each triangle are stored as well as its inclination and direction 3/17/2014 ENGRG Intro to GIS 8


9 Massed Points Clouds of points simply represent points where elevation data are known Can be as detailed as possible Lots of points in high variable areas Fewer points in homogeneous areas LIght Detection And Ranging - LIDAR 3/17/2014 ENGRG Intro to GIS 9
10 Digital Elevation Models (DEM) Any digital representation of a topographic surface (broad concept) Most often a raster or regular grid of spot heights Digital Terrain Model or DTM may actually be a more generic term for any digital representation of a topographic surface, but it is not so widely used; DTM and DEM is interchangeable terms Digital Surface Model or DSM include above ground features such as building and vegetation canopies. 3/17/2014 ENGRG Intro to GIS 10


11 Digital Elevation Model (DEM) Each cell stores the elevation value as an attribute two approaches for determining the surface z value of a location between sample points. In a lattice, each mesh point represents a value on the surface only at the center of the grid cell. The z value is approximated by interpolation between adjacent sample points; it does not imply an area of constant value. A surface grid considers each sample as a square cell with a constant surface value. Advantages Simple conceptual model Data cheap to obtain Easy to relate to other raster data Irregularly spaced set of points can be converted to regular spacing by interpolation Disadvantages Does not conform to variability of the terrain Linear features not well represented 3/17/2014 ENGRG Intro to GIS 11
12 Digital Elevation Models (DEM) Simplest form of digital representation of topography and the most common A variety of DEMs are available, including coverage of much of the US from the US Geological Survey (USGS) SRTM: Shuttle Radar Topography Mission DLG: Digital Linear Graph DRG: Digital Raster Graphic DTED: Digital Terrain Elevation Data ASTER: Advanced Spaceborne Thermal Emission and Reflection Radiometer Sensor 3/17/2014 ENGRG Intro to GIS 12
13 Common USGS DEM Data Sources Shuttle Radar Topography Mission (SRTM) (30m US wide) 1/3" (10m), National Elevation Dataset (NED) 1" (30m) DEMs from 1:24,000 scale map 3" (100m) DEMs from 1:250,000 scale maps 30" (1km) DEM of the earth (GTOPO30) 3/17/2014 ENGRG Intro to GIS 13

14 SRTM Shuttle Radar Topography Mission 1 arc second (30m) elevation data for the United States, 3 arc second (100m) data for the globe Produced by radar measurements from a Shuttle mission, Feb 11 22, ainingdata.html 3/17/2014 ENGRG Intro to GIS 14

15 SRTM Data Coverage Map 3/17/2014 ENGRG Intro to GIS 15

16 Santa Barbara, California 3/17/2014 ENGRG Intro to GIS 16

17 San Andreas Fault, California 3/17/2014 ENGRG Intro to GIS 17

18 Salt Lake City, Utah 3/17/2014 ENGRG Intro to GIS 18
19 Mt Kilimanjaro, Tanzania 3/17/2014 ENGRG Intro to GIS 19

20 GTOPO30 Source: 3/17/2014 ENGRG Intro to GIS 20

21 Seamless Data Distribution 3/17/2014 ENGRG Intro to GIS 21
22 Use of DEM Extracting terrain parameters Slope, aspect, spot elevations Source for contour lines Modeling water flow or mass movement (Watersheds, drainage networks, stream channels) Creation of relief maps Rendering of 3D visualizations. Terrain analyses in geomorphology and physical geography 3/17/2014 ENGRG Intro to GIS 22
23 Terrain Analysis: Slope Slope refers to the inclination of the terrain y Calculated as percentage or degrees. x Degrees Slope( ) tan 1 ( y x ) 45 Degree < > 100% Percentage y Slope(%) 100 x 3/17/2014 ENGRG Intro to GIS 23
24 Slope Direction Degrees Slope( ) tan Percentage 1 ( y x y Slope(%) 100 x ) But how to calculate it 3/17/2014 ENGRG Intro to GIS 24
25 Slope Calculation: 4 nearest cells Slope arctan dz dx 2 dz dy 2 3/17/2014 ENGRG Intro to GIS 25
26 Slope Calculation: using 4 nearest cells Do you remember Kernel? Set of constants; mathematical functions applied for every moving window location 3/17/2014 ENGRG Intro to GIS 26
27 Slope Calculation: 3 rd order finite difference 3/17/2014 ENGRG Intro to GIS 27
28 Terrain Analysis: Aspect Aspect has significant effects on vegetation on slopes. In the northern hemisphere, south facing slopes receive more sunlight and are drier than north facing slopes. South 225º North 3/17/2014 ENGRG Intro to GIS 28
29 Aspect Aspect: Direction that a surface faces Typically reported as an azimuth angle (measured in degrees from the north ) Used to: Determine Incident solar radiation Visibility 225º 29


30 3/17/2014 ENGRG Intro to GIS 30


31 Comparison of Shaded Relief Maps for 315º and 135º Sun Angles. Sun Azimuth = 315º; Elevation = 45º Sun Azimuth = 135º, Elev 45º 3/17/2014 ENGRG Intro to GIS 31
, Shadows cast by topographic features 3/17/2014 ENGRG 59910 Intro to GIS")
32 Solar Radiation Analysis Incoming solar radiation (insolation) Landscape scales Topography Elevation, Orientation (slope and aspect), Shadows cast by topographic features 3/17/2014 ENGRG Intro to GIS 32

33 Where should construct a Vineyard? 3/17/2014 ENGRG Intro to GIS 33
34 Hydrologic functions on DEMs Modeling the topographic form of a drainage basin Determining the drainage network and associated drainage divides Estimating slopes for understanding drainage patterns and processes 3/17/2014 ENGRG Intro to GIS 34

35 Understanding drainage systems Channel 3/17/2014 ENGRG Intro to GIS 35

36 Basic Workflow of Hydrologic Analysis 3/17/2014 ENGRG Intro to GIS 36


37 River Network & SubwaterSheds 3/17/2014 ENGRG Intro to GIS 37
38 Flow Direction Useful for finding drainage networks and drainage divides Direction is determined by the elevation of surrounding cells Direction of Steepest Descent Water can flow only into one cell Water is assumed to flow into one other cell, unless there is a sink GIS model assumes no sinks 3/17/2014 ENGRG Intro to GIS 38
39 A natural sink? Remove it By default, this sink is removed, whether or not it is real. 3/17/2014 ENGRG Intro to GIS 39
40 Flow direction in a DEM Flow directions for individual cells 3/17/2014 ENGRG Intro to GIS 40
41 Eight Direction Pour Point Model /17/2014 ENGRG Intro to GIS 41
42 Flow Direction Grid /17/2014 ENGRG Intro to GIS 42

43 Flow Direction Grid /17/2014 ENGRG Intro to GIS 43
44 Flow accumulation The number of cells, or area, which contribute to runoff of a given cell Accumulation, once it reaches a threshold appropriate to an region, forms a drainage channel Flow accumulation measures the area of a watershed that contributes runoff to a given cell 3/17/2014 ENGRG Intro to GIS 44

45 Flow accumulation as drainage network Drainage network as defined by cells above threshold value for region. 3/17/2014 ENGRG Intro to GIS 45
46 Finding watersheds Begin at a source cell in a flow direction database, which is derived from a DEM (not from the DEM itself) Find all cells that flow into the source cell Iteratively find all cells that flow into those cells All of these cells comprises the watershed The resulting watershed is generalized, based on the cell size of the DEM 3/17/2014 ENGRG Intro to GIS 46
 Watershed boundary (red) 3/17/2014 ENGRG 59910 Intro to")
47 Watersheds Once done manually Contour lines (brown) Drainage (blue) Watershed boundary (red) 3/17/2014 ENGRG Intro to GIS 47


48 Hydrology Extension in ArcGIS 3/17/2014 ENGRG Intro to GIS 48
49 Predictive Equations Runoff Availability Equation Can be used to predict the amount of water that will become runoff given a specific rainfall event For example, how much runoff can be expected if there is an inch of rain over a clay soil with dense vegetation Based on soil characteristics and land cover Q = (sqrt(p 0.2 * (1000/CN 10))) / (p * (1000/CN 10)) Where: Q = total water available for runoff p = precipitation CN = curve number 3/17/2014 ENGRG Intro to GIS 49
 Note: concrete has a CN value of nearly 100 3/17/2014 ENGRG 59910 Intro to GIS 50")
50 Runoff Availability Equation Equation based on the CN number CN number based on soil and land cover characteristics both easily available in raster or vector format for GIS CN values range from (like a percentage) Note: concrete has a CN value of nearly 100 3/17/2014 ENGRG Intro to GIS 50

51 Some Common Curve Numbers 3/17/2014 ENGRG Intro to GIS 51
52 Runoff Availability Flow Chart 3/17/2014 ENGRG Intro to GIS 52

53 Visibility What land is visible from the selected location? Forest lookout stations Wireless telephone base stations Microwave towers Highway advertisement pole 3/17/2014 ENGRG Intro to GIS 53
54 Viewsheds 3/17/2014 ENGRG Intro to GIS 54
55 Viewsheds 3/17/2014 ENGRG Intro to GIS 55

56 An example 3/17/2014 ENGRG Intro to GIS 56


57 Shaded Relief Shaded Relief combines patterns of shadow with map information to give a 3D effect 3D views are also used to calculate the visibility of a particular area: Viewshed Can a cell phone receive a call in a particular place? 3/17/2014 ENGRG Intro to GIS 57


58 Shaded Maps 3/17/2014 ENGRG Intro to GIS 58

59 Tools in ArcGIS Spatial Analyst ArcScene provides you a 3D GIS analyst extension Arc GIS allows you to take a digital elevation model and derive: Hillshade Aspect Slope Contours 3/17/2014 ENGRG Intro to GIS 59
ENGRG Introduction to GIS
 ENGRG 59910 Introduction to GIS Michael Piasecki November 17, 2017 Lecture 11: Terrain Analysis Outline: Terrain Analysis Earth Surface Representation Contour TIN Mass Points Digital Elevation Models Slope
Digital Elevation Models. Using elevation data in raster format in a GIS
 Digital Elevation Models Using elevation data in raster format in a GIS What is a Digital Elevation Model (DEM)? Digital representation of topography Model based on scale of original data Commonly a raster
Popular Mechanics, 1954
 Introduction to GIS Popular Mechanics, 1954 1986 $2,599 1 MB of RAM 2017, $750, 128 GB memory, 2 GB of RAM Computing power has increased exponentially over the past 30 years, Allowing the existence of
MODULE 7 LECTURE NOTES 5 DRAINAGE PATTERN AND CATCHMENT AREA DELINEATION
 MODULE 7 LECTURE NOTES 5 DRAINAGE PATTERN AND CATCHMENT AREA DELINEATION 1. Introduction Topography of the river basin plays an important role in hydrologic modelling, by providing information on different
Digital Elevation Models (DEM) / DTM
 / DTM") Digital Elevation Models (DEM) / DTM Uses in remote sensing: queries and analysis, 3D visualisation, classification input Fogo Island, Cape Verde Republic ASTER DEM / image Banks Peninsula, Christchurch,
Digital Elevation Models (DEM) / DTM Uses in remote sensing: queries and analysis, 3D visualisation, classification input Fogo Island, Cape Verde Republic ASTER DEM / image Banks Peninsula, Christchurch,
Creating Watersheds and Stream Networks. Steve Kopp
 Creating Watersheds and Stream Networks Steve Kopp Workshop Overview Demo Data Understanding the tools Elevation Data Types DEM : Digital Elevation Model bare Earth DSM : Digital Surface Model Data Structure
Spatial Analyst. By Sumita Rai
 ArcGIS Extentions Spatial Analyst By Sumita Rai Overview What does GIS do? How does GIS work data models Extension to GIS Spatial Analyst Spatial Analyst Tasks & Tools Surface Analysis Surface Creation
Digital Elevation Models (DEM)
") Digital Elevation Models (DEM) Digital representation of the terrain surface enable 2.5 / 3D views Rule #1: they are models, not reality Rule #2: they always include some errors (subject to scale and data
Digital Elevation Models (DEM) Digital representation of the terrain surface enable 2.5 / 3D views Rule #1: they are models, not reality Rule #2: they always include some errors (subject to scale and data
Using Earthscope and B4 LiDAR data to analyze Southern California s active faults
 Using Earthscope and B4 LiDAR data to analyze Southern California s active faults Exercise 8: Simple landscape morphometry and stream network delineation Introduction This exercise covers sample activities
Remote Sensing and GIS Applications for Hilly Watersheds SUBASHISA DUTTA DEPARTMENT OF CIVIL ENGINEERING IIT GUWAHATI
 Remote Sensing and GIS Applications for Hilly Watersheds SUBASHISA DUTTA DEPARTMENT OF CIVIL ENGINEERING IIT GUWAHATI Deciding Alternative Land Use Options in a Watershed Using GIS Source: Anita Prakash
Working with Digital Elevation Models and Digital Terrain Models in ArcMap 9
 Working with Digital Elevation Models and Digital Terrain Models in ArcMap 9 1 TABLE OF CONTENTS INTRODUCTION...3 WORKING WITH DIGITAL TERRAIN MODEL (DTM) DATA FROM NRVIS, CITY OF KITCHENER, AND CITY OF
Working with Digital Elevation Models in ArcGIS 8.3
 Working with Digital Elevation Models in ArcGIS 8.3 The homework that you need to turn in is found at the end of this document. This lab continues your introduction to using the Spatial Analyst Extension
Terrain and Watershed Analysis. James Frew ESM 263 Winter
 Terrain and Watershed Analysis 1 Digital ElevaBon Model (DEM) raster of elevabons 2 Slope magnitude of gradient tan(slope) = ( ( z/ x) 2 + ( z/ y) 2 ) 1/2 3 Aspect (aka Exposure) direc,on of gradient tan(aspect)
Digital Elevation Models (DEM) / DTM
 / DTM") Digital Elevation Models (DEM) / DTM Uses in remote sensing: queries and analysis, 3D visualisation, layers in classification Fogo Island, Cape Verde Republic ASTER DEM / image Banks Peninsula, Christchurch,
Digital Elevation Models (DEM) / DTM Uses in remote sensing: queries and analysis, 3D visualisation, layers in classification Fogo Island, Cape Verde Republic ASTER DEM / image Banks Peninsula, Christchurch,
Positional accuracy of the drainage networks extracted from ASTER and SRTM for the Gorongosa National Park region - Comparative analysis
 Positional accuracy of the drainage networks extracted from ASTER and SRTM for the Gorongosa National Park region - Comparative analysis Tiago CARMO 1, Cidália C. FONTE 1,2 1 Departamento de Matemática,
Introduction to GIS I
 Introduction to GIS Introduction How to answer geographical questions such as follows: What is the population of a particular city? What are the characteristics of the soils in a particular land parcel?
Governing Rules of Water Movement
 Governing Rules of Water Movement Like all physical processes, the flow of water always occurs across some form of energy gradient from high to low e.g., a topographic (slope) gradient from high to low
THE ROLE OF GEOCOMPUTATION IN THE HYDROLOGICAL SCIENCES
 INTERNATIONAL SYMPOSIUM ON GEOCOMPUTATION AND ANALYSIS THE ROLE OF GEOCOMPUTATION IN THE HYDROLOGICAL SCIENCES JOHN P. WILSON UNIVERSITY OF SOUTHERN CALIFORNIA GIS RESEARCH LABORATORY Outline Background
13 Watershed Delineation & Modeling
 Module 4 (L12 - L18): Watershed Modeling Standard modeling approaches and classifications, system concept for watershed modeling, overall description of different hydrologic processes, modeling of rainfall,
A GIS-based Approach to Watershed Analysis in Texas Author: Allison Guettner
 Texas A&M University Zachry Department of Civil Engineering CVEN 658 Civil Engineering Applications of GIS Instructor: Dr. Francisco Olivera A GIS-based Approach to Watershed Analysis in Texas Author:
RiparianZone = buffer( River, 100 Feet )
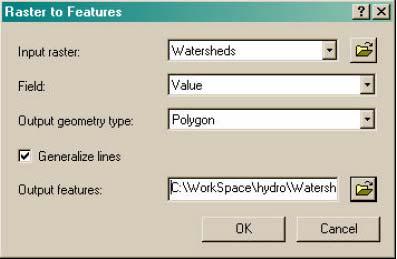
") GIS Analysts perform spatial analysis when they need to derive new data from existing data. In GIS I, for example, you used the vector approach to derive a riparian buffer feature (output polygon) around
GIS Analysts perform spatial analysis when they need to derive new data from existing data. In GIS I, for example, you used the vector approach to derive a riparian buffer feature (output polygon) around
GeoWEPP Tutorial Appendix
 GeoWEPP Tutorial Appendix Chris S. Renschler University at Buffalo - The State University of New York Department of Geography, 116 Wilkeson Quad Buffalo, New York 14261, USA Prepared for use at the WEPP/GeoWEPP
Basin characteristics
 Basin characteristics From hydrological processes at the point scale to hydrological processes throughout the space continuum: point scale à river basin The watershed characteristics (shape, length, topography,
Lecture 3. Data Sources for GIS in Water Resources
 Lecture 3 Data Sources for GIS in Water Resources GIS in Water Resources Spring 2015 http://www.data.gov/ 1 USGS GIS data for Water http://water.usgs.gov/maps.html Watersheds of the US 2-digit water resource
GRAPEVINE LAKE MODELING & WATERSHED CHARACTERISTICS
 GRAPEVINE LAKE MODELING & WATERSHED CHARACTERISTICS Photo Credit: Lake Grapevine Boat Ramps Nash Mock GIS in Water Resources Fall 2016 Table of Contents Figures and Tables... 2 Introduction... 3 Objectives...
What is GIS? Introduction to data. Introduction to data modeling
 What is GIS? Introduction to data Introduction to data modeling 2 A GIS is similar, layering mapped information in a computer to help us view our world as a system A Geographic Information System is a
Application of high-resolution (10 m) DEM on Flood Disaster in 3D-GIS
 DEM on Flood Disaster in 3D-GIS") Risk Analysis V: Simulation and Hazard Mitigation 263 Application of high-resolution (10 m) DEM on Flood Disaster in 3D-GIS M. Mori Department of Information and Computer Science, Kinki University, Japan
Risk Analysis V: Simulation and Hazard Mitigation 263 Application of high-resolution (10 m) DEM on Flood Disaster in 3D-GIS M. Mori Department of Information and Computer Science, Kinki University, Japan
ESRI GIS For Mining Seminar, 10 th August, 2016, Nairobi, Kenya. Spatial DATA Solutions for Mining
 ESRI GIS For Mining Seminar, 10 th August, 2016, Nairobi, Kenya Spatial DATA Solutions for Mining Spatial Data Solutions for Mining Spatial - Data that identifies the geographic location of features &
GIS feature extraction tools in diverse landscapes
 CE 394K.3 GIS in Water Resources GIS feature extraction tools in diverse landscapes Final Project Anna G. Kladzyk M.S. Candidate, Expected 2015 Department of Environmental and Water Resources Engineering
Crystal Moncada. California State University San Bernardino. January- July Brett R. Goforth- Department of Geography and Environmental Studies
 A Geographical Information System (GIS) Based Evaluation of Landslide Susceptibility Mapped on the Harrison Mountain Quadrangle of the Santa Ana River Watershed Crystal Moncada California State University
GIS Geographic Information System
 GIS Geographic Information System Andrea Petroselli Tuscia University, Italy petro@unitus.it SUMMARY Part 1: Part 2: Part 3: Part 4: What is a GIS? Why do we need a GIS? Which are the possibilities of
An Introduction to Geographic Information System
 An Introduction to Geographic Information System PROF. Dr. Yuji MURAYAMA Khun Kyaw Aung Hein 1 July 21,2010 GIS: A Formal Definition A system for capturing, storing, checking, Integrating, manipulating,
EMERGENCY PLANNING IN NORTHERN ALGERIA BASED ON REMOTE SENSING DATA IN RESPECT TO TSUNAMI HAZARD PREPAREDNESS
 EMERGENCY PLANNING IN NORTHERN ALGERIA BASED ON REMOTE SENSING DATA IN RESPECT TO TSUNAMI HAZARD PREPAREDNESS Barbara Theilen-Willige Technical University of Berlin, Institute of Applied Geosciences Department
MAPPING POTENTIAL LAND DEGRADATION IN BHUTAN
 MAPPING POTENTIAL LAND DEGRADATION IN BHUTAN Moe Myint, Geoinformatics Consultant Rue du Midi-8, CH-1196, Gland, Switzerland moemyint@bluewin.ch Pema Thinley, GIS Analyst Renewable Natural Resources Research
Erin Costello A comparison of Solar Radiation Modeling Tools
 Erin Costello A comparison of Solar Radiation Modeling Tools The Oregon Department of Environmental Quality uses effective shade as an indicator of water quality parameters as well as a target for restoration
GIS in Water Resources Midterm Exam Fall 2012 There are five questions on this exam. Please do all five.
 Page 1 of 6 Name: Key GIS in Water Resources Midterm Exam Fall 2012 There are five questions on this exam. Please do all five. Question 1 (a) You have worked with the location of Utah State University
Overview of Data for CREST Model
 Overview of Data for CREST Model Xianwu Xue April 2 nd 2012 CREST V2.0 CREST V2.0 Real-Time Mode Forcasting Mode Data Assimilation Precipitation PET DEM, FDR, FAC, Slope Observed Discharge a-priori parameter
How to Construct Urban Three Dimensional GIS Model based on ArcView 3D Analysis
 How to Construct Urban Three Dimensional GIS Model based on ArcView 3D Analysis Ko Ko Lwin Division of Spatial Information Science Graduate School of Life and Environmental Sciences University of Tsukuba
GIS in Water Resources Midterm Exam Fall 2008 There are 4 questions on this exam. Please do all 4.
 Page 1 of 8 Name: GIS in Water Resources Midterm Exam Fall 2008 There are 4 questions on this exam. Please do all 4. 1. Basic Concepts [20 points] Find the letter with the best answer for each term: 1.
Mapping Earth. Technology and Mapmaking
 CHAPTER 1 LESSON 2 Mapping Earth Technology and Mapmaking Key Concepts What can a topographic map tell you about the shape of Earth s surface? What can you learn from geologic maps about the rocks near
Chapter 02 Maps. Multiple Choice Questions
 Chapter 02 Maps Multiple Choice Questions 1. Every projection has some degree of distortion because A. a curved surface cannot be represented on a flat surface without distortion. B. parallels and meridians
GIS and Remote Sensing
 Spring School Land use and the vulnerability of socio-ecosystems to climate change: remote sensing and modelling techniques GIS and Remote Sensing Katerina Tzavella Project Researcher PhD candidate Technology
Determining the Location of the Simav Fault
 Lindsey German May 3, 2012 Determining the Location of the Simav Fault 1. Introduction and Problem Formulation: The issue I will be focusing on involves interpreting the location of the Simav fault in
4. GIS Implementation of the TxDOT Hydrology Extensions
 4. GIS Implementation of the TxDOT Hydrology Extensions A Geographic Information System (GIS) is a computer-assisted system for the capture, storage, retrieval, analysis and display of spatial data. It
![)UDQFR54XHQWLQ(DQG'tD]'HOJDGR&](/thumbs/95/125846872.jpg ")UDQFR54XHQWLQ(DQG'tD]'HOJDGR&") &21&(37,21$1',03/(0(17$7,212)$1+
&21&(37,21$1',03/(0(17$7,212)$1+ Working with Digital Elevation Models and Spot Heights in ArcMap
 Working with Digital Elevation Models and Spot Heights in ArcMap 10.3.1 1 TABLE OF CONTENTS INTRODUCTION... 3 WORKING WITH SPOT HEIGHTS FROM NRVIS, CITY OF KITCHENER, AND CITY OF TORONTO...4 WORKING WITH
Rapid Flood Mapping Using Inundation Libraries
 Rapid Flood Mapping Using Inundation Libraries Jude Kastens, Kevin Dobbs, James Halgren, Katherine Balster 2017 ASFPM Conference May 3, 2017 5 mi Kansas River Valley between Manhattan and Topeka Email:
Hydrologic Engineering Applications of Geographic Information Systems
 Hydrologic Engineering Applications of Geographic Information Systems Davis, California Objectives: The participant will acquire practical knowledge and skills in the application of GIS technologies for
Ramani Geosystems. Putting Africa On The Map. Authorized Resellers
 Ramani Geosystems Putting Africa On The Map Authorized Resellers Ramani Profile Started in 1999 Aerial, Land Surveying & Mapping Solutions + 10 Countries in the region + 80 Staff working in projects Asset
USING 3D GIS TO ASSESS ENVIRONMENTAL FLOOD HAZARDS IN MINA
 King Fahd University of Petroleum & Minerals College of Environmental Design Geographical Information system USING 3D GIS TO ASSESS ENVIRONMENTAL FLOOD HAZARDS IN MINA Prepared by : Ali AL-Zahrani OUTLINE
SPOT DEM Product Description
 SPOT DEM Product Description Version 1.1 - May 1 st, 2004 This edition supersedes previous versions Acronyms DIMAP DTED DXF HRS JPEG, JPG DEM SRTM SVG Tiff - GeoTiff XML Digital Image MAP encapsulation
AN EVALUATION ON THE DATA QUALITY OF SRTM DEM AT THE ALPINE AND PLATEAU AREA, NORTH-WESTERN OF CHINA
 AN EVALUATION ON THE DATA QUALITY OF SRTM DEM AT THE ALPINE AND PLATEAU AREA, NORTH-WESTERN OF CHINA Y. Liu School of Earth and Environmental Sciences, Lanzhou University, Lanzhou, 730000 -liuy@lzu.edu.cn
PROANA A USEFUL SOFTWARE FOR TERRAIN ANALYSIS AND GEOENVIRONMENTAL APPLICATIONS STUDY CASE ON THE GEODYNAMIC EVOLUTION OF ARGOLIS PENINSULA, GREECE.
 PROANA A USEFUL SOFTWARE FOR TERRAIN ANALYSIS AND GEOENVIRONMENTAL APPLICATIONS STUDY CASE ON THE GEODYNAMIC EVOLUTION OF ARGOLIS PENINSULA, GREECE. Spyridoula Vassilopoulou * Institute of Cartography
Mapping Earth. How are Earth s surface features measured and modeled?
 Name Mapping Earth How are Earth s surface features measured and modeled? Before You Read Before you read the chapter, think about what you know about maps Record your thoughts in the first column Pair
Evaluation of gvsig and SEXTANTE Tools for Hydrological Analysis Schröder Dietrich a, Mudogah Hildah b and Franz David b
 Evaluation of gvsig and SEXTANTE Tools for Hydrological Analysis Schröder Dietrich a, Mudogah Hildah b and Franz David b ab Photogrammetry and Geo-informatics Masters Programme, Stuttgart University of
LiDAR APPLICATIONS REMS6090. Assignment 2 HYDROLOGICAL APPLICATIONS of LiDAR DATA Due Date April 8, Venessa Bennett W
 LiDAR APPLICATIONS REMS6090 Assignment 2 HYDROLOGICAL APPLICATIONS of LiDAR DATA Due Date April 8, 2015 Venessa Bennett W0279429 1.0 Introduction High accuracy Digital Elevation Models (DEM) derived from
Waterborne Environmental, Inc., Leesburg, VA, USA 2. Syngenta Crop Protection, LLC, North America 3. Syngenta Crop Protection, Int.
 Application of High Resolution Elevation Data (LiDAR) to Assess Natural and Anthropogenic Agricultural Features Affecting the Transport of Pesticides at Multiple Spatial Scales Josh Amos 1, Chris Holmes
!" &#'(&) %*!+,*" -./0"1$ 1% % % - % 8 99:; < % % % % = 1. % % 2 /0 2 8 $ ' 99!; & %% % 2,A 1% %,1 % % % 2 3 %3 % / % / "1 % ; /0 % 2% % % %36
 %*!+,* -./01$ 1% % % - % 8 99:; < % % % % = 1. % % 2 /0 2 8 $ ' 99!; & %% % 2,A 1% %,1 % % % 2 3 %3 % / % / 1 % ; /0 % 2% % % %36") !" #$ &#'(&) *!+,*" - /0"1$ 1 1/0/// 0/02 /04"1 /0//,1$ 5/ - ( 6/027/ ///0 (/0// // - /002220(2 8 99:; < (/ = 1 2 /0$17899; 2 /0 2 8 $ 99?6 @ ' 99!; & 2,A 1,1 2 / / "1 -,14/02- ; /0 2 6,; B,1$ 2"1/0
!" #$ &#'(&) *!+,*" - /0"1$ 1 1/0/// 0/02 /04"1 /0//,1$ 5/ - ( 6/027/ ///0 (/0// // - /002220(2 8 99:; < (/ = 1 2 /0$17899; 2 /0 2 8 $ 99?6 @ ' 99!; & 2,A 1,1 2 / / "1 -,14/02- ; /0 2 6,; B,1$ 2"1/0
Terrain and Satellite Imagery in Madre de Dios, Peru
 Rhett Butler/mongabay.com Terrain and Satellite Imagery in Madre de Dios, Peru Katherine Lininger CE 394 GIS for Water Resources Term Paper December 1, 2011 Introduction Informal and small-scale gold mining
Sediment yield estimation from a hydrographic survey: A case study for the Kremasta reservoir, Western Greece
 Sediment yield estimation from a hydrographic survey: A case study for the Kremasta reservoir, Western Greece 5 th International Conference Water Resources Management in the Era of Transition,, Athens,
Topographic Maps and Landforms Geology Lab
 Topographic Maps and Landforms Geology Lab Ray Rector: Instructor Today s Lab Activities 1) Discussion of Last Week s Lab 2) Lecture on Topo Maps and Elevation Contours 3) Construct Topographic Maps and
HYDROLOGIC AND WATER RESOURCES EVALUATIONS FOR SG. LUI WATERSHED
 HYDROLOGIC AND WATER RESOURCES EVALUATIONS FOR SG. LUI WATERSHED 1.0 Introduction The Sg. Lui watershed is the upper part of Langat River Basin, in the state of Selangor which located approximately 20
Object Based Imagery Exploration with. Outline
 Object Based Imagery Exploration with Dan Craver Portland State University June 11, 2007 Outline Overview Getting Started Processing and Derivatives Object-oriented classification Literature review Demo
Watershed Delineation
 Watershed Delineation Jessica L. Watkins, University of Georgia 2 April 2009 Updated by KC Love February 25, 2011 PURPOSE For this project, I delineated watersheds for the Coweeta synoptic sampling area
Spatial Analysis II. Spatial data analysis Spatial analysis and inference
 Spatial Analysis II Spatial data analysis Spatial analysis and inference Roadmap Spatial Analysis I Outline: What is spatial analysis? Spatial Joins Step 1: Analysis of attributes Step 2: Preparing for
Accuracy Assessment of SRTM Data Case Study: New Cairo, Hurghada and Toshka in Egypt
 Australian Journal of Basic and Applied Sciences, 4(12): 6269-6275, 2010 ISSN 1991-8178 Accuracy Assessment of SRTM Data Case Study: New Cairo, Hurghada and Toshka in Egypt 1 Assoc. Prof. Dr. A.K. Abdel-Gawad,
Introduction to Geographic Information Systems (GIS): Environmental Science Focus
: Environmental Science Focus") Introduction to Geographic Information Systems (GIS): Environmental Science Focus September 9, 2013 We will begin at 9:10 AM. Login info: Username:!cnrguest Password: gocal_bears Instructor: Domain: CAMPUS
Introduction to Geographic Information Systems (GIS): Environmental Science Focus September 9, 2013 We will begin at 9:10 AM. Login info: Username:!cnrguest Password: gocal_bears Instructor: Domain: CAMPUS
AN ENHANCED GLOBAL ELEVATION MODEL GENERALIZED FROM MULTIPLE HIGHER RESOLUTION SOURCE DATASETS
 AN ENHANCED GLOBAL ELEVATION MODEL GENERALIZED FROM MULTIPLE HIGHER RESOLUTION SOURCE DATASETS Jeffrey J. Danielson *, Dean B. Gesch U.S. Geological Survey, Earth Resources Observation and Science Center,
Application of Geographical Information System (GIS) tools in watershed analysis
 tools in watershed analysis") Application of Geographical Information System (GIS) tools in watershed analysis Paritosh Gupta 1, Damanjit S Minhas 2, Rajendra M Tamhane 1, A K Mookerjee 2 1.ESRI India New Delhi 2. LEA Associates South
Application of Geographical Information System (GIS) tools in watershed analysis Paritosh Gupta 1, Damanjit S Minhas 2, Rajendra M Tamhane 1, A K Mookerjee 2 1.ESRI India New Delhi 2. LEA Associates South
Fugro Geospatial: Turning Spatial Data into Knowledge
 Fugro Geospatial: Turning Spatial Data into Knowledge 2016 Fugro Geospatial, GIS and Consultants Locations Variety of Collection Platforms Traditional Mapping Traditional Mapping Imagery Photogrammetric
ACCURACY ASSESSMENT OF ASTER GLOBAL DEM OVER TURKEY
 ACCURACY ASSESSMENT OF ASTER GLOBAL DEM OVER TURKEY E. Sertel a a ITU, Civil Engineering Faculty, Geomatic Engineering Department, 34469 Maslak Istanbul, Turkey sertele@itu.edu.tr Commission IV, WG IV/6
Using ArcGIS for Hydrology and Watershed Analysis:
 Using ArcGIS 10.2.2 for Hydrology and Watershed Analysis: A guide for running hydrologic analysis using elevation and a suite of ArcGIS tools Anna Nakae Feb. 10, 2015 Introduction Hydrology and watershed
INTERNATIONAL JOURNAL OF GEOMATICS AND GEOSCIENCES Volume 1, No 4, 2011
 Detection of seafloor channels using Bathymetry data in Geographical Information Systems Kundu.S.N, Pattnaik.D.S Department of Geology, Utkal University, Vanivihar, Bhubaneswar. Orissa. snkundu@gmail.com
1 Introduction: 2 Data Processing:
 Darren Janzen University of Northern British Columbia Student Number 230001222 Major: Forestry Minor: GIS/Remote Sensing Produced for: Geography 413 (Advanced GIS) Fall Semester Creation Date: November
DAMAGE DETECTION OF THE 2008 SICHUAN, CHINA EARTHQUAKE FROM ALOS OPTICAL IMAGES
 DAMAGE DETECTION OF THE 2008 SICHUAN, CHINA EARTHQUAKE FROM ALOS OPTICAL IMAGES Wen Liu, Fumio Yamazaki Department of Urban Environment Systems, Graduate School of Engineering, Chiba University, 1-33,
Outcrop suitability analysis of blueschists within the Dry Lakes region of the Condrey Mountain Window, North-central Klamaths, Northern California
 Outcrop suitability analysis of blueschists within the Dry Lakes region of the Condrey Mountain Window, North-central Klamaths, Northern California (1) Introduction: This project proposes to assess the
Floodplain modeling. Ovidius University of Constanta (P4) Romania & Technological Educational Institute of Serres, Greece
 Romania & Technological Educational Institute of Serres, Greece") Floodplain modeling Ovidius University of Constanta (P4) Romania & Technological Educational Institute of Serres, Greece Scientific Staff: Dr Carmen Maftei, Professor, Civil Engineering Dept. Dr Konstantinos
Floodplain modeling Ovidius University of Constanta (P4) Romania & Technological Educational Institute of Serres, Greece Scientific Staff: Dr Carmen Maftei, Professor, Civil Engineering Dept. Dr Konstantinos
The National Hydrography Dataset in the Pacific Region. U.S. Department of the Interior U.S. Geological Survey
 The National Hydrography Dataset in the Pacific Region U.S. Department of the Interior U.S. Geological Survey The National Map The National Map is built on partnerships and standards The National Map consists
EnvSci 360 Computer and Analytical Cartography
 EnvSci 360 Computer and Analytical Cartography Lecture 7 Mapping Images, Surfaces, and 3-D Data Brief Overview of Imagery What is Imagery? A spatial data model that defines space as an array of equally
Evaluation of gvsig and SEXTANTE Tools for Hydrological Analysis
 Evaluation of gvsig and SEXTANTE Tools for Hydrological Analysis 6th gvsig Conference, Valencia, SPAIN Prof. Dr-Ing Dietrich Schrödera Mudogah Hildahb and Franz Davidb Stuttgart University of Applied Sciences
A Temporal Hydrologic Database for Rapidly Changing Landscapes
 A Temporal Hydrologic Database for Rapidly Changing Landscapes Using Mt. St. Helens in Washington as a Pilot Site Adam Mosbrucker Geog 575 BACKGROUND: Client / User U.S. Geological Survey Cascades Volcano
Comparison of Intermap 5 m DTM with SRTM 1 second DEM. Jenet Austin and John Gallant. May Report to the Murray Darling Basin Authority
 Comparison of Intermap 5 m DTM with SRTM 1 second DEM Jenet Austin and John Gallant May 2010 Report to the Murray Darling Basin Authority Water for a Healthy Country Flagship Report series ISSN: 1835-095X
STUDY IN SURFACE AND HYDROLOGICAL ANALYSIS FOR THERTHAR LAKE AND SURROUNDING AREAS BY GEOGRAPHIC INFORMATION SYSTEM (GIS)
") I.J.S.N., VOL.9 (1) 2018: 5-10 ISSN 2229 6441 STUDY IN SURFACE AND HYDROLOGICAL ANALYSIS FOR THERTHAR LAKE AND SURROUNDING AREAS BY GEOGRAPHIC INFORMATION SYSTEM (GIS) Shahad Yaseen Hamza & Ban Abd.Al-Razak
I.J.S.N., VOL.9 (1) 2018: 5-10 ISSN 2229 6441 STUDY IN SURFACE AND HYDROLOGICAL ANALYSIS FOR THERTHAR LAKE AND SURROUNDING AREAS BY GEOGRAPHIC INFORMATION SYSTEM (GIS) Shahad Yaseen Hamza & Ban Abd.Al-Razak
DOWNLOAD PDF THE GEOGRAPHICAL INTERPRETATION OF TOPOGRAPHICAL MAPS.
 Chapter 1 : Topography - Wikipedia â Topographical maps are large-scale maps, they show a great deal of details about the relief. â In Topographical survey, actual survey is carried out and different methods
Introduction-Overview. Why use a GIS? What can a GIS do? Spatial (coordinate) data model Relational (tabular) data model
 data model Relational (tabular) data model") Introduction-Overview Why use a GIS? What can a GIS do? How does a GIS work? GIS definitions Spatial (coordinate) data model Relational (tabular) data model intro_gis.ppt 1 Why use a GIS? An extension
Introduction-Overview Why use a GIS? What can a GIS do? How does a GIS work? GIS definitions Spatial (coordinate) data model Relational (tabular) data model intro_gis.ppt 1 Why use a GIS? An extension
Use of Thematic Mapper Satellite Imagery, Hemispherical Canopy Photography, and Digital Stream Lines to Predict Stream Shading
 Use of Thematic Mapper Satellite Imagery, Hemispherical Canopy Photography, and Digital Stream Lines to Predict Stream Shading David Nagel GIS Analyst Charlie Luce Research Hydrologist Bárbara Gutiérrez
ISU GIS CENTER S ARCSDE USER'S GUIDE AND DATA CATALOG
 ISU GIS CENTER S ARCSDE USER'S GUIDE AND DATA CATALOG 2 TABLE OF CONTENTS 1) INTRODUCTION TO ARCSDE............. 3 2) CONNECTING TO ARCSDE.............. 5 3) ARCSDE LAYERS...................... 9 4) LAYER
Dr. S.SURIYA. Assistant professor. Department of Civil Engineering. B. S. Abdur Rahman University. Chennai
 Hydrograph simulation for a rural watershed using SCS curve number and Geographic Information System Dr. S.SURIYA Assistant professor Department of Civil Engineering B. S. Abdur Rahman University Chennai
RAL Advances in Land Surface Modeling Part I. Andrea Hahmann
 RAL Advances in Land Surface Modeling Part I Andrea Hahmann Outline The ATEC real-time high-resolution land data assimilation (HRLDAS) system - Fei Chen, Kevin Manning, and Yubao Liu (RAL) The fine-mesh
It s a Model. Quantifying uncertainty in elevation models using kriging
 It s a Model Quantifying uncertainty in elevation models using kriging By Konstantin Krivoruchko and Kevin Butler, Esri Raster based digital elevation models (DEM) are the basis of some of the most important
Tracy Fuller U. S. Geological Survey. February 24, 2016
 U. S. Geological Survey Arctic Elevation Data Involvement Statewide Alaska IfSAR Radar Collection Program Pan-Arctic Digital Elevation Map International Coordination Tracy Fuller U. S. Geological Survey
Watershed Modeling With DEMs
 Watershed Modeling With DEMs Lesson 6 6-1 Objectives Use DEMs for watershed delineation. Explain the relationship between DEMs and feature objects. Use WMS to compute geometric basin data from a delineated
Terms GIS GPS Vector Data Model Raster Data Model Feature Attribute Table Point Line Polygon Pixel RGB Overlay Function
 FINAL REVIEW FOR GIS (2016) PRACTICAL COMPONENT The first 40 mins of the exam will be open book and will require you to make a map using all the techniques learned over the semester. This map will be e-mailed
GIS APPLICATIONS IN SOIL SURVEY UPDATES
 GIS APPLICATIONS IN SOIL SURVEY UPDATES ABSTRACT Recent computer hardware and GIS software developments provide new methods that can be used to update existing digital soil surveys. Multi-perspective visualization
RADAR Remote Sensing Application Examples
 RADAR Remote Sensing Application Examples! All-weather capability: Microwave penetrates clouds! Construction of short-interval time series through cloud cover - crop-growth cycle! Roughness - Land cover,
What s New in Topographic Information - USGS National Map
 + What s New in Topographic Information - USGS National Map SARGIS Workshop November 14, 2016 Rob Dollison, 703-648-5724 rdollison@usgs.gov + USGS 2 National Geospatial Program The National Geospatial
GIS Techniques for Floodplain Delineation. Dean Djokic
 GIS Techniques for Floodplain Delineation Dean Djokic (ddjokic@esri.com) Content What is a floodplain? How to get a floodplain? What can GIS do for floodplain modeling? Simple GIS techniques for floodplain
Digital Elevation Model
 Digital Elevation Model DEM, DSM, DTM? DSM: digital surface model. Height of the earth s surface, including houses, trees, boulders...etc. DTM: digital terrain model. Bare-earth earth surface model. Filtered
B. Topographic maps are also called. contour maps
 Topographic Maps Introduction A. Topographic maps are essential tools in geologic and engineering studies because they show the configuration of Earth's surface in remarkable detail and permit one to measure
Recent Advances in Continuum Mechanics, Hydrology and Ecology
 Effect of DEM Type and Resolution in Extraction of Hydro- Geomorphologic Parameters Vahid Nourani 1, Safa Mokhtarian Asl 2 and Maryam Khosravi Sorkhkolaee 3, Elnaz Sharghi 4 1 Associate Prof., 2,3 M.Sc.