Sample Density Analysis and Optimization Strategies for NOAA s Airborne Snow Water Equivalent Surveys
|
|
|
- Alicia Morrison
- 5 years ago
- Views:
Transcription


1 Sample Density Analysis and Optimization Strategies for NOAA s Airborne Snow Water Equivalent Surveys Patrick Didier Penn State MGIS Program Advisor: Dr Justine Blanford
2 Overview Introduction to the Snow Survey Program Goals of Capstone Project Data and Methods Results Recommendations

3 Why Snow Matters Percentage of average annual snowfall divided by annual runoff. (Barnett 2005)

4 Water Supply

5 Winter Tourism


6 Flooding

7 NOAA s Airborne Snow Survey
8 History Started in late 1970s by Dr Tom Carroll Originally limited to Upper Midwest Expanded in 1980s to mountainous areas Now includes over 2600 flight lines in over 35 states and Canadian provinces Supports NOAA offices, as well as collaboration with NASA, USACE, and regional water managers.

9 Natural Background Radiation signal present in soil is attenuated by water Using an aircraft-mounted gamma radiation spectrometer can measure this radiation signal Software in the aircraft compares snow-covered radiation signal against bare ground signal in order to compute snow-water equivalent Values represent mean areal snowwater equivalent for a given flightline
10 Atmospheric Radon no snow Cosmic Radiation Potassium, Uranium, and Thorium


11 Atmospheric Radon Cosmic Radiation Snow, Ice, or Water Potassium, Uranium, and Thorium

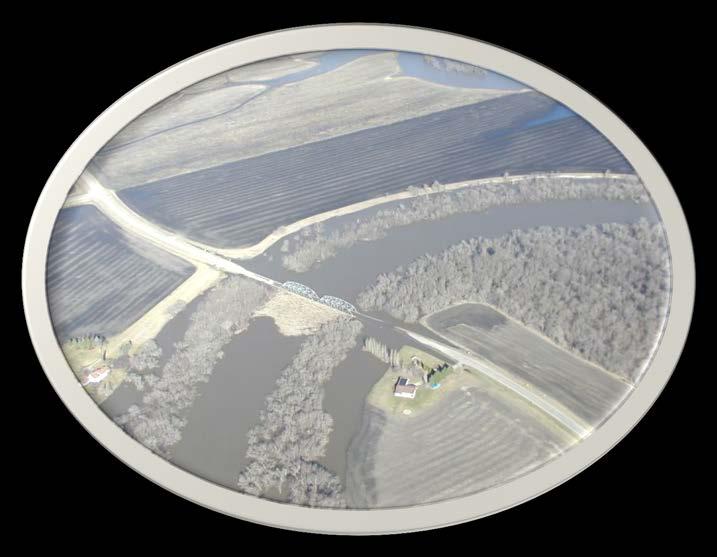
12 Designed to allow for continuous data for approximately 5 minutes to account for spatial variability of snow-water equivalent Swath of sensor at 500 above ground is ~1000 Line represents surface area of roughly 2.5 square miles.


13 Background data for line includes normalized count rates for potassium, thorium, and total counts Also includes background soil moisture information used for snow-water equivalent calculation

14
15 Processing occurs realtime in the aircraft. Data are sent to NWC on a daily basis for quality control Published to the web in a SHEF format.


16 Each line represents mean areal snow-water equivalent Midpoint of line used for spatial analysis Values used to create SWE surface grids
17 Measurements accurate to within 1 cm of SWE or 5% soil moisture Accuracy varies based on overall background and environment Can measure up to 39 inches of SWE, depending on total amount of background radiation

18 ? River Forecast Center (RFC) will make request for an airborne survey Some forecasters will make requests for specific flight lines, basins, or general areas Some surveys are canned surveys that are flown every year

19 Using Arc Tools, the Principal Investigator at the Office of Water Prediction (Chanhassen) will create a text file of the lines to be flown based on the RFC request and the available lines in the area This text file is then sent to the pilots
20 ? Pilots at NOAA s Aircraft Operations Center create survey files from text file Survey files include maps, survey shapefiles and pointfiles to be used for navigation

21 Limitations Daylight Weather Maintenance Crew Duty Logistics

22 * Total Sensor Packages: 3


23 * Calibrated Aircraft: 3 1 AC-695 JetProp Commander 2 DHC-6 Twin Otters


24 * Trained Mission Commanders:8
25 * *Rigorous Analysis of Survey Efficiency * Investigate whether some lines can be skipped due to high degree of spatial autocorrelation * Determine whether interpolation methods can yield satisfactorily low sample errors in interpolated values *Reduce Overall Survey Effort * Fuel savings * Increased safety due to less time an low altitude *Increase Overall Survey Value * Increase areal survey footprint without a corresponding decrease in accuracy * Reduce extraneous effort in areas where it is unneccesary
26 DATA AND METHODS Available Data Suitability Analysis Sample Optimization Data Interpolation Application

27 AVAILABLE DATA v/snowsurvey/historical.ht ml Contains 36 years of snow and soil moisture data Data compiled into one spreadsheet containing records for every flight line flown (over 25,000 records)


28 THE FLIGHT LINE DATABASE: 2016 Over 2600 Flight Lines in more than 40 states and provinces


 Low")
29 SUITABILITY ANALYSIS Looking for surveys with potential for over-sampling (lots of lines) Limited temporal variation (flown in a single day) Limited geographic extent (lines clustered) Low variability of terrain (flat)

30 SUITABILITY ANALYSIS Surveys grouped into single days Total line counts for days charted. Found instance of a single day in Upper Red River with 84 lines

31 NATIONAL SNOW ANALYSIS: GAMMA SWE IMAGE APRIL 2, 2009
32 Optimized Sampling and Error Assessment Decrease sample number using one of following methods: Random and Density-Dependent Focused and Subjective Reduce samples by 5, 10, and 25 percent for each method Create new interpolated surface using remaining sample points Extract values from new surfaces and apply them to removed samples Calculate sample error for interpolated points
33 SAMPLE OPTIMIZATION METHODS: RANDOM Used random fucntion in excel Sorted by random score and eliminated based on random number field Reduced to 95, 90, and 75 percent levels
34 SAMPLE OPTIMIZATION METHODS: DENSITY DEPENDENT Used Kernel Density Tool in ArcMap Eliminated lines with highest density values Same total samples as done on random optimization method
35 SAMPLE OPTIMIZATION METHODS: FOCUSED Used Anselin Cluster Analyis Tool in ArcMap Eliminated lines with highest cluster scores (Moran s I and significant p-value) Like density optimization, process had to be iterative
36 SAMPLE OPTIMIZATION METHODS: SUBJECTIVE Similar in theory to the focused optimization Basically removed values that felt the most similar
37 Optimization/Interpolation/Error Analysis: Step 1: Add Survey Data to ArcMap
38 Optimization/Interpolation/Error Analysis: Step 2: Export Lines to be Removed as a Separate Shapefile
39 Optimization/Interpolation/Error Analysis: Step 3: Switch Selection and Export Remaing Lines as Separate Shapefile

40 Optimization/Interpolation/Error Analysis: Step 4: Create Interpolated Surface Using Remaining Lines

41 Optimization/Interpolation/Error Analysis: Step 5: Extract Values from Interpolation Surface to Removed Lines

42 Optimization/Interpolation/Error Analysis: Step 6: Calculate Sample Error By Comparing Measured Values Against Interpolated Values (Excel)
43 ACCEPTABLE ERROR Error for interpolation will depend on spatial variability of the snowpack Instrument error: ~1 cm Interpolation error should be no more than instrument error
44 RESULTS SURVEY Date OPTIMIZATION PERCENTAGE SAMPLES INTERPOLATION SAMPLE ERROR (cm) 4/2/2009 N/A n/a n/a 4/2/2009 RANDOM IDW /2/2009 RANDOM Krig /2/2009 RANDOM IDW /2/2009 RANDOM Krig /2/2009 RANDOM IDW /2/2009 RANDOM Krig /2/2009 Density IDW /2/2009 Density Krig /2/2009 Density IDW /2/2009 Density Krig /2/2009 Density IDW /2/2009 DENSITY Krig 1.23
45 RESULTS SURVEY Date OPTIMIZATION PERCENTAGE SAMPLES INTERPOLATION SAMPLE ERROR (cm) 4/2/2009 Focused IDW /2/2009 Focused Krig /2/2009 Focused IDW /2/2009 Focused Krig /2/2009 Focused IDW /2/2009 Focused Krig /2/2009 Visual IDW /2/2009 Visual Krig /2/2009 Visual IDW /2/2009 Visual Krig /2/2009 Visual IDW /2/2009 Visual Krig 0.86
46 ERRORS Overall sample error impacted by handful of outliers that were well outside of 1 cm tolerance Line deltacm MN ND ND MN ND ND ND ND ND ND ND ND ND MN ND
47 TESTING METHOD FOR ANOTHER DATE Using a density-dependent reduction on a similar survey from 1994 yielded sample errors in excess of 4 cm SWE, which would be well outside of acceptable tolderance SURVEY Date OPTIMIZATION PERCENTAGE SAMPLES INTERPOLATION SAMPLE ERROR (cm) 3/2/1994 Density IDW /2/1994 Density Krig 4.34
48 CONCLUSIONS Random reduction method came closest to acceptable results Density-dependent method came close, but even the marginal results that were achieved in the study area could not be duplicated in another similar sample survey. Focused reduction method results were well outside of tolerance for acceptable sample error Subjective method proved indeed that some nearby lines could be interpolated after the fact, but that its impossible to derive which ones without actually conducting the survey.

49 RECOMMENDATIONS Continue to create surveys based on current methodology Conduct further review of other surveys to determine if there are certain flight line areas that are more prone to spatial autocorrelation than suggested within this project. Look at specific lines to create an index for how much each line contributes to the overall snow-water equivalent analysis.

50 QUESTIONS?
51 Acknowledgements Dr Justine Blanford Dr Thorsten Wagner Carrie Olheiser NWC and OWP Staff
An investigation of sampling efficiency using historical data. Patrick Didier Advisor: Justine Blanford
 An investigation of sampling efficiency using historical data Patrick Didier Advisor: Justine Blanford Overview Introduction to Airborne Snow Survey program Goals of the Capstone Project Methods and Expected
Sample Density Analysis and Optimization for NOAA's Airborne Snow Water Equivalent Surveys. Patrick D Didier
 Sample Density Analysis and Optimization for NOAA's Airborne Snow Water Equivalent Surveys Patrick D Didier Advisor: Justine Blanford Capstone Project Paper in Support of Master s in Geographic Information
The National Operational Hydrologic Remote Sensing Center Operational Snow Analysis
 The National Operational Hydrologic Remote Sensing Center Operational Snow Analysis World Meteorological Organization Global Cryosphere Watch Snow-Watch Workshop Session 3: Snow Analysis Products Andrew
An Overview of Operations at the West Gulf River Forecast Center Gregory Waller Service Coordination Hydrologist NWS - West Gulf River Forecast Center
 National Weather Service West Gulf River Forecast Center An Overview of Operations at the West Gulf River Forecast Center Gregory Waller Service Coordination Hydrologist NWS - West Gulf River Forecast
Snowfall Patterns Indicated by SNOTEL Measurements NOAA
 Snowfall Patterns Indicated by SNOTEL Measurements Tim Alder, Sean Pickner, HeatherAnn Van Dyke & Danny Warren GEOG 4/592 03 11 10 NOAA The Southern Oscillation: atmospheric component of the cycle El Niño:
Operational Perspectives on Hydrologic Model Data Assimilation
 Operational Perspectives on Hydrologic Model Data Assimilation Rob Hartman Hydrologist in Charge NOAA / National Weather Service California-Nevada River Forecast Center Sacramento, CA USA Outline Operational
Remote Sensing of SWE in Canada
 Remote Sensing of SWE in Canada Anne Walker Climate Research Division, Environment Canada Polar Snowfall Hydrology Mission Workshop, June 26-28, 2007 Satellite Remote Sensing Snow Cover Optical -- Snow
Souris River Basin Spring Runoff Outlook As of March 1, 2019
 Souris River Basin Spring Runoff Outlook As of March 1, 2019 Prepared by: Flow Forecasting & Operations Planning Water Security Agency Basin Conditions Summer rainfall in 2018 over the Saskatchewan portion
Novel Snotel Data Uses: Detecting Change in Snowpack Development Controls, and Remote Basin Snow Depth Modeling
 Novel Snotel Data Uses: Detecting Change in Snowpack Development Controls, and Remote Basin Snow Depth Modeling OVERVIEW Mark Losleben and Tyler Erickson INSTAAR, University of Colorado Mountain Research
Central Asia Regional Flash Flood Guidance System 4-6 October Hydrologic Research Center A Nonprofit, Public-Benefit Corporation
 http://www.hrcwater.org Central Asia Regional Flash Flood Guidance System 4-6 October 2016 Hydrologic Research Center A Nonprofit, Public-Benefit Corporation FFGS Snow Components Snow Accumulation and
Airborne Geophysical Survey Report River Jordan Property
 Airborne Geophysical Survey Report River Jordan Property Prepared for: Inc. September 3, 2009 Precision GeoSurveys Inc. 520-355 Burrard Street, Vancouver, Canada V6C 2G8 www.precisiongeosurveys.com Table
Operational Hydrologic Ensemble Forecasting. Rob Hartman Hydrologist in Charge NWS / California-Nevada River Forecast Center
 Operational Hydrologic Ensemble Forecasting Rob Hartman Hydrologist in Charge NWS / California-Nevada River Forecast Center Mission of NWS Hydrologic Services Program Provide river and flood forecasts
WeatherHawk Weather Station Protocol
 WeatherHawk Weather Station Protocol Purpose To log atmosphere data using a WeatherHawk TM weather station Overview A weather station is setup to measure and record atmospheric measurements at 15 minute
Introduction to Weather Analytics & User Guide to ProWxAlerts. August 2017 Prepared for:
 Introduction to Weather Analytics & User Guide to ProWxAlerts August 2017 Prepared for: Weather Analytics is a leading data and analytics company based in Washington, DC and Dover, New Hampshire that offers
Regional Haze Metrics Trends and HYSPLIT Trajectory Analyses. May 2017
 Regional Haze Metrics Trends and HYSPLIT Trajectory Analyses May 2017 Principal Contributors: Tom Downs, CCM, ME DEP Project manager Martha Webster, ME DEP Trajectory analyses and GIS mapping Rich Greves,
An Evaluation of Seeding Effectiveness in the Central Colorado Mountains River Basins Weather Modification Program
 2016, UCAR. All rights reserved. An Evaluation of Seeding Effectiveness in the Central Colorado Mountains River Basins Weather Modification Program for Grand River Consulting Sponsors: Colorado Water Conservation
Prediction of Snow Water Equivalent in the Snake River Basin
 Hobbs et al. Seasonal Forecasting 1 Jon Hobbs Steve Guimond Nate Snook Meteorology 455 Seasonal Forecasting Prediction of Snow Water Equivalent in the Snake River Basin Abstract Mountainous regions of
Midwest and Great Plains Drought and Climate Summary 20 February 2014
 Midwest and Great Plains Drought and Climate Summary 20 February 2014 Wendy Ryan Assistant State Climatologist Colorado Climate Center Colorado State University wendy.ryan@colostate.edu 970-491-8506 General
PLANNED UPGRADE OF NIWA S HIGH INTENSITY RAINFALL DESIGN SYSTEM (HIRDS)
") PLANNED UPGRADE OF NIWA S HIGH INTENSITY RAINFALL DESIGN SYSTEM (HIRDS) G.A. Horrell, C.P. Pearson National Institute of Water and Atmospheric Research (NIWA), Christchurch, New Zealand ABSTRACT Statistics
PLANNED UPGRADE OF NIWA S HIGH INTENSITY RAINFALL DESIGN SYSTEM (HIRDS) G.A. Horrell, C.P. Pearson National Institute of Water and Atmospheric Research (NIWA), Christchurch, New Zealand ABSTRACT Statistics
Modelling runoff from large glacierized basins in the Karakoram Himalaya using remote sensing of the transient snowline
 Remote Sensing and Hydrology 2000 (Proceedings of a symposium held at Santa Fe, New Mexico, USA, April 2000). IAHS Publ. no. 267, 2001. 99 Modelling runoff from large glacierized basins in the Karakoram
WSWC/NOAA Workshops on S2S Precipitation Forecasting
 WSWC/NOAA Workshops on S2S Precipitation Forecasting San Diego, May 2015 Salt Lake City at NWS Western Region HQ, October 2015 Las Vegas at Colorado River Water Users Association, December 2015 College
Using Temperature and Dew Point to Aid Forecasting Springtime Radiational Frost and/or Freezing Temperatures in the NWS La Crosse Service Area
 Using Temperature and Dew Point to Aid Forecasting Springtime Radiational Frost and/or Freezing Temperatures in the NWS La Crosse Service Area WFO La Crosse Climatology Series #21 The formation of radiational
Oregon Water Conditions Report May 1, 2017
 Oregon Water Conditions Report May 1, 2017 Mountain snowpack in the higher elevations has continued to increase over the last two weeks. Statewide, most low and mid elevation snow has melted so the basin
Watershed simulation and forecasting system with a GIS-oriented user interface
 HydroGIS 96: Application of Geographic Information Systems in Hydrology and Water Resources Management (Proceedings of the Vienna Conference, April 1996). IAHS Publ. no. 235, 1996. 493 Watershed simulation
USGS ATLAS. BACKGROUND
 USGS ATLAS. BACKGROUND 1998. Asquith. DEPTH-DURATION FREQUENCY OF PRECIPITATION FOR TEXAS. USGS Water-Resources Investigations Report 98 4044. Defines the depth-duration frequency (DDF) of rainfall annual
Missouri River Basin Water Management
 Missouri River Basin Water Management US Army Corps of Engineers Missouri River Navigator s Meeting February 12, 2014 Bill Doan, P.E. Missouri River Basin Water Management US Army Corps of Engineers BUILDING
Hydrologic Forecast Centre Manitoba Infrastructure, Winnipeg, Manitoba. FEBRUARY OUTLOOK REPORT FOR MANITOBA February 23, 2018
 Page 1 of 17 Hydrologic Forecast Centre Manitoba Infrastructure, Winnipeg, Manitoba FEBRUARY OUTLOOK REPORT FOR MANITOBA February 23, 2018 Overview The February Outlook Report prepared by the Hydrologic
2017 Fall Conditions Report
 2017 Fall Conditions Report Prepared by: Hydrologic Forecast Centre Date: November 15, 2017 Table of Contents TABLE OF FIGURES... ii EXECUTIVE SUMMARY... 1 BACKGROUND... 4 SUMMER AND FALL PRECIPITATION...
Robert Shedd Northeast River Forecast Center National Weather Service Taunton, Massachusetts, USA
 Robert Shedd Northeast River Forecast Center National Weather Service Taunton, Massachusetts, USA Outline River Forecast Centers FEWS Implementation Status Forcing Data Ensemble Forecasting The Northeast
Missouri River Basin Water Management Monthly Update
 Missouri River Basin Water Management Monthly Update Participating Agencies 255 255 255 237 237 237 0 0 0 217 217 217 163 163 163 200 200 200 131 132 122 239 65 53 80 119 27 National Oceanic and Atmospheric
Souris River Basin Spring Runoff Outlook As of March 15, 2018
 Souris River Basin Spring Runoff Outlook As of March 15, 2018 Prepared by: Flow Forecasting & Operations Planning Water Security Agency Basin Conditions Summer rainfall in 2017 in the Saskatchewan portion
ABSTRACT INTRODUCTION
 INTER- AND INTRA-ANNUAL VARIABILITY IN SNOW ALBEDO, GRAIN SIZE, AND SNOW COVERED AREA FROM THE AIRBORNE SNOW OBSERVATORY DURING LOW SNOW YEARS (2013-2015), TUOLUMNE RIVER BASIN, CA S. McKenzie Skiles 1,
Display and analysis of weather data from NCDC using ArcGIS
 Display and analysis of weather data from NCDC using ArcGIS Helen M. Cox Associate Professor Geography Department California State University, Northridge and Stephen Krug Graduate Student Geography Department
Jon W. Zeitler* NOAA/NWS/Austin/San Antonio Weather Forecast Office, TX. Paul G. Witsaman NOAA/NWS/Southern Region Headquarters, Ft.
 P1.48 ASYNOPTIC HIGH RESOLUTION UPPER-AIR DATA FOR HIGH IMPACT WEATHER EVENTS Jon W. Zeitler* NOAA/NWS/Austin/San Antonio Weather Forecast Office, TX Paul G. Witsaman NOAA/NWS/Southern Region Headquarters,
Climatic Change Implications for Hydrologic Systems in the Sierra Nevada
 Climatic Change Implications for Hydrologic Systems in the Sierra Nevada Part Two: The HSPF Model: Basis For Watershed Yield Calculator Part two presents an an overview of why the hydrologic yield calculator
Steven Chien Kung-E Cheng New Jersey Institute of Technology. David Bowlby New Jersey Department of Transportation
 Steven Chien Kung-E Cheng New Jersey Institute of Technology David Bowlby New Jersey Department of Transportation The 11th MDSS Stakeholder Meeting Charlotte, NC September 16, 2009 NJ-MDSS Goals Improve
Daily Operations Briefing Thursday, January 8, :30 a.m. EST
 Daily Operations Briefing Thursday, January 8, 2015 8:30 a.m. EST Significant Activity: Jan 7-8 Significant Events: None Significant Weather: Snow Northern Rockies to Central Plains; Upper Mississippi
Hydrologic Forecast Centre Manitoba Infrastructure, Winnipeg, Manitoba. MARCH OUTLOOK REPORT FOR MANITOBA March 23, 2018
 Page 1 of 21 Hydrologic Forecast Centre Manitoba Infrastructure, Winnipeg, Manitoba MARCH OUTLOOK REPORT FOR MANITOBA March 23, 2018 Overview The March Outlook Report prepared by the Hydrologic Forecast
MxVision WeatherSentry Web Services Content Guide
 MxVision WeatherSentry Web Services Content Guide July 2014 DTN 11400 Rupp Drive Minneapolis, MN 55337 00.1.952.890.0609 This document and the software it describes are copyrighted with all rights reserved.
Presented by Larry Rundquist Alaska-Pacific River Forecast Center Anchorage, Alaska April 14, 2009
 Presented by Larry Rundquist Alaska-Pacific River Forecast Center Anchorage, Alaska April 14, 2009 Presentation Outline Who we are Breakup characteristics Climate and weather influences 2009 breakup outlook
Real-Time Meteorological Gridded Data: What s New With HEC-RAS
 Real-Time Meteorological Gridded Data: What s New With HEC-RAS Acquisition and Application of Gridded Meteorological Data in Support of the USACE s Real-Time Water Management Mission Fauwaz Hanbali, Tom
Traffic and Weather. Soaring Safety Foundation. Tom Johnson CFIG
 Traffic and Weather Soaring Safety Foundation Tom Johnson CFIG Weather Contents Weather Gathering Sources Weather Acquisition Enroute Weather Analysis Weather Hazards Weather in the Landing Pattern Basic
The Hydrologic Cycle: How Do River Forecast Centers Measure the Parts?
 The Hydrologic Cycle: How Do River Forecast Centers Measure the Parts? Greg Story Meteorologist National Weather Service Fort Worth, TX Overview n Introduction What is the mission of an RFC? n The Hydrologic
Missouri River Flood Task Force River Management Working Group Improving Accuracy of Runoff Forecasts
 Missouri River Flood Task Force River Management Working Group Improving Accuracy of Runoff Forecasts Kevin Grode, P.E. Reservoir Regulation Team Lead Missouri River Basin Water Management Northwestern
XA TERRESTRIAL GAMMA DOSE RATE MAPS, THEIR COMPILATION AND VERIFICATION RADIOMETRIC MAP OF THE CZECH REPUBLIC
 TERRESTRIAL GAMMA DOSE RATE MAPS, THEIR COMPILATION AND VERIFICATION RADIOMETRIC MAP OF THE CZECH REPUBLIC XA9745936 M. MATOLIN Faculty of Science, Charles University, Prague, Czech Republic Abstract Maps
Amita Mehta and Ana Prados
 Building Capacity in Utilizing NASA Remote Sensing Observations in SWAT for Water Resources and Agricultural Management Applications Amita Mehta and Ana Prados NASA - University of Maryland Baltimore County
The use of satellite images to forecast agricultural production
 The use of satellite images to forecast agricultural production Artur Łączyński Central Statistical Office, Agriculture Department Niepodległości 208 Warsaw, Poland E-mail a.laczynski@stat.gov.pl DOI:
Updated Precipitation Frequency Estimates for Minnesota
 1 Updated Precipitation Frequency Estimates for Minnesota Presenter: Authors: (alphabetical order) Sanja Perica, Director Hydrometeorological Design Studies Center (HDSC), Office of Hydrology, National
Advanced Weather Technology
 Advanced Weather Technology Tuesday, October 16, 2018, 1:00 PM 2:00 PM PRESENTED BY: Gary Pokodner, FAA WTIC Program Manager Agenda Overview Augmented reality mobile application Crowd Sourcing Visibility
NIDIS Intermountain West Regional Drought Early Warning System February 7, 2017
 NIDIS Drought and Water Assessment NIDIS Intermountain West Regional Drought Early Warning System February 7, 2017 Precipitation The images above use daily precipitation statistics from NWS COOP, CoCoRaHS,
Land Data Assimilation at NCEP NLDAS Project Overview, ECMWF HEPEX 2004
 Dag.Lohmann@noaa.gov, Land Data Assimilation at NCEP NLDAS Project Overview, ECMWF HEPEX 2004 Land Data Assimilation at NCEP: Strategic Lessons Learned from the North American Land Data Assimilation System
Regional offline land surface simulations over eastern Canada using CLASS. Diana Verseghy Climate Research Division Environment Canada
 Regional offline land surface simulations over eastern Canada using CLASS Diana Verseghy Climate Research Division Environment Canada The Canadian Land Surface Scheme (CLASS) Originally developed for the
NIDIS Intermountain West Drought Early Warning System February 12, 2019
 NIDIS Intermountain West Drought Early Warning System February 12, 2019 Precipitation The images above use daily precipitation statistics from NWS COOP, CoCoRaHS, and CoAgMet stations. From top to bottom,
Regional Drought Decision Support System (RDDSS) Project Update and Product Concepts
 Project Update and Product Concepts") Regional Drought Decision Support System (RDDSS) Project Update and Product Concepts Part of the Red River Basin Decision Information Network (RRBDIN) NEXT-GEN RRBDIN Decision Support for the Red River
Regional Drought Decision Support System (RDDSS) Project Update and Product Concepts Part of the Red River Basin Decision Information Network (RRBDIN) NEXT-GEN RRBDIN Decision Support for the Red River
USA National Weather Service Community Hydrologic Prediction System
 USA National Weather Service Community Hydrologic Prediction System Rob Hartman Hydrologist in Charge NOAA / National Weather Service California-Nevada River Forecast Center Sacramento, CA Background Outline
MDSS Functional Prototype Display System Preview April 2002
 MDSS Functional Prototype Display System Preview April 2002 Bill Mahoney National Center for Atmospheric Research Images shown are valid as of 15 April 2002 NCAR MDSS Display System - Overview The MDSS
3. Radiometry. The Australian Continent: A Geophysical Synthesis Radiometry
 16 3. Radiometry A major effort has been made to assemble a continent-scale study combining the results of many different airborne radiometric surveys (Figure 3.1). The radiometric surveys measure the
Flood Forecasting Methodology in Alberta
 Flood Forecasting Methodology in Alberta Evan Friesenhan, M.Eng., P.Eng Alberta Environment and Sustainable Resource Development March 17, 2014 River Forecast Team Mandate To provide Albertans with information
Using ArcGIS 10 to Estimate the U.S. Population Affected by Drought
 Using ArcGIS 10 to Estimate the U.S. Population Affected by Drought Jeff Nothwehr National Drought Mitigation Center University of Nebraska-Lincoln Overview What is the U.S. Drought Monitor Mapping Process
Idaho Power Company s Cloud Seeding Program May 6, 2016
 Idaho Power Company s Cloud Seeding Program May 6, 2016 Shaun Parkinson, PhD, P.E. Overview What is cloud seeding & how is it done Idaho Power s history with cloud seeding Idaho Power s cloud seeding projects
Missouri River Basin Water Management Monthly Update
 Missouri River Basin Water Management Monthly Update Participating Agencies 255 255 255 237 237 237 0 0 0 217 217 217 163 163 163 200 200 200 131 132 122 239 65 53 80 119 27 National Oceanic and Atmospheric
Technical Memorandum. City of Salem, Stormwater Management Design Standards. Project No:
 Technical Memorandum 6500 SW Macadam Avenue, Suite 200 Portland, Oregon, 97239 Tel: 503-244-7005 Fax: 503-244-9095 Prepared for: Project Title: City of Salem, Oregon City of Salem, Stormwater Management
NIDIS Intermountain West Drought Early Warning System January 15, 2019
 NIDIS Drought and Water Assessment NIDIS Intermountain West Drought Early Warning System January 15, 2019 Precipitation The images above use daily precipitation statistics from NWS COOP, CoCoRaHS, and
2015 January Conditions Report
 2015 January Conditions Report Prepared by: Hydrologic Forecast Centre Date: January 28, 2015 1 P a g e Table of Contents List of Figures... 3 SUMMARY... 5 2 P a g e List of Figures Figure 1. Antecedent
Changes to Extreme Precipitation Events: What the Historical Record Shows and What It Means for Engineers
 Changes to Extreme Precipitation Events: What the Historical Record Shows and What It Means for Engineers Geoffrey M Bonnin National Oceanic and Atmospheric Administration National Weather Service Office
Use of Geophysical Software for Interpretation of Ice-Penetrating Radar Data and Mapping of Polar Ice Sheets
 Use of Geophysical Software for Interpretation of Ice-Penetrating Radar Data and Mapping of Polar Ice Sheets Alex O. Martinez University of Kansas 2335 Irving Hill Road Lawrence, KS 66045-7612 http://cresis.ku.edu
Arkansas-Red Basin River Forecast Center Operations. RRVA Conference Durant, OK 8/22/2013 Jeff McMurphy Sr. Hydrologist - ABRFC
 Arkansas-Red Basin River Forecast Center Operations RRVA Conference Durant, OK 8/22/2013 Jeff McMurphy Sr. Hydrologist - ABRFC NWS River Forecast Centers NWS Weather Forecast Offices Operations Staffing
In this exercise we will learn how to use the analysis tools in ArcGIS with vector and raster data to further examine potential building sites.
 GIS Level 2 In the Introduction to GIS workshop we filtered data and visually examined it to determine where to potentially build a new mixed use facility. In order to get a low interest loan, the building
Gridded Ambient Air Pollutant Concentrations for Southern California, User Notes authored by Beau MacDonald, 11/28/2017
 Gridded Ambient Air Pollutant Concentrations for Southern California, 1995-2014 User Notes authored by Beau, 11/28/2017 METADATA: Each raster file contains data for one pollutant (NO2, O3, PM2.5, and PM10)
New NOAA Precipitation-Frequency Atlas for Wisconsin
 New NOAA Precipitation-Frequency Atlas for Wisconsin #215966 Presentation to the Milwaukee Metropolitan Sewerage District Technical Advisory Team January 16, 2014 Michael G. Hahn, P.E., P.H. SEWRPC Chief
Basic Hydrologic Science Course Understanding the Hydrologic Cycle Section Six: Snowpack and Snowmelt Produced by The COMET Program
 Basic Hydrologic Science Course Understanding the Hydrologic Cycle Section Six: Snowpack and Snowmelt Produced by The COMET Program Snow and ice are critical parts of the hydrologic cycle, especially at
Preliminary Runoff Outlook February 2018
 Preliminary Runoff Outlook February 2018 Prepared by: Flow Forecasting & Operations Planning Water Security Agency General Overview The Water Security Agency (WSA) is preparing for 2018 spring runoff including
CHAPTER 1 INTRODUCTION
 CHAPTER 1 INTRODUCTION Mean annual precipitation (MAP) is perhaps the most widely used variable in hydrological design, water resources planning and agrohydrology. In the past two decades one of the basic
United States Multi-Hazard Early Warning System
 United States Multi-Hazard Early Warning System Saving Lives Through Partnership Lynn Maximuk National Weather Service Director, Central Region Kansas City, Missouri America s s Weather Enterprise: Protecting
Monthly Long Range Weather Commentary Issued: APRIL 18, 2017 Steven A. Root, CCM, Chief Analytics Officer, Sr. VP,
 Monthly Long Range Weather Commentary Issued: APRIL 18, 2017 Steven A. Root, CCM, Chief Analytics Officer, Sr. VP, sroot@weatherbank.com MARCH 2017 Climate Highlights The Month in Review The average contiguous
Geographic Systems and Analysis
 Geographic Systems and Analysis New York University Robert F. Wagner Graduate School of Public Service Instructor Stephanie Rosoff Contact: stephanie.rosoff@nyu.edu Office hours: Mondays by appointment
January 2011 Calendar Year Runoff Forecast
 January 2011 Calendar Year Runoff Forecast 2010 Runoff Year Calendar Year 2010 was the third highest year of runoff in the Missouri River Basin above Sioux City with 38.8 MAF, behind 1978 and 1997 which
NRC Workshop - Probabilistic Flood Hazard Assessment Jan 2013
 Regional Precipitation-Frequency Analysis And Extreme Storms Including PMP Current State of Understanding/Practice Mel Schaefer Ph.D. P.E. MGS Engineering Consultants, Inc. Olympia, WA NRC Workshop - Probabilistic
Climate Change and Stormwater. Daniel Brown, Research Associate, GLISA
 Climate Change and Stormwater Daniel Brown, Research Associate, GLISA Global Trends and Regional Trends Global trends are more certain than regional trends. Natural variability plays a larger role at the
Dual-Frequency Ku- Band Radar Mission Concept for Snow Mass
 Dual-Frequency Ku- Band Radar Mission Concept for Snow Mass Chris Derksen Environment and Climate Change Canada Study Team: Climate Research Division/Meteorological Research Division, ECCC Canadian Space
The Climate of Marshall County
 The Climate of Marshall County Marshall County is part of the Crosstimbers. This region is a transition region from the Central Great Plains to the more irregular terrain of southeastern Oklahoma. Average
Technical Description for Aventus NowCast & AIR Service Line
 Technical Description for Aventus NowCast & AIR Service Line This document has been assembled as a question and answer sheet for the technical aspects of the Aventus NowCast Service. It is designed to
Missouri River Basin Water Management Monthly Update
 Missouri River Basin Water Management Monthly Update Participating Agencies 255 255 255 237 237 237 0 0 0 217 217 217 163 163 163 200 200 200 131 132 122 239 65 53 80 119 27 National Oceanic and Atmospheric
Idaho Transportation Department Winter Performance Measures Bob Koeberlein, HQ Operations Engineer. WSRTTIF June
 Idaho Transportation Department Winter Performance Measures Bob Koeberlein, HQ Operations Engineer WSRTTIF June 2015 1 This Presentation will cover Concept of winter performance measures Transition from
Speakers: NWS Buffalo Dan Kelly and Sarah Jamison, NERFC Jeane Wallace. NWS Flood Services for the Black River Basin
 Speakers: NWS Buffalo Dan Kelly and Sarah Jamison, NERFC Jeane Wallace NWS Flood Services for the Black River Basin National Weather Service Who We Are The National Oceanic and Atmospheric Administration
GIS Frameworks in the National Weather Service
 GIS Frameworks in the National Weather Service Eugene Derner Senior Hydrologist NOAA/National Weather Service Missouri Basin River Forecast Center Agenda GIS Brief History In-house GIS Weather GIS Applications
DETERMINING USEFUL FORECASTING PARAMETERS FOR LAKE-EFFECT SNOW EVENTS ON THE WEST SIDE OF LAKE MICHIGAN
 DETERMINING USEFUL FORECASTING PARAMETERS FOR LAKE-EFFECT SNOW EVENTS ON THE WEST SIDE OF LAKE MICHIGAN Bradley M. Hegyi National Weather Center Research Experiences for Undergraduates University of Oklahoma,
NOAA/WSWC Workshop on Seasonal Forecast Improvements. Kevin Werner, NOAA Jeanine Jones, CA/DWR
 NOAA/WSWC Workshop on Seasonal Forecast Improvements Kevin Werner, NOAA Jeanine Jones, CA/DWR Outline Workshop motivation Goals Agenda 2 Workshop Motivation Opportunity for application of improved seasonal
Monthly Long Range Weather Commentary Issued: February 15, 2015 Steven A. Root, CCM, President/CEO
 Monthly Long Range Weather Commentary Issued: February 15, 2015 Steven A. Root, CCM, President/CEO sroot@weatherbank.com JANUARY 2015 Climate Highlights The Month in Review During January, the average
NWSEO CALLS FOR NATIONAL CLIMATE SERVICE TO BE MADE PART OF THE NATIONAL WEATHER SERVICE
 APRIL 2009 NWSEO CALLS FOR NATIONAL CLIMATE SERVICE TO BE MADE PART OF THE NATIONAL WEATHER SERVICE At its recent winter meeting, the NWSEO National Council decided to urge the Administration and Congress
The Climate of Pontotoc County
 The Climate of Pontotoc County Pontotoc County is part of the Crosstimbers. This region is a transition region from the Central Great Plains to the more irregular terrain of southeast Oklahoma. Average
HyMet Company. Streamflow and Energy Generation Forecasting Model Columbia River Basin
 HyMet Company Streamflow and Energy Generation Forecasting Model Columbia River Basin HyMet Inc. Courthouse Square 19001 Vashon Hwy SW Suite 201 Vashon Island, WA 98070 Phone: 206-463-1610 Columbia River
Flood Forecasting Methodology in Alberta
 Flood Forecasting Methodology in Alberta Evan Friesenhan, M.Eng., P.Eng Alberta Environment and Sustainable Resource Development February 18, 2014 River Forecast Team Mandate To provide Albertans with
Cosmic Ray Detector Software
 Cosmic Ray Detector Software Studying cosmic rays has never been easier Matthew Jones Purdue University 2012 QuarkNet Summer Workshop 1 Brief History First cosmic ray detector built at Purdue in about
CLIMATE CHANGE AND REGIONAL HYDROLOGY ACROSS THE NORTHEAST US: Evidence of Changes, Model Projections, and Remote Sensing Approaches
 CLIMATE CHANGE AND REGIONAL HYDROLOGY ACROSS THE NORTHEAST US: Evidence of Changes, Model Projections, and Remote Sensing Approaches Michael A. Rawlins Dept of Geosciences University of Massachusetts OUTLINE
Operational water balance model for Siilinjärvi mine
 Operational water balance model for Siilinjärvi mine Vesa Kolhinen, Tiia Vento, Juho Jakkila, Markus Huttunen, Marie Korppoo, Bertel Vehviläinen Finnish Environment Institute (SYKE) Freshwater Centre/Watershed
ASO in Colorado: supporting resilient water management through research support & emerging partnerships
 ASO in Colorado: supporting resilient water management through research support & emerging partnerships Jeffrey S. Deems Airborne Snow Observatory Western Water Assessment National Snow and Ice Data Center
Sanjeev Kumar Jha Assistant Professor Earth and Environmental Sciences Indian Institute of Science Education and Research Bhopal
 Sanjeev Kumar Jha Assistant Professor Earth and Environmental Sciences Indian Institute of Science Education and Research Bhopal Email: sanjeevj@iiserb.ac.in 1 Outline 1. Motivation FloodNet Project in
Upper Missouri River Basin December 2017 Calendar Year Runoff Forecast December 5, 2017
 Upper Missouri River Basin December 2017 Calendar Year Runoff Forecast December 5, 2017 Calendar Year Runoff Forecast Explanation and Purpose of Forecast U.S. Army Corps of Engineers, Northwestern Division
A GEOSTATISTICAL APPROACH TO PREDICTING A PHYSICAL VARIABLE THROUGH A CONTINUOUS SURFACE
 Katherine E. Williams University of Denver GEOG3010 Geogrpahic Information Analysis April 28, 2011 A GEOSTATISTICAL APPROACH TO PREDICTING A PHYSICAL VARIABLE THROUGH A CONTINUOUS SURFACE Overview Data