Using ArcGIS 10 to Estimate the U.S. Population Affected by Drought
|
|
|
- Adrian Nichols
- 6 years ago
- Views:
Transcription
1 Using ArcGIS 10 to Estimate the U.S. Population Affected by Drought Jeff Nothwehr National Drought Mitigation Center University of Nebraska-Lincoln
2 Overview What is the U.S. Drought Monitor Mapping Process Need for Population Statistics Population Calculation Process Caveats and Future Considerations
3 U.S. DROUGHT MONITOR BACKGROUND
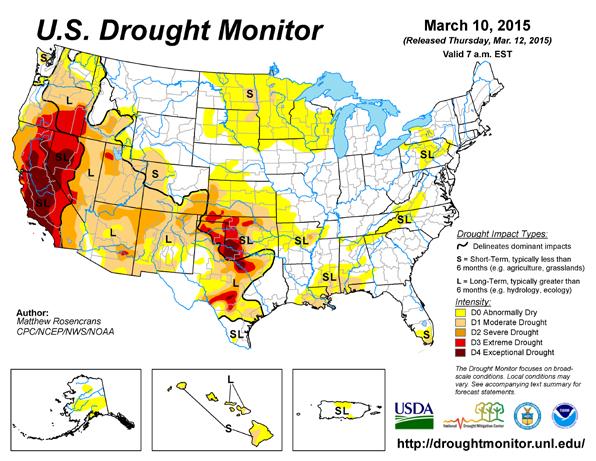
4 What is the U.S. Drought Monitor? Map depicting current drought conditions across the U.S. Produced on a weekly basis Five categories D0 Abnormally Dry D1 Moderate Drought D2 Severe Drought D3 Extreme Drought D4 Exceptional Drought
5 What is the U.S. Drought Monitor? Compiled by one author each week Authors examine inputs Information provided from local experts Drought indices Released at 8:30 A.M. Eastern Time each Thursday
6 What is the U.S. Drought Monitor? Viewed by millions of people each year 6.7 million page views in million unique site visitors in 2014 Incorporated into federal aid programs and state drought plans
7
8 USDM MAPPING PROCESS
9 USDM Mapping Process Maps are produced each week using a combination of Python and ArcGIS 10 Process was created and implemented in 2013 Replaced a process using VB.NET Much simpler to run and keep up to date
10 USDM Mapping Process Over 2600 maps produced weekly 5 types of areas mapped Continental U.S. Total U.S. States Predefined Regions (usually a combination of states) 2-digit Hydrologic Units
11 USDM Mapping Process Statistics calculated for 15 types of areas Continental U.S. Total U.S. States Predefined Regions Counties 2,4,6,8-digit Hydrologic Units Climate Divisions FEMA Regions NWS Regions and Weather Forecast Offices River Forecast Center Regions USACE districts and divisions
12 USDM Mapping Process Statistics originally consisted of: Area in drought Percent of area in drought Added population statistics in mid- 2014
13 NEED FOR POPULATION STATISTICS
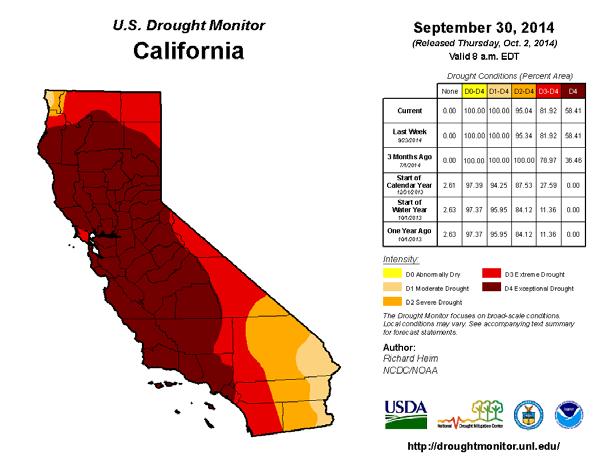
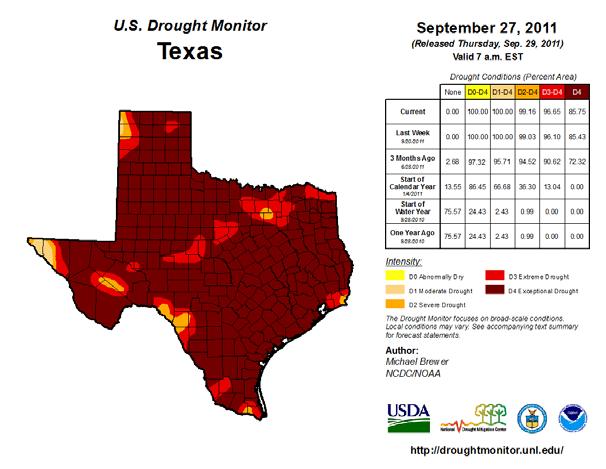
14 Need for Population Statistics Multiple severe droughts in highly populated areas Texas California
15
16
17 Need for Population Statistics Frequently requested by media sources Questions are always being asked about how many people are being directly affected by drought Gives the public a better idea of the scope of the drought
18 CALCULATION PROCESS
19 Calculation Process How to determine population of an area? Start with fairly small areas Boundaries need to be reasonable static Cover the entire U.S.
20 Calculation Process Counties seemed the best choice Why counties? Fairly small in size Boundaries are relatively static Can be aggregated to larger units (states, regions, etc.)
21 Calculation Process County population data obtained from 2010 U.S. Census Population values stored in shapefile Population and area of each county Population and area of larger areas States Regions
22 Calculation Process Population density determined Area of each county is calculated in square miles Population divided by area of county Area of each county in each USDM category calculated Density multiplied by area in each USDM category Provides number of people in each USDM category for each county
23 Calculation Process For larger areas, population numbers are aggregated County -> State -> Regional -> National Population percentage values are determined for all areas Divide affected population by total population of area Values are initially calculated inside of a shapefile and then exported to a data table inside of a geodatabase
24 Calculation Process Final numbers imported into a SQL database Numbers disseminated to maps, spreadsheets, website, etc.
25 Calculation Process How is this done? Python scripts used for the entire process Why scripts? Difficult to do manually in a timely manner Script can be automated to run at a certain time of the week Results are consistent and repeatable
26 Calculation Process Why python? Much simpler to program than other options such as a standalone application Arcpy provides all of the necessary functionality Mapping process already uses python Easier to integrate
27 RESULTS
28 Results Numbers displayed in multiple locations on the USDM website
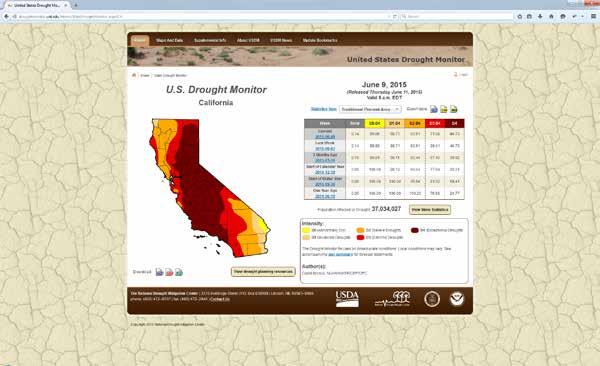
29 Results
30 Results Interesting trends appeared when looking at the population estimates Area in drought increased while affected population declined in some cases Not evident by looking at the spatial coverage alone
31 Results Total U.S. Percent Population in Drought vs Percent Area in Drought Percent Area Population 10 0 Date

32 Results Greater population Greater area
33 CAVEATS AND FUTURE CONSIDERATIONS
34 Caveats and Future Considerations Process can only provide a population estimate Population is not evenly distributed across counties or any other area Process becomes much more complicated to start with areas smaller than counties (i.e. urban areas)
35 Caveats and Future Considerations USDM boundaries are considered fuzzy Not a sharp cutoff between areas of each type of drought More of a transitional zone
36 Caveats and Future Considerations Due to the complex nature of drought, people are affected outside of the primary drought area i.e. higher food prices at grocery stores
37 Caveats and Future Considerations Occasional situations where numbers don t make sense Remember, just using as a rough estimate

38 Caveats and Future Considerations
39 Caveats and Future Considerations Population values based on 2010 census How do we handle data after 2020, 2030, etc? Do we collect data in between the censuses?
40 Caveats and Future Considerations Investigate population estimation for areas not based on counties i.e. Watersheds Would need to determine a method to get initial population figures
41 Caveats and Future Considerations Improve the calculation process Implement multiprocessing to increase speed
42 Caveats and Future Considerations Apply this methodology to other products Currently duplicating the process for the North American Drought Monitor Apply this process to data other than population Crop production Livestock production
43 Questions? Contact information:
The U.S. Drought Monitor: Parameters, People, Process, Policy
 The U.S. Drought Monitor: Parameters, People, Process, Policy Mark Svoboda, Climatologist Monitoring Program Area Leader National Drought Mitigation Center School of Natural Resources University of Nebraska-Lincoln
The United States Drought Monitor How is it Made?
 The United States Drought Monitor How is it Made? Brian Fuchs, Climatologist National Drought Mitigation Center School of Natural Resources University of Nebraska-Lincoln September 14-17, 2009 Bamako,
GIS Tools, Data, & Methods in the Weekly US Drought Monitor
 GIS Tools, Data, & Methods in the Weekly US Drought Monitor International Workshop on Agromet and GIS Applications for Agricultural Decision Making Jeju, South Korea December 5, 2016 Eric Luebehusen USDA/OCE/WAOB
The History and Making of the U.S. Drought Monitor
 The History and Making of the U.S. Drought Monitor Mike Hayes, Director Mark Svoboda, Climatologist/Monitoring Program Area Leader Kelly Smith, Communications Specialist National Drought Mitigation Center
The U.S. Drought Monitor and tools from the National Drought Mitigation Center
 The U.S. Drought Monitor and tools from the National Drought Mitigation Center Brian Fuchs, Climatologist National Drought Mitigation Center School of Natural Resources University of Nebraska-Lincoln Winter
The U.S. Drought Monitor: A Composite Indicator Approach
 The U.S. Drought Monitor: A Composite Indicator Approach Mark Svoboda, Climatologist Monitoring Program Area Leader National Drought Mitigation Center University of Nebraska-Lincoln NWS IN Climate Services
Real-Time Flood Forecasting Modeling in Nashville, TN utilizing HEC-RTS
 Real-Time Flood Forecasting Modeling in Nashville, TN utilizing HEC-RTS Brantley Thames, P.E. Hydraulic Engineer, Water Resources Section Nashville District, USACE August 24, 2017 US Army Corps of Engineers
Empowering Local Health through GIS
 Empowering Local Health through GIS Mapping data from Washington s Immunization Information System (IIS). Presented to IACW October 16 th, 2013 by: Chris Halsell and Isaiah Berg Agenda IIS Overview Why
ASFPM - Rapid Floodplain Mapping
 ASFPM - Nicole Cominoli Hydraulic Engineer USACE - Omaha District mary.n.cominoli@usace.army.mil June 3, 2015 US Army Corps of Engineers Mitigation = Risk Informed Decisions 2 The National Flood Insurance
Leon Creek Watershed October 17-18, 1998 Rainfall Analysis Examination of USGS Gauge Helotes Creek at Helotes, Texas
 Leon Creek Watershed October 17-18, 1998 Rainfall Analysis Examination of USGS Gauge 8181400 Helotes Creek at Helotes, Texas Terrance Jackson MSCE Candidate University of Texas San Antonio Abstract The
A GIS-based Approach to Watershed Analysis in Texas Author: Allison Guettner
 Texas A&M University Zachry Department of Civil Engineering CVEN 658 Civil Engineering Applications of GIS Instructor: Dr. Francisco Olivera A GIS-based Approach to Watershed Analysis in Texas Author:
The U.S. Drought Monitor: A Composite Indicator Approach
 The U.S. Drought Monitor: A Composite Indicator Approach Mark Svoboda, Climatologist Monitoring Program Area Leader National Drought Mitigation Center School of Natural Resources University of Nebraska-Lincoln
National Drought Mitigation Center. Drought Services: Collaborative Efforts Towards Drought Early Warning and Information Systems
 National Drought Mitigation Center Drought Services: Collaborative Efforts Towards Drought Early Warning and Information Systems Mark Svoboda, Climatologist Monitoring Program Area Leader National Drought
UNITED STATES AND SOUTH AMERICA OUTLOOK (FULL REPORT) Thursday, December 28, 2017
 Thursday, December 28, 2017") T-storm Weather Summary Despite scattered t-storms Sat.-Sun. in central and northern areas in Argentina, more will likely be needed especially in sunflower areas of the southwest. Some t-storms likely
T-storm Weather Summary Despite scattered t-storms Sat.-Sun. in central and northern areas in Argentina, more will likely be needed especially in sunflower areas of the southwest. Some t-storms likely
BROOKINGS May
 Appendix 1. Technical Methodology This study combines detailed data on transit systems, demographics, and employment to determine the accessibility of jobs via transit within and across the country s 100
CARIWIN Regional Seminar January 14-15, 2010, Georgetown, Guyana
 Creating the North American Drought Monitor Angel (Bennett) McCoy Angel.M.Bennett@noaa.gov NOAA/Climate Prediction Center Camp Springs, Maryland, U.S.A. Doug LeComte NOAA/Climate Prediction Center Richard
Assessing flood disaster impacts in Southeast Asia
 Introduction: Assessing flood disaster impacts in Southeast Asia Colin Doyle Geography and the Environment University of Texas at Austin December 2, 2016 Like many tropical regions, the Lower Mekong River
Visualization of Commuter Flow Using CTPP Data and GIS
 Visualization of Commuter Flow Using CTPP Data and GIS Research & Analysis Department Southern California Association of Governments 2015 ESRI User Conference l July 23, 2015 l San Diego, CA Jung Seo,
NIDIS Intermountain West Drought Early Warning System July 18, 2017
 NIDIS Drought and Water Assessment NIDIS Intermountain West Drought Early Warning System July 18, 2017 Precipitation The images above use daily precipitation statistics from NWS COOP, CoCoRaHS, and CoAgMet
Merging statistics and geospatial information
 Merging statistics and geospatial information Demography / Commuting / Spatial planning / Registers Mirosław Migacz Chief GIS Specialist Janusz Dygaszewicz Director Central Statistical Office of Poland
How GIS can support the Production
 How GIS can support the Production of Local Development Plans ESRI User Conference 2017 Mandy Maas ARUP Who we are Shaping a better world We are an independent firm of designers, planners, engineers, consultants
DROUGHT ASSESSMENT USING SATELLITE DERIVED METEOROLOGICAL PARAMETERS AND NDVI IN POTOHAR REGION
 DROUGHT ASSESSMENT USING SATELLITE DERIVED METEOROLOGICAL PARAMETERS AND NDVI IN POTOHAR REGION Researcher: Saad-ul-Haque Supervisor: Dr. Badar Ghauri Department of RS & GISc Institute of Space Technology
Acknowledgments xiii Preface xv. GIS Tutorial 1 Introducing GIS and health applications 1. What is GIS? 2
 Acknowledgments xiii Preface xv GIS Tutorial 1 Introducing GIS and health applications 1 What is GIS? 2 Spatial data 2 Digital map infrastructure 4 Unique capabilities of GIS 5 Installing ArcView and the
of an early warning system
 The benefits and the development of an early warning system In the context of: The Mesoamerican Food Security and Early Warning System Project Angel (Bennett) McCoy Angel.M.Bennett@noaa.gov NOAA/Climate
Visualization of Origin- Destination Commuter Flow Using CTPP Data and ArcGIS
 Visualization of Origin- Destination Commuter Flow Using CTPP Data and ArcGIS Research & Analysis Department Southern California Association of Governments 2015 ESRI User Conference l July 23, 2015 l San
SOUTHERN CLIMATE MONITOR
 SOUTHERN CLIMATE MONITOR MARCH 2011 VOLUME 1, ISSUE 3 IN THIS ISSUE: Page 2 to 4 Severe Thunderstorm Climatology in the SCIPP Region Page 4 Drought Update Page 5 Southern U.S. Precipitation Summary for
Breaking the 5 Mile per Hour Barrier: Automated Mapping Using a Normal Depth Calculation
 Breaking the 5 Mile per Hour Barrier: Automated Mapping Using a Normal Depth Calculation Jeffrey T. Shafer, P.E. and James R. Williams, P.E. Nebraska Department of Natural Resources Introduction In 1998,
NADM, NACEM, and Opportunities for Future Collaboration
 NADM, NACEM, and Opportunities for Future Collaboration Richard R. Heim Jr. NOAA/NESDIS/National Climatic Data Center Asheville, North Carolina, U.S.A. 4th Annual DRI Workshop 26-28 January 2009, Regina,
Compilation of GIS data for the Lower Brazos River basin
 Compilation of GIS data for the Lower Brazos River basin Francisco Olivera, Ph.D., P.E. Srikanth Koka Lauren Walker Aishwarya Vijaykumar Department of Civil Engineering December 5, 2011 Contents Brief
Out with the Old, In with the New: Implementing the Results of the Iowa Rapid Floodplain Modeling Project
 Out with the Old, In with the New: Implementing the Results of the Iowa Rapid Floodplain Modeling Project Traci Tylski, E.I., CFM Hydraulics Engineer USACE - Omaha District Traci.M.Tylski@USACE.army.mil
A Comparative Study of the National Water Model Forecast to Observed Streamflow Data
 A Comparative Study of the National Water Model Forecast to Observed Streamflow Data CE394K GIS in Water Resources Term Project Report Fall 2018 Leah Huling Introduction As global temperatures increase,
Summary of Available Datasets that are Relevant to Flood Risk Characterization
 Inter-Agency Characterization Workshop February 25-27, 2014 USACE Institute for Water Resources, Alexandria, VA, IWR Classroom Summary of Available Datasets that are Relevant to Characterization National
USING GIS TO MODEL AND ANALYZE HISTORICAL FLOODING OF THE GUADALUPE RIVER NEAR NEW BRAUNFELS, TEXAS
 USING GIS TO MODEL AND ANALYZE HISTORICAL FLOODING OF THE GUADALUPE RIVER NEAR NEW BRAUNFELS, TEXAS ASHLEY EVANS While the state of Texas is well-known for flooding, the Guadalupe River Basin is one of
An Internet-Based Integrated Resource Management System (IRMS)
") An Internet-Based Integrated Resource Management System (IRMS) Third Quarter Report, Year II 4/1/2000 6/30/2000 Prepared for Missouri Department of Natural Resources Missouri Department of Conservation
An Internet-Based Integrated Resource Management System (IRMS) Third Quarter Report, Year II 4/1/2000 6/30/2000 Prepared for Missouri Department of Natural Resources Missouri Department of Conservation
Natural and Human Influences on Flood Zones in Wake County. Georgia Ditmore
 Natural and Human Influences on Flood Zones in Wake County Georgia Ditmore Prepared for GEOG 591 December 5, 2014 2 Table of Contents Introduction.3 Objectives...5 Methods...6 Conclusion.11 References
4.1 Hazard Identification: Natural Hazards
 data is provided in an annex, it should be assumed that the risk and potential impacts to the affected jurisdiction are similar to those described here for the entire Sacramento County Planning Area. This
Predictive Modelling of Ag, Au, U, and Hg Ore Deposits in West Texas Carl R. Stockmeyer. December 5, GEO 327G
 Predictive Modelling of Ag, Au, U, and Hg Ore Deposits in West Texas Carl R. Stockmeyer December 5, 2013 - GEO 327G Objectives and Motivations The goal of this project is to use ArcGIS to create models
The Recent Long Island Drought
 The Recent Long Island Drought David J. Tonjes Department of Technology and Society Stony Brook University david.tonjes@stonybrook.edu Abstract Drought is a qualitatively defined and determined phenomenon.
A GEOGRAPHIC ASSESSMENT OF MAJOR DISASTER DECLARATIONS ACROSS THE LOWER 48 STATES
 A GEOGRAPHIC ASSESSMENT OF MAJOR DISASTER DECLARATIONS ACROSS THE LOWER 48 STATES A summary report produced by the Southern Climate Impacts Planning Program (SCIPP) Author: James Hocker Southern Climate
Base Level Engineering FEMA Region 6
 Base Level Engineering Over the past five years, has been evaluating its investment approach and data preparation work flow to establish an efficient and effective change in operation, generating an approach
Model Calibration and Forecast Error for NFIE-Hydro
 Corey Van Dyk C E 397 Flood Forecasting 5/8/15 Model Calibration and Forecast Error for NFIE-Hydro Introduction The forecasting component of the National Flood Interoperability Experiment (NFIE), like
Crop / Weather Update
 Crop / Weather Update The next will be published November 13, 2018, due to the Veteran s Day holiday on Monday. Corn Harvesting Progress 100% 90% 80% 70% 60% 50% 40% 30% 20% 10% 0% 9/9 9/16 9/23 9/30 10/7
Denis White NSI Technical Services Corporation 200 SW 35th St. Corvallis, Oregon 97333
 POLYGON OVERLAY TO SUPPORT POINT SAMPLE MAPPING: THE NATIONAL RESOURCES INVENTORY Denis White NSI Technical Services Corporation 200 SW 35th St. Corvallis, Oregon 97333 Margaret Maizel ' American Farmland
Drought History. for the Edwards Plateau of Texas. Prepared by the South Central Climate Science Center in Norman, Oklahoma
 Drought History for the Edwards Plateau of Texas Prepared by the South Central Climate Science Center in Norman, Oklahoma May 28, 2013 http://southcentralclimate.org/ info@southcentralclimate.org (This
Drought History. for the Low Rolling Plains of Texas. Prepared by the South Central Climate Science Center in Norman, Oklahoma
 Drought History for the Low Rolling Plains of Texas Prepared by the South Central Climate Science Center in Norman, Oklahoma May 28, 2013 http://southcentralclimate.org/ info@southcentralclimate.org (This
GIS for Integrated Pest Management. Christina Hailey. Abstract:
 GIS for Integrated Pest Management Christina Hailey Abstract: At its formation in 1965, Harris County Mosquito Control (Houston, Texas) (HCMC) was primarily involved in the prevention and control of mosquito-borne
The Danish enterprise approach to create and publish nautical products.covering the waters along the west coast of Greenland
 The Danish enterprise approach to create and publish nautical products.covering the waters along the west coast of Greenland Charlotte Bjerregaard Overview of data, charts and tasks Old production/new
NIDIS Intermountain West Drought Early Warning System February 6, 2018
 NIDIS Intermountain West Drought Early Warning System February 6, 2018 Precipitation The images above use daily precipitation statistics from NWS COOP, CoCoRaHS, and CoAgMet stations. From top to bottom,
Great Lakes Update. Great Lakes Winter and Spring Summary January June Vol. 187 Great Lakes Update August 2012
 Great Lakes Update Great Lakes Winter and Spring Summary January June 2012 The US Army Corps of Engineers (USACE) Detroit District monitors hydraulic and hydrologic conditions of the Great Lakes. This
GIS in Weather and Society
 GIS in Weather and Society Olga Wilhelmi Institute for the Study of Society and Environment National Center for Atmospheric Research WAS*IS November 8, 2005 Boulder, Colorado Presentation Outline GIS basic
Drought and Climate Extremes Indices for the North American Drought Monitor and North America Climate Extremes Monitoring System. Richard R. Heim Jr.
 Drought and Climate Extremes Indices for the North American Drought Monitor and North America Climate Extremes Monitoring System Richard R. Heim Jr. NOAA/NESDIS/National Climatic Data Center Asheville,
Introduction. Project Summary In 2014 multiple local Otsego county agencies, Otsego County Soil and Water
 Introduction Project Summary In 2014 multiple local Otsego county agencies, Otsego County Soil and Water Conservation District (SWCD), the Otsego County Planning Department (OPD), and the Otsego County
GEOGRAPHIC INFORMATION SYSTEMS Session 8
 GEOGRAPHIC INFORMATION SYSTEMS Session 8 Introduction Geography underpins all activities associated with a census Census geography is essential to plan and manage fieldwork as well as to report results
Oregon Water Conditions Report April 17, 2017
 Oregon Water Conditions Report April 17, 2017 Mountain snowpack continues to maintain significant levels for mid-april. By late March, statewide snowpack had declined to 118 percent of normal after starting
NIDIS Intermountain West Drought Early Warning System March 26, 2019
 NIDIS Intermountain West Drought Early Warning System March 26, 2019 The images above use daily precipitation statistics from NWS COOP, CoCoRaHS, and CoAgMet stations. From top to bottom, and left to right:
Hydrologic and Hydraulic Analyses Using ArcGIS
 Hydrologic and Hydraulic Analyses Using ArcGIS Two day training class Overview ArcGIS and Arc Hydro provide strong foundation for support of hydrologic and hydraulic (H&H) analyses. This two-day course
A Cloud-Based Flood Warning System For Forecasting Impacts to Transportation Infrastructure Systems
 A Cloud-Based Flood Warning System For Forecasting Impacts to Transportation Infrastructure Systems Jon Goodall Associate Professor, Civil and Environmental Engineering Associate Director, Link Lab April
HEC & GIS Modeling of the Brushy Creek HEC & GIS Watershed Modeling of the
 HEC & GIS Modeling of the Brushy Creek HEC & GIS Watershed Modeling of the By Cassandra Fagan 5, December 2014 http://ubcwatershedstudy.ursokr.com/images/ Contents Introduction... 3 Figure 1: 24-hour rainfall
The History Behind Census Geography
 The History Behind Census Geography Michael Ratcliffe Geography Division US Census Bureau Kentucky State Data Center Affiliate Meeting August 5, 2016 Today s Presentation A brief look at the history behind
The North American Drought Monitor - The Canadian Perspective -
 The North American Drought Monitor - The Canadian Perspective - Trevor Hadwen National Agroclimate Information Service AAFC-PFRA, Regina Canmore, Alberta March 16-18, 2008 Background The NADM is a cooperative
Measuring Geographic Access to Primary Care Physicians
 Measuring Geographic Access to Primary Care Physicians The New Mexico Health Policy Commission and the University of New Mexico s Division of Government Research have been working cooperatively to collect
Automated Map Book Production Workflow: Using ArcGIS and Python Programming
 Automated Map Book Production Workflow: Using ArcGIS and Python Programming 2018 ESRI User Conference Jung H. Seo, Tom M. Vo and Frank Wen Southern California Association of Governments July 10, 2018 San
GRAPEVINE LAKE MODELING & WATERSHED CHARACTERISTICS
 GRAPEVINE LAKE MODELING & WATERSHED CHARACTERISTICS Photo Credit: Lake Grapevine Boat Ramps Nash Mock GIS in Water Resources Fall 2016 Table of Contents Figures and Tables... 2 Introduction... 3 Objectives...
The Danish enterprise approach to create and publish nautical products.covering the waters along the west coast of Greenland
 The Danish enterprise approach to create and publish nautical products.covering the waters along the west coast of Greenland Charlotte Bjerregaard Overview of data, charts and tasks Old production/new
Multiple-Year Droughts In Nebraska
 University of Nebraska - Lincoln DigitalCommons@University of Nebraska - Lincoln Drought Mitigation Center Faculty Publications Drought -- National Drought Mitigation Center 2005 Multiple-Year Droughts
Description DESCRIPTION
 DESCRIPTION The location of the Upper James Watershed is located in northeastern South Dakota as well as southeastern North Dakota. It includes the following counties located in North Dakota Barnes, Dickey,
Condition Monitoring: A New System for Drought Impacts Reporting through CoCoRaHS
 Condition Monitoring: A New System for Drought Impacts Reporting through CoCoRaHS Amanda Farris Carolinas Integrated Sciences & Assessments (CISA) University of South Carolina WERA 1012 Annual Conference
Chesapeake Bay Remote Sensing Pilot Executive Briefing
 Chesapeake Bay Remote Sensing Pilot Executive Briefing Introduction In his Executive Order 13506 in May 2009, President Obama stated The Chesapeake Bay is a national treasure constituting the largest estuary
NEWARN Tabletop Exercise Norfolk, Nebraska
 NEWARN Tabletop Exercise Norfolk, Nebraska August 21, 2012 Participant Situation Manual Sponsored by: U.S. EPA and NEWARN Facilitated by: The Horsley Witten Group, Inc. TABLE OF CONTENTS Subject Page Exercise
The History Behind Census Geography
 The History Behind Census Geography Michael Ratcliffe Geography Division US Census Bureau Tennessee State Data Center August 8, 2017 Today s Presentation A brief look at the history behind some of the
NIDIS Intermountain West Drought Early Warning System October 30, 2018
 10/30/2018 NIDIS Drought and Water Assessment NIDIS Intermountain West Drought Early Warning System October 30, 2018 Precipitation The images above use daily precipitation statistics from NWS COOP, CoCoRaHS,
Chapter 12 Monitoring Drought Using the Standardized Precipitation Index
 University of Nebraska - Lincoln DigitalCommons@University of Nebraska - Lincoln Drought Mitigation Center Faculty Publications Drought -- National Drought Mitigation Center 2000 Chapter 12 Monitoring
Historical Drought Analysis for: East Central Oklahoma, Climate Division 6
 Historical Drought Analysis for: East Central Oklahoma, Climate Division 6 Irenea Lodangco, Rachel Riley & Gina Fujan University of Oklahoma Prepared by the Southern Climate Impacts Planning Program November
Current Water Conditions in Massachusetts January 11, 2008
 Current Water Conditions in Massachusetts January 11, 2008 December precipitation was above normal December streamflows were below normal and normal December ground-water levels were below normal and normal
Final Group Project Paper. Where Should I Move: The Big Apple or The Lone Star State
 Final Group Project Paper Where Should I Move: The Big Apple or The Lone Star State By: Nathan Binder, Shannon Scolforo, Kristina Conste, Madison Quinones Main Goal: Determine whether New York or Texas
Semester Project Final Report. Logan River Flood Plain Analysis Using ArcGIS, HEC-GeoRAS, and HEC-RAS
 Semester Project Final Report Logan River Flood Plain Analysis Using ArcGIS, HEC-GeoRAS, and HEC-RAS Kedric Curtis, Josh Hogge, Jordan Jarrett, Jared Justensen May 6, 2016 CEE 6190 GIS for Civil Engineers
Texas Statewide Mesonet Network (TexMesonet) Dr. Kantave Greene 11/15/17
 Dr. Kantave Greene 11/15/17") Texas Statewide Mesonet Network (TexMesonet) Dr. Kantave Greene 11/15/17 1 Observe weather features Why Mesonets? Thunderstorms Squall lines Dry-lines Sea breezes Improve weather & flood forecasts Drought
Texas Statewide Mesonet Network (TexMesonet) Dr. Kantave Greene 11/15/17 1 Observe weather features Why Mesonets? Thunderstorms Squall lines Dry-lines Sea breezes Improve weather & flood forecasts Drought
Visualising time-series data with the Australian Hydrological Geospatial Fabric & the Geofabric Sample Toolbox
 Visualising time-series data with the Australian Hydrological Geospatial Fabric & the Geofabric Sample Toolbox Darren G Smith #Locate15, Thursday 12 th of March 2015 Presentation outline Quick background
Funding provided by NOAA Sectoral Applications Research Project MONITORING DROUGHT. Basic Climatology Colorado Climate Center
 Funding provided by NOAA Sectoral Applications Research Project MONITORING DROUGHT Basic Climatology Colorado Climate Center DEFINING DROUGHT First off, just what is drought? Define a tornado Define a
Drought History. for Southeast Oklahoma. Prepared by the South Central Climate Science Center in Norman, Oklahoma
 Drought History for Southeast Oklahoma Prepared by the South Central Climate Science Center in Norman, Oklahoma May 28, 2013 http://southcentralclimate.org/ info@southcentralclimate.org (This page left
Mesonets and Drought Early Warning
 Mesonets and Drought Early Warning Stuart A. Foster Kentucky Climate Center Western Kentucky University 2017 Regional Mesonet Partners Workshop Champaign, Illinois March 23, 2017 Maximizing the Value of
Spatial Organization of Data and Data Extraction from Maptitude
 Spatial Organization of Data and Data Extraction from Maptitude N. P. Taliceo Geospatial Information Sciences The University of Texas at Dallas UT Dallas GIS Workshop Richardson, TX March 30 31, 2018 1/
Hydrologic and Water Quality Modeling for the Missouri River Basin (MORB)
") 2016 International SWAT Conference in Beijing, China Hydrologic and Water Quality Modeling for the Missouri River Basin (MORB) Zhonglong Zhang, PhD, PE, May Wu, PhD Courtesy of USACE Outline Missouri River
2016 International SWAT Conference in Beijing, China Hydrologic and Water Quality Modeling for the Missouri River Basin (MORB) Zhonglong Zhang, PhD, PE, May Wu, PhD Courtesy of USACE Outline Missouri River
Automated Hydrologic and Hydraulic Modeling of a Hydroelectric System UC1131 July 2012
 Automated Hydrologic and Hydraulic Modeling of a Hydroelectric System UC1131 July 2012 Author: Eok Ngo, Integrated Spatial Solutions, Inc. Contact: engo@issi-gis.com ABSTRACT Balancing the needs of regulatory
5.2. IDENTIFICATION OF NATURAL HAZARDS OF CONCERN
 5.2. IDENTIFICATION OF NATURAL HAZARDS OF CONCERN To provide a strong foundation for mitigation strategies considered in Sections 6 and 9, County considered a full range of natural hazards that could impact
Colorado Ice Jams and CRREL s Ice Jam Database CRREL Ice Engineering Group
 Colorado Ice Jams and CRREL s Ice Jam Database CRREL Ice Engineering Group Presented by, Carrie Vuyovich, Ph.D., P.E. Research Hydraulic Engineer ERDC Cold Regions Research and Engineering Laboratory,
Nebraska experienced a wide
 Issue 1 August 2016 CLIMATE UPDATE A MONTHLY SUMMARY FROM THE neclimate.unl.edu August saw reprieve from dryness, cooler temps Overview Nebraska experienced a wide range of conditions across the state
Drought History. for the Oklahoma Panhandle. Prepared by the South Central Climate Science Center in Norman, Oklahoma
 Drought History for the Oklahoma Panhandle Prepared by the South Central Climate Science Center in Norman, Oklahoma May 28, 2013 http://southcentralclimate.org/ info@southcentralclimate.org (This page
Creating a Pavement Management System Using GIS
 Christopher Castruita PPD 631 Prof. Barry Waite & Prof. Bonnie Shrewsbury Creating a Pavement Management System Using GIS Problem Definition As is the case with many cities, the city of La Cañada Flintridge
Urban Tree Canopy Assessment Purcellville, Virginia
 GLOBAL ECOSYSTEM CENTER www.systemecology.org Urban Tree Canopy Assessment Purcellville, Virginia Table of Contents 1. Project Background 2. Project Goal 3. Assessment Procedure 4. Economic Benefits 5.
Intercity Bus Stop Analysis
 by Karalyn Clouser, Research Associate and David Kack, Director of the Small Urban and Rural Livability Center Western Transportation Institute College of Engineering Montana State University Report prepared
NIDIS Weekly Climate, Water and Drought Assessment Summary Upper Colorado River Basin Pilot Project 13 July 2010
 NIDIS Weekly Climate, Water and Drought Assessment Summary Upper Colorado River Basin Pilot Project 13 July 2010 Precipitation and Snowpack Over the past week, precipitation in the Upper Colorado River
NEW CONCEPTS - SOIL SURVEY OF THE FUTURE
 NEW CONCEPTS - SOIL SURVEY OF THE FUTURE The new process of doing soil surveys by Major Land Resource Areas (MLRA) highlights this section. Special emphasis is given to an overview of the National Soil
A Comprehensive Inventory of the Number of Modified Stream Channels in the State of Minnesota. Data, Information and Knowledge Management.
 A Comprehensive Inventory of the Number of Modified Stream Channels in the State of Minnesota Data, Information and Knowledge Management Glenn Skuta Environmental Analysis and Outcomes Division Minnesota
NWS Resources For School Districts
 NWS Resources For School Districts January 23rd, 2017 Shawn DeVinny shawn.devinny@noaa.gov Meteorologist National Weather Service Twin Cities/Chanhassen, MN Outline Watches/Warnings/Advisories Example
THE OPTIMIZATION OF A STREET NETWORK MODEL FOR EMERGENCY RESPONSE ANALYSIS WITHIN A GEOGRAPHICAL INFORMATION SYSTEM. A Thesis.
 THE OPTIMIZATION OF A STREET NETWORK MODEL FOR EMERGENCY RESPONSE ANALYSIS WITHIN A GEOGRAPHICAL INFORMATION SYSTEM A Thesis Presented to the Faculty of San Diego State University In Partial Fulfillment
Introduction to the 176A labs and ArcGIS Purpose of the labs
 Introduction to the 176A labs and ArcGIS Purpose of the labs Acknowledgement: Slides by David Maidment, U Texas-Austin and Francisco Olivera (TAMU) Hands-on experience with a leading software package Introduction
Python Scripting for Regional Land Use Data Management and QC Workflow
 Python Scripting for Regional Land Use Data Management and QC Workflow 2015 ESRI User Conference July 21, 2015 San Diego, CA Jung Seo, Frank Wen, Simon Choi and Tom Vo Research & Analysis Southern California
NIDIS Intermountain West Drought Early Warning System September 4, 2018
 NIDIS Drought and Water Assessment NIDIS Intermountain West Drought Early Warning System September 4, 2018 Precipitation The images above use daily precipitation statistics from NWS COOP, CoCoRaHS, and
Dealing with Zone A Flood Zones. Topics of Discussion. What is a Zone A Floodplain?
 Dealing with Zone A Flood Zones Topics of Discussion Overview of Zone A Floodplains Permitting Development in Zone A Floodplains Estimating Flood Elevations in Zone A Flood Insurance Implications Letters