Internal Capture in Mixed-Use Developments (MXDs) and Vehicle Trip and Parking Reductions in Transit-Oriented Developments (TODs)
|
|
|
- Egbert Boyd
- 6 years ago
- Views:
Transcription
1 Internal Capture in Mixed-Use Developments (MXDs) and Vehicle Trip and Parking Reductions in Transit-Oriented Developments (TODs) Reid Ewing City and Metropolitan Planning University of Utah
2 The Ds of the Built Environment Density Diversity Design Destination Accessibility Distance to Transit Development Scale Demand Management
3 Internal Capture in MXDs Ewing, R., Greenwald, M., Zhang, M., Walters, J., Feldman, M., Cervero, R., & Thomas, J. (2010). Traffic generated by mixed-use developments Six-region study using consistent built environmental measures. Journal of Urban Planning and Development, 137(3), Tian, G., Ewing, R., White, A., Hamidi, S., Walters, J., Goates, J. P., & Joyce, A. (2015). Traffic Generated by Mixed-Use Developments: Thirteen- Region Study Using Consistent Measures of Built Environment. Transportation Research Record: Journal of the Transportation Research Board, (2500),

4 Introduction Mixed-use development (MXD) Put offices, shops, restaurants, residences, and other codependent activities in close proximity to each other; Shorting trips and allow what might otherwise be external car trips to become internal walk, bike, or transit trips; Reduce the vehicle miles; RiverPlace, Portland: residential, commercial, dining, medical, salon, entertainment
5 Conventional traffic impact analysis ITE method for MXDs 1) Determine the amounts of different land-use types (residential, retail, and office) contained within the development; 2) preliminary estimation = Land-use types * ITE s perunit trip generation rates (no interactions); 3) Reduced estimation = preliminary estimation - a certain percentage to account for internal-capture of trips within MXDs. The reductions are based on lookup tables; 4) For each pair of land uses, productions and attractions of internal trips are reconciled
6 Weaknesses of the current method 1) The two lookup tables are based on data for a limited number of multiuse sites in Florida ; 2) The land-use types and adjustments embodied in the lookup tables are limited to the three uses: residential, retail, and offices; 3) The scale of development is disregarded; 4) The land-use context of development projects is ignored; 5) The possibility of mode shifts for well-integrated, transit-served sites is not explicitly considered;
7 Accurately estimating the proportion of trips captured internally by MXDs is vitally important to accurately assess MXD projects traffic impacts. Top down: assemble enough data on MXDs to estimate statistical models of traffic generation in terms of standard built environmental variables; Taking this approach, Ewing et al. (2010) modeled internal capture rates and external walk and transit mode shares with data for more than 35,000 trips to/from/within 239 MXDs in six metropolitan regions of the U.S.
8 This paper builds on the earlier work of Ewing et al. (2010) with more and newer data. Regions MXDs Trips Earlier study ,877 Current study ,074 We now have enough regions in our database so that regional variables may prove statistically significant in a multi-level analysis. This means that, for the first time, traffic analysts can tailor their analyses to the unique characteristics of their home regions. We now have enough bike trips in our database to model the probability that an external trip will be by bicycle.
9 Conceptual framework

10 Sample selection Household travel survey Regional household survey with XY coordinates; Parcel level land-use data;

11 MXDs selection A mixed-use development or district consists of two or more land uses between which trips can be made using local streets, without having to use major streets. The uses may include residential, retail, office, and/or entertainment. There may be walk trips between the uses. Expert-based process Gateway district, Salt Lake City: dining, entertainment, retail, residential, office
12 Survey year MXDs Mean acreage per MXD Total trip ends Mean trip ends per MXD Atlanta , Austin , Boston , Denver , Eugene , Houston , Kansas City , Minneapolis-St. Paul , Portland , Sacramento , Salt Lake City , San Antonio ,62 87 Seattle , Total ,
13 Variables Outcome variables Definition INTERNAL Dummy variable indicating that a trip remains internal to the MXD (1 = internal, 0 = external). WALK Dummy variable indicating that the travel mode on an external trip is walking (1 = walk, 0 = other). BIKE Dummy variable indicating that the travel mode on an external trip is biking (1 = bike, 0 = other). TRANSIT Dummy variable indicating that the travel mode on an external trip is public bus or rail (1 = transit, 0 = other). Explanatory variables HHSIZE VEHCAP BUSSTOP Level 1 traveler/household level Number of members of the household. Number of motorized vehicles per person in the household. Dummy variable indicating that the household lives within 1/4 mile of a bus stop (1 = yes, 0 = no)
14 Explanatory variables Level 2 MXD explanatory variables AREA Gross land area of the MXD in square miles. POP EMP ACTIVITY ACTDEN DEVLAND JOBPOP LANDMIX INTDEN EMPMILE EMP30T EMP10A, EMP20A, EMP30A STOPDEN RAILSTOP Resident population within the MXD; prorated sum of the population for the census block groups that intersect the MXD. Prorating was done by calculating density of population per residential acre (tax lots designated single-family or multifamily) for the entire census block group, then multiplying the density by the amount of residential acreage within the block group contributing to the MXD, and finally, summing over all block groups intersecting the MXD area. For Houston, data at the traffic analysis zone (TAZ) level were prorated. Employment within the MXD; weighted sum of the employment within the MXD for all Standard Industrial Classification (SIC) industries. For Portland, employment estimates were based on the average number of employees in each size category, summed across employer size categories. For other regions, data at the TAZ level were prorated. Resident population plus employment within the MXD. Activity density per square mile within the MXD. Sum of population and employment within the MXD, divided by gross land area. Proportion of developed land within the MXD. Index that measures balance between employment and resident population within MXD. Index ranges from 0, where only jobs or residents are present in an MXD, not both, to 1 where the ratio of jobs to residents is optimal from the standpoint of trip generation. Values are intermediate when MXDs have both jobs and residents, but one predominates. a Another diversity index that captures the variety of land uses within the MXD. This is an entropy calculation based on net acreage in land-use categories likely to exchange trips b. The entropy index varies in value from 0, where all developed land is in one of these categories, to 1, where developed land is evenly divided among these categories. Number of intersections per square mile of gross land area within the MXD. Total employment outside the MXD within one mile of the boundary. Weighted average for all TAZs intersecting the MXD. Weighting was done by proportion of each TAZ within the MXD boundary relative to an entire TAZ area (i.e., clipping the block group with the MXD polygon). Percentage of total regional employment accessible within 30-min travel time of the MXD using transit. Percentage of total regional employment accessible within 10, 20, and 30-min travel time of the MXD using an automobile at midday. Number of transit stops within the MXD per square mile of land area. Uses 25 ft buffer to catch bus stops on periphery. Rail station located within the MXD (1 = yes, 0 = no). Commuter, metro, and light rail systems are all considered.
15 Explanatory variables Level 3 regional explanatory variables REGPOP Population within the region. INDEX Measure of regional compactness developed by Ewing and Hamidi (Ewing and Hamidi, 2014). Index derived by extracting the common variance from multiple measures through principal component analysis.
16 Average internal capture rates and walk, bike and transit mode shares for external trips to/from MXDs Internal capture (percentage of all trips) Mode share percentage for external trips Walk Bike Transit Region share share share Atlanta 16.4% 4.1% 1.1% 2.6% 7.8% Austin 16.8% 1.4% 1.8% 0.2% 3.4% Boston 21.0% 36.7% 2.2% 28.3% 67.2% Denver 26.5% 7.2% 1.5% 6.9% 15.5% Eugene 24.8% 9.6% 5.0% 13.2% 27.8% Houston 14.8% 1.2% 0.4% 1.5% 3.1% Kansas City 11.1% 2.6% 0.9% 2.9% 6.4% Minneapolis-St. Paul 18.7% 10.7% 2.4% 12.4% 25.4% Portland 25.6% 13.6% 4.5% 12.4% 30.5% Sacramento 16.4% 2.9% 0.4% 0.4% 3.8% Salt Lake City 11.6% 7.4% 1.4% 4.2% 13.0% San Antonio 4.6% 2.4% 0.8% 6.0% 9.2% Seattle 20.2% 7.8% 2.0% 10.0% 19.8% Overall 19.7% 11.9% 2.1% 11.3% 24.3% Sum of walk, bike and transit
17 Models Trip purpose: home-based work, homebased other, non-home-based; Dichotomous outcomes: internal versus external, walk versus other, bike versus other, and transit versus other; Hierarchical modelling: trips/households are nested within MXDs; MXDs are nested within regions; Random intercept models: only the intercepts were allowed to randomly vary across higher level units. Level 3 Regions Level 2 MXDs Level 1 Trips/Households
18 Results Table 1. Log odds of internal capture (log-log form) Home-based work Home-based other Non-home based Coef. t-ratio p-value Coef. t-ratio p-value Coef. t-ratio p-value Constant REGPOP INDEX < AREA < EMP JOBPOP < < INTDEN HHSIZE < < < VEHCAP < < < Pseudo-R
19 Table 2. Log odds of walking on external trips (log-log form) Home-based work Home-based other Non-home-based Coefficient t-ratio p-value Coefficient t-ratio p-value Coefficient t-ratio p-value Constant AREA ACTDEN < < JOBPOP LANDMIX INTDEN EMPMILE < EMP10A HHSIZE < < VEHCAP < < BUSSTOP < Pseudo-R
20 Table 3. Log odds of biking on external trips (log-log form) Home-based work Home-based other Non-home-based Coefficient t-ratio p-value Coefficient t-ratio p-value Coefficient t-ratio p-value Constant REGPOP < INDEX AREA ACTDEN JOBPOP INTDEN EMPMILE < < STOPDEN < EMP30T HHSIZE VEHCAP < BUSSTOP < Pseudo-R
21 Table 4. Log odds of transit on external trips (log-log form) Home-based work Home-based other Non-home-based Coefficient t-ratio p-value Coefficient t-ratio p-value Coefficient t-ratio p-value Constant ACTDEN < < EMPMILE < JOBPOP STOPDEN < HHSIZE < VEHCAP < < BUSSTOP Pseudo-R 2 NA NA 0.43
22 Conclusion Failure to account for internal capture and external walk, bike, and transit trips ends up penalizing MXDs, ITE s trip generation overestimates of the traffic impacts of MXD projects; This research sought to advance the state of knowledge on the relationships that govern travel to, from, and within mixed-use development projects and to enumerate tangible and verifiable traffic reductions relative to the rates in the ITE Trip Generation report. This study represents the first large-sample national study of the traffic generation by mixed-use developments, making use of household travel survey data from 13 metropolitan regions.
23 Mode Shares and Vehicle Trip and Parking Generation at TODs Tian, G., Ewing, R., Weinberger, R., Shively, K., Stinger, P., & Hamidi, S. (2016). Trip and parking generation at transit-oriented developments: a case study of Redmond TOD, Seattle region. Transportation, Ewing, R., Tian, G., Lyons, T., Weinberger, R., Shively, K., & Stinger, P. (2016) Trip and parking generation at transit-oriented developments. National Institute for Transportation and Communities (NITC) report.


24 Introduction How best to allocate land around transit stations? large park-andride lots VS. active uses such as multifamily housing, office, and retail Redmond TOD, Seattle

25 In practice Officials usually assuming that TODs generate the same number of vehicle trips as conventional development and that transit stations require the same number of park-and-ride spaces as non-tod stations.
26 In literature The average trip generation rate in areas with TOD is well below the trip generation rate from the ITE report (Arrington & Cervero 2008; Cervero & Arrington 2008; Cervero et al. 2004). Residents living within TODs are reported to have higher rates of transit trips than who are living outside TOD (SFBAMTC 2006; Cervero et al. 2002; Faghri & Venigalla 2013; Zamir et al. 2014), especially for commuting trips (Arrington & Cervero 2008; Cervero 1994; Lund et al. 2004; Lund et al. 2006).

.")
27 Research Question Much of the travel demand is captured internally and much of the transit demand is generated by TODs themselves. Internal trips Transit trips Vehicle trips There are a few studies of vehicle trip generation (Arrington & Cervero, 2008; Cervero & Arrington, 2008; Zamir et al. 2014) at multifamily developments near transit. There is only one study of vehicle trip generation at TODs (defined as mixed-use developments Handy et al. 2013). The question of how much vehicle trip reduction occurs with TOD is largely unexplored in the literature.
28 TOD Definition TODs are widely defined as compact, mixed-use developments with high-quality walking environments near transit facilities (ITE 2004, pp. 5-7; Jacobson & Forsyth 2008; Renne 2009). For our purposes, TODs are developed by a single developer under a master development plan, and can also include a clustering of development projects near transit facilities that are developed by one or more developers pursuant to a master development plan. Dense Mixed use Pedestrianfriendly Adjacent to transit Built after transit Fully developed or nearly so Self-contained parking
29 TOD Selection Mixed use developments (MXDs) near transit Regional transit agencies and MPOs Google Satellite Imagery Site visit


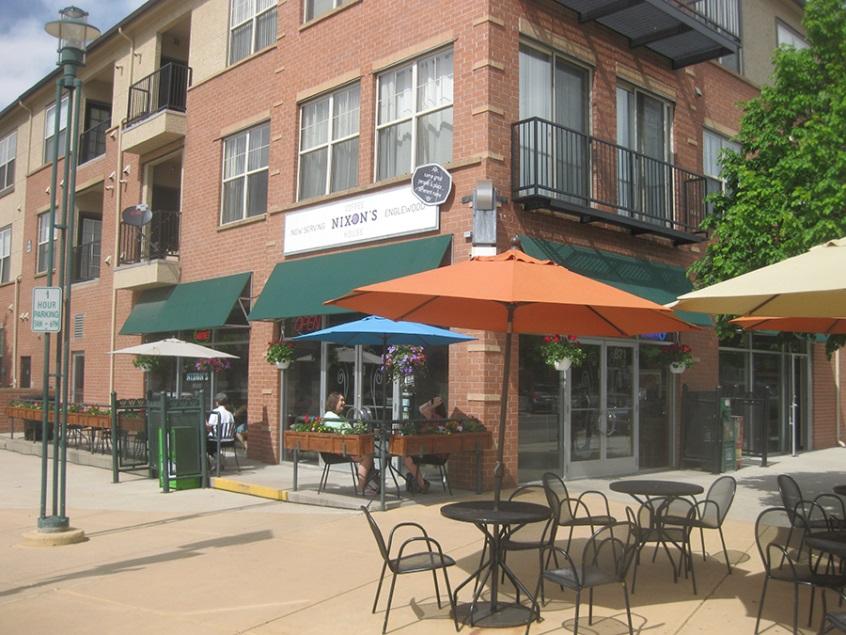
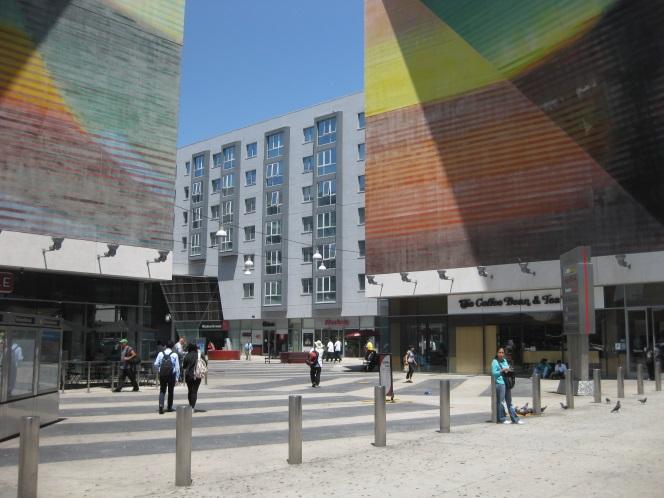

30 Redmond TOD, Seattle Rhode Island Row, Washington D.C. Wilshire/Vermont, Los Angeles Fruitvale Village, San Francisco Englewood TOD, Denver

31 Table 1. Net and Gross Residential Densities, and Floor Area Ratios for Commercial Uses, for the Five TODs Studied
32 Data Collection A full count of all persons entering and exiting the building A brief intercept survey of a sample of individuals entering and exiting the building o How did you get here? (e.g., by what mode of travel?), and 7:30 a.m. and 9:00 p.m. on a workday in spring or fall 2015 o What is the purpose of your trip?


33 Mode Choice and Trip Generation Table 2. Average Mode Shares for TODs Studied Table 3. Average Vehicle Trip Reductions Relative to ITE Rates
34 Figure 2. Vehicle Trip Generation vs. Auto Mode Share

35 Parking Supply and Demand Table 5. Residential Parking Supplies as a Percentage of ITE, and Residential Peak Parking Demand as a Percentage of Actual Supplies


36 Table 6. Commercial/Mixed Use Parking Supplies as a Percentage of ITE, and Commercial/Mixed Use Peak Parking Demand as a Percentage of Actual Supplies Table 7. Aggregate Parking Supplies as a Percentage of ITE Supplies, and Aggregate Peak Parking Demand as a Percentage of Actual Supplies
37 Conclusion Walk mode shares fall within a fairly narrow band, from 16.6 % at Rhode Island Row to 28.3 % at Fruitvale. They mostly reflect the environment in which the TOD is located, and secondarily the number of commercial trip attractions contained within the TOD; The smallest rail mode share is 13.6 % at Englewood. The largest shares are 27.2 % at Rhode Island Row and 26.1 % at Fruitvale; The number of vehicle trips at TODs range from onethird below to two-thirds below ITE rates;
38 The supply of parking stalls for residential use at TODs ranges from 0.81 to 1.60 stalls per dwelling unit; the peak demand for parking ranges from 0.44 to 1.29 spaces per occupied dwelling ; the occupancy of residential parking spaces ranges from 54.3% to 80.6 %; Actual parking supplies for commercial and mixed-use garages and lots in our TODs range from 22.6% to 61.2% of ITE supplies at Englewood; At the overall peak hour, parked cars would fill only 19.0% to 45.8% of parking spaces if built to ITE standards and only 58.3% to 84.0% of parking spaces will be filled.
39 Thank you!
Density and Walkable Communities
 Density and Walkable Communities Reid Ewing Professor & Chair City and Metropolitan Planning University of Utah ewing@arch.utah.edu Department of City & Metropolitan Planning, University of Utah MRC Research
Varying Influences of the Built Environment on Household Travel in Fifteen Diverse Regions of the United states
 Varying Influences of the Built Environment on Household Travel in Fifteen Diverse Regions of the United states Ewing, R., G. Tian, J.P. Goates, M. Zhang, M. Greenwald, Lane Council of Governments, A.
Traffic Generated by Mixed-Use Developments Six-Region Study Using Consistent Built Environmental Measures
 Traffic Generated by Mixed-Use Developments Six-Region Study Using Consistent Built Environmental Measures Reid Ewing 1 ; Michael Greenwald 2 ; Ming Zhang 3 ; Jerry Walters 4 ; Mark Feldman 5 ; Robert
The Built Environment, Car Ownership, and Travel Behavior in Seoul
 The Built Environment, Car Ownership, and Travel Behavior in Seoul Sang-Kyu Cho, Ph D. Candidate So-Ra Baek, Master Course Student Seoul National University Abstract Although the idea of integrating land
California Urban Infill Trip Generation Study. Jim Daisa, P.E.
 California Urban Infill Trip Generation Study Jim Daisa, P.E. What We Did in the Study Develop trip generation rates for land uses in urban areas of California Establish a California urban land use trip
For consideration for presentation at the Transportation Research Record conference
 Transit Commuting and the Built Environment in Station Areas across the United States For consideration for presentation at the Transportation Research Record conference Text Word Count: 3,286 Tables:
Figure 8.2a Variation of suburban character, transit access and pedestrian accessibility by TAZ label in the study area
 Figure 8.2a Variation of suburban character, transit access and pedestrian accessibility by TAZ label in the study area Figure 8.2b Variation of suburban character, commercial residential balance and mix
Impact of Metropolitan-level Built Environment on Travel Behavior
 Impact of Metropolitan-level Built Environment on Travel Behavior Arefeh Nasri 1 and Lei Zhang 2,* 1. Graduate Research Assistant; 2. Assistant Professor (*Corresponding Author) Department of Civil and
Travel Behavior in TODs vs. non-tods: Using Cluster Analysis and Propensity Score Matching
 1 2 3 4 5 6 7 8 9 10 11 12 13 14 15 16 17 18 19 20 21 22 23 24 25 26 27 28 29 30 31 32 33 34 Travel Behavior in TODs vs. non-tods: Using Cluster Analysis and Propensity Score Matching Keunhyun Park Department
Get Over, and Beyond, the Half-Mile Circle (for Some Transit Options)
") Get Over, and Beyond, the Half-Mile Circle (for Some Transit Options) Arthur C. Nelson, Ph.D., FAICP Associate Dean for Research & Discovery College of Architecture, Planning and Landscape Architecture
Get Over, and Beyond, the Half-Mile Circle (for Some Transit Options) Arthur C. Nelson, Ph.D., FAICP Associate Dean for Research & Discovery College of Architecture, Planning and Landscape Architecture
Understanding Land Use and Walk Behavior in Utah
 Understanding Land Use and Walk Behavior in Utah 15 th TRB National Transportation Planning Applications Conference Callie New GIS Analyst + Planner STUDY AREA STUDY AREA 11 statistical areas (2010 census)
Regional Performance Measures
 G Performance Measures Regional Performance Measures Introduction This appendix highlights the performance of the MTP/SCS for 2035. The performance of the Revenue Constrained network also is compared to
Guidelines on Using California Land Use/Transportation Planning Tools
 Guidelines on Using California Land Use/Transportation Planning Tools 1. Selecting Ds Analysis Modules Appropriate to a Region In almost all cases, the appropriate Ds Analysis Module to use for analysis
VALIDATING THE RELATIONSHIP BETWEEN URBAN FORM AND TRAVEL BEHAVIOR WITH VEHICLE MILES TRAVELLED. A Thesis RAJANESH KAKUMANI
 VALIDATING THE RELATIONSHIP BETWEEN URBAN FORM AND TRAVEL BEHAVIOR WITH VEHICLE MILES TRAVELLED A Thesis by RAJANESH KAKUMANI Submitted to the Office of Graduate Studies of Texas A&M University in partial
The Elusive Connection between Density and Transit Use
 The Elusive Connection between Density and Transit Use Abstract: The connection between density and transportation is heralded by planners, yet results are often elusive. This paper analyzes two regions,
Regional Performance Measures
 G Performance Measures Regional Performance Measures Introduction This appendix highlights the performance of the MTP/SCS for 2035. The performance of the Revenue Constrained network also is compared to
Hillsborough County MPO Transit Study. Technical Team August 23, 2007
 Hillsborough County MPO Transit Study Technical Team August 23, 2007 Meeting Agenda Technology Choices Needs and Opportunities Transit Concepts Comparative Land Use Analysis Measures of Effectiveness System
Mapping Accessibility Over Time
 Journal of Maps, 2006, 76-87 Mapping Accessibility Over Time AHMED EL-GENEIDY and DAVID LEVINSON University of Minnesota, 500 Pillsbury Drive S.E., Minneapolis, MN 55455, USA; geneidy@umn.edu (Received
Land Use Advisory Committee. Updating the Transit Market Areas
 Land Use Advisory Committee Updating the Transit Market Areas March 20, 2014 Agenda Transit Market Areas Purpose of Transit Market Areas Transit Market Index Current Market Area boundaries Updating the
Trip and Parking Generation Study of Orem Fitness Center-Abstract
 Trip and Parking Generation Study of Orem Fitness Center-Abstract The Brigham Young University Institute of Transportation Engineers student chapter (BYU ITE) completed a trip and parking generation study
BROOKINGS May
 Appendix 1. Technical Methodology This study combines detailed data on transit systems, demographics, and employment to determine the accessibility of jobs via transit within and across the country s 100
Speakers: Jeff Price, Federal Transit Administration Linda Young, Center for Neighborhood Technology Sofia Becker, Center for Neighborhood Technology
 Speakers: Jeff Price, Federal Transit Administration Linda Young, Center for Neighborhood Technology Sofia Becker, Center for Neighborhood Technology Peter Haas, Center for Neighborhood Technology Craig
GIS for the Non-Expert
 GIS for the Non-Expert Ann Forsyth University of Minnesota February 2006 GIS for the Non-Expert 1. Definitions and problems 2. Measures being tested in Twin Cities Walking Study Basic approach, data, variables
Using household travel surveys to adjust ITE trip generation rates
 THE JOURNAL OF TRANSPORT AND LAND USE http://jtlu.org VOL. 8 NO. 1 [2015] pp. 85 119 Using household travel surveys to adjust ITE trip generation rates Kristina M. Currans a Portland State University Kelly
A Method to Reduce the Modifiable Areal Unit Problem in Measuring Urban Form Metrics
 A Method to Reduce the Modifiable Areal Unit Problem in Measuring Urban Form Metrics Dr. Abdul Naser Arafat Keywords: urban, modifiable Areal Unit Problem, Transportation planning, GIS ABSTRACT The relationship
Transit Market Index. Validating Local Potential for Transit Ridership
 Transit Market Index Validating Local Potential for Transit Ridership Transit Market Areas Characteristics 2010 TPP Characterized by different levels of transit service. Core Areas, 1 & 2: A variety of
Managing Growth: Integrating Land Use & Transportation Planning
 Managing Growth: Integrating Land Use & Transportation Planning Metro Vancouver Sustainability Community Breakfast Andrew Curran Manager, Strategy June 12, 2013 2 Integrating Land Use & Transportation
The Spatial Structure of Cities: International Examples of the Interaction of Government, Topography and Markets
 Module 2: Spatial Analysis and Urban Land Planning The Spatial Structure of Cities: International Examples of the Interaction of Government, Topography and Markets Alain Bertaud Urbanist Summary What are
Transit Service Gap Technical Documentation
 Transit Service Gap Technical Documentation Introduction This document is an accompaniment to the AllTransit TM transit gap methods document. It is a detailed explanation of the process used to develop
Transit Time Shed Analyzing Accessibility to Employment and Services
 Transit Time Shed Analyzing Accessibility to Employment and Services presented by Ammar Naji, Liz Thompson and Abdulnaser Arafat Shimberg Center for Housing Studies at the University of Florida www.shimberg.ufl.edu
March 31, diversity. density. 4 D Model Development. submitted to: design. submitted by: destination
 March 31, 2010 diversity density 4 D Model Development submitted to: design submitted by: destination 4 D Model Development Team SANDAG: Mike Calandra Rick Curry Rob Rundle Parsons Brinckerhoff: Bill Davidson
The Influence of Land Use on Travel Behavior: Empirical Evidence from Santiago de Chile
 The Influence of Land Use on Travel Behavior: Empirical Evidence from Santiago de Chile Transportation Research Board (TRB) 83 rd Annual Meeting Washington, DC, January 2004 P. Christopher Zegras Massachusetts
Compact city policies: a comparative assessment
 Compact city policies: a comparative TADASHI MATSUMOTO Organisation for Economic Co-operation and Development (OECD) Presentation at the UNECE-OECD seminar September 26, 2012, Geneva Outline of the study
THE FUTURE OF FORECASTING AT METROPOLITAN COUNCIL. CTS Research Conference May 23, 2012
 THE FUTURE OF FORECASTING AT METROPOLITAN COUNCIL CTS Research Conference May 23, 2012 Metropolitan Council forecasts Regional planning agency and MPO for Twin Cities metropolitan area Operates regional
Neighborhood Locations and Amenities
 University of Maryland School of Architecture, Planning and Preservation Fall, 2014 Neighborhood Locations and Amenities Authors: Cole Greene Jacob Johnson Maha Tariq Under the Supervision of: Dr. Chao
Improving the Model s Sensitivity to Land Use Policies and Nonmotorized Travel
 Improving the Model s Sensitivity to Land Use Policies and Nonmotorized Travel presented to MWCOG/NCRTPB Travel Forecasting Subcommittee presented by John (Jay) Evans, P.E., AICP Cambridge Systematics,
Modeling the land-use correlates of vehicle-trip lengths for assessing the transportation impacts of land developments
 THE JOURL OF TRANSPORT AND LAND USE http://jtlu.org VOL. 6 NO. 2 [2013] pp. 59 75 doi: 10.5198/jtlu.v6i2.254 Modeling the land-use correlates of vehicle-trip lengths for assessing the transportation impacts
Regional Snapshot Series: Transportation and Transit. Commuting and Places of Work in the Fraser Valley Regional District
 Regional Snapshot Series: Transportation and Transit Commuting and Places of Work in the Fraser Valley Regional District TABLE OF CONTENTS Complete Communities Daily Trips Live/Work Ratio Commuting Local
(page 2) So today, I will be describing what we ve been up to for the last ten years, and what I think might lie ahead.
 So today, I will be describing what we ve been up to for the last ten years, and what I think might lie ahead.") Activity-Based Models: 1994-2009 MIT ITS Lab Presentation March 10, 2009 John L Bowman, Ph.D. John_L_Bowman@alum.mit.edu JBowman.net DAY ACTIVITY SCHEDULE APPROACH (page 1) In 1994, Moshe and I began developing
Activity-Based Models: 1994-2009 MIT ITS Lab Presentation March 10, 2009 John L Bowman, Ph.D. John_L_Bowman@alum.mit.edu JBowman.net DAY ACTIVITY SCHEDULE APPROACH (page 1) In 1994, Moshe and I began developing
PlaceTypes. How the built environment is measured. Variables Measures Levels. AREA TYPE + DEVELOPMENT TYPE = PlaceType
 PlaceTypes In order to better understand land use and transportation interactions and to make more informed policy decisions, neighborhood characteristics can be analyzed by the role that they play in
2040 MTP and CTP Socioeconomic Data
 SE Data 6-1 24 MTP and CTP Socioeconomic Data Purpose of Socioeconomic Data The socioeconomic data (SE Data) shows the location of the population and employment, median household income and other demographic
= 5342 words + 5 tables + 2 figures (250 words each) = 7092 words
 = 7092 words") Influence of Neighborhood Types on Trip Distances A Case Study of Central Ohio Gulsah Akar, PhD (Corresponding Author) Assistant Professor City and Regional Planning Knowlton School of Architecture The
Influence of Neighborhood Types on Trip Distances A Case Study of Central Ohio Gulsah Akar, PhD (Corresponding Author) Assistant Professor City and Regional Planning Knowlton School of Architecture The
To Drive or Not to Drive:
 To Drive or Not to Drive: A Study of the Influence of the Built Environment on Employee Travel Mode Choice in Chapel Hill by Jennifer C. Lewis A Masters Project submitted to the faculty of the University
Westside Extension Los Angeles, California
 Westside Extension Los Angeles, California Rail~Volution 2010 Portland, Oregon Monica Villalobos AECOM History of Westside Suburban Growth in the Westside (1920 1970 s) LA Centers Concept + Employment
King City URA 6D Concept Plan
 King City URA 6D Concept Plan King City s Evolution Among the fastest growing cities 2000 Census 1,949 2010 Census 3,111 60% increase 2016 Census estimate 3,817 23% increase Average annual rate 4.3% Surpassing
Vibrancy and Property Performance of Major U.S. Employment Centers. Appendix A
 Appendix A DOWNTOWN VIBRANCY SCORES Atlanta 103.3 Minneapolis 152.8 Austin 112.3 Nashville 83.5 Baltimore 151.3 New Orleans 124.3 Birmingham 59.3 New York Midtown 448.6 Charlotte 94.1 Oakland 157.7 Chicago
INCORPORATING URBAN DESIGN VARIABLES IN METROPOLITAN PLANNING ORGANIZATIONS TRAVEL DEMAND MODELS
 INCORPORATING URBAN DESIGN VARIABLES IN METROPOLITAN PLANNING ORGANIZATIONS TRAVEL DEMAND MODELS RONALD EASH Chicago Area Transportation Study 300 West Adams Street Chicago, Illinois 60606 Metropolitan
Kitsap County 2016 Comprehensive Plan Update. Appendix A: Growth Estimates
 Kitsap County 2016 Comprehensive Plan Update Appendix A: Growth Estimates Appendix A 1 April 2016 Kitsap County 2016 Comprehensive Plan Update Appendix A: Growth Estimates Land Capacity Land capacity
Forecasts for the Reston/Dulles Rail Corridor and Route 28 Corridor 2010 to 2050
 George Mason University Center for Regional Analysis Forecasts for the Reston/Dulles Rail Corridor and Route 28 Corridor 21 to 25 Prepared for the Fairfax County Department of Planning and Zoning Lisa
MULTIPLE CHOICE. Choose the one alternative that best completes the statement or answers the question.
 AP Test 13 Review Name MULTIPLE CHOICE. Choose the one alternative that best completes the statement or answers the question. 1) Compared to the United States, poor families in European cities are more
Transportation Statistical Data Development Report OKALOOSA-WALTON OUTLOOK 2035 LONG RANGE TRANSPORTATION PLAN
 Transportation Statistical Data Development Report OKALOOSA-WALTON OUTLOOK 2035 LONG RANGE TRANSPORTATION PLAN Prepared for the Okaloosa-Walton Transportation Planning Organization and The Florida Department
Local Economic Activity Around Rapid Transit Stations
 Local Economic Activity Around Rapid Transit Stations The Case of Chicago s Orange Line Julie Cooper, MPP 2014 Harris School of Public Policy Transport Chicago June 6, 2014 Motivation Impacts of transit
GIS Analysis of Crenshaw/LAX Line
 PDD 631 Geographic Information Systems for Public Policy, Planning & Development GIS Analysis of Crenshaw/LAX Line Biying Zhao 6679361256 Professor Barry Waite and Bonnie Shrewsbury May 12 th, 2015 Introduction
StanCOG Transportation Model Program. General Summary
 StanCOG Transportation Model Program Adopted By the StanCOG Policy Board March 17, 2010 What are Transportation Models? General Summary Transportation Models are technical planning and decision support
Taming the Modeling Monster
 Taming the Modeling Monster Starring: Ellen Greenberg Scott McCarey Jim Charlier Audience Poll, part 1 Elected Officials Board Members Public Staff Consultants Journalists Other Audience Poll, part 2 Modeling
Paul Waddell Professor, City and Regional Planning University of California, Berkeley Director, Urban Analy;cs Lab President, UrbanSim Inc.
 2017 Philomathia Forum Urban Data Science and Simula9on For Metropolitan Sustainability Paul Waddell Professor, City and Regional Planning University of California, Berkeley Director, Urban Analy;cs Lab
Modeling Mode in a Statewide Context
 Modeling Mode in a Statewide Context CDM Smith ADOT Transportation Planning Applications Conference May 6, 2013 Presentation Overview Development Team AZTDM3 Overview AZTDM3 Modes of Travel Transit Abstraction
Prepared for: San Diego Association Of Governments 401 B Street, Suite 800 San Diego, California 92101
 Activity-Based Travel Model Validation for 2012 Using Series 13 Data: Coordinated Travel Regional Activity Based Modeling Platform (CT-RAMP) for San Diego County Prepared for: San Diego Association Of
SBCAG Travel Model Upgrade Project 3rd Model TAC Meeting. Jim Lam, Stewart Berry, Srini Sundaram, Caliper Corporation December.
 SBCAG Travel Model Upgrade Project 3rd Model TAC Meeting Jim Lam, Stewart Berry, Srini Sundaram, Caliper Corporation December. 7, 2011 1 Outline Model TAZs Highway and Transit Networks Land Use Database
Trip Generation Model Development for Albany
 Trip Generation Model Development for Albany Hui (Clare) Yu Department for Planning and Infrastructure Email: hui.yu@dpi.wa.gov.au and Peter Lawrence Department for Planning and Infrastructure Email: lawrence.peter@dpi.wa.gov.au
1RYHPEHU 3UHSDUHGIRU 3HUIRUPDQFH0HDVXUHV6XEFRPPLWWHHRIWKH 2UHJRQ0RGHOLQJ6WHHULQJ&RPPLWWHH
 67$7,67,&$/$1$/
City of Hermosa Beach Beach Access and Parking Study. Submitted by. 600 Wilshire Blvd., Suite 1050 Los Angeles, CA
 City of Hermosa Beach Beach Access and Parking Study Submitted by 600 Wilshire Blvd., Suite 1050 Los Angeles, CA 90017 213.261.3050 January 2015 TABLE OF CONTENTS Introduction to the Beach Access and Parking
Access Across America: Transit 2017
 Access Across America: Transit 2017 Final Report Prepared by: Andrew Owen Brendan Murphy Accessibility Observatory Center for Transportation Studies University of Minnesota CTS 18-12 1. Report No. CTS
Does the Built Environment Make a Difference? An Investigation of Household Vehicle Use in Zhongshan Metropolitan Area, China
 Sustainability 2014, 6, 4910-4930; doi:10.3390/su6084910 Article OPEN ACCESS sustainability ISSN 2071-1050 www.mdpi.com/journal/sustainability Does the Built Environment Make a Difference? An Investigation
Chao Liu, Ting Ma, and Sevgi Erdogan National Center for Smart Growth Research & Education (NCSG) University of Maryland, College Park
 University of Maryland, College Park") Chao Liu, Ting Ma, and Sevgi Erdogan National Center for Smart Growth Research & Education (NCSG) University of Maryland, College Park 2015 GIS in Transit, September 1-3, 2015 Shared-use Vehicle Services
Chao Liu, Ting Ma, and Sevgi Erdogan National Center for Smart Growth Research & Education (NCSG) University of Maryland, College Park 2015 GIS in Transit, September 1-3, 2015 Shared-use Vehicle Services
Public Transportation Infrastructure Study (PTIS) - 2 nd Technical Advisory Committee Meeting
 - 2 nd Technical Advisory Committee Meeting") Public Transportation Infrastructure Study (PTIS) - 2 nd Technical Advisory Committee Meeting Presentation to: Technical Advisory Committee (TAC) Presented by: and Team July 8th, 2009 Public Transportation
Public Transportation Infrastructure Study (PTIS) - 2 nd Technical Advisory Committee Meeting Presentation to: Technical Advisory Committee (TAC) Presented by: and Team July 8th, 2009 Public Transportation
WOODRUFF ROAD CORRIDOR ORIGIN-DESTINATION ANALYSIS
 2018 WOODRUFF ROAD CORRIDOR ORIGIN-DESTINATION ANALYSIS Introduction Woodruff Road is the main road to and through the commercial area in Greenville, South Carolina. Businesses along the corridor have
Transit-Oriented Development. Christoffer Weckström
 Transit-Oriented Development Christoffer Weckström 31.10.2017 Outline Context of Transit-oriented Development Elements of Transit-oriented Development A short history of land use and transit integration
Creation of built environment indices
 Creation of built environment indices Daniel A. Rodriguez, Ph.D Department of City and Regional Planning, University of North Carolina, Chapel Hill with Lawrence J. Frank, Ph.D. Department of Community
East Bay BRT. Planning for Bus Rapid Transit
 East Bay BRT Planning for Bus Rapid Transit Regional Vision Draper Prison The Bottleneck is a State-Level issue, Salt Lake County 2050 Population: 1.5M Draper Prison hopefully with some State-Level funding!
TRANSPORT MODE CHOICE AND COMMUTING TO UNIVERSITY: A MULTINOMIAL APPROACH
 TRANSPORT MODE CHOICE AND COMMUTING TO UNIVERSITY: A MULTINOMIAL APPROACH Daniele Grechi grechi.daniele@uninsubria.it Elena Maggi elena.maggi@uninsubria.it Daniele Crotti daniele.crotti@uninsubria.it SIET
MEMORANDUM. Trip Generation Analysis
 MEMORANDUM To: RMC Architects From: Matthew Palmer, PE Subject: Trip Generation, Parking Analysis & Level of Service Project: Port of Everett, GTC #13-053 Date: August 25, 2014 The trip generation and
The effects of impact fees on urban form and congestion in Florida
 The effects of impact fees on urban form and congestion in Florida Principal Investigators: Andres G. Blanco Ruth Steiner Presenters: Hyungchul Chung Jeongseob Kim Urban and Regional Planning Contents
Typical information required from the data collection can be grouped into four categories, enumerated as below.
 Chapter 6 Data Collection 6.1 Overview The four-stage modeling, an important tool for forecasting future demand and performance of a transportation system, was developed for evaluating large-scale infrastructure
Encapsulating Urban Traffic Rhythms into Road Networks
 Encapsulating Urban Traffic Rhythms into Road Networks Junjie Wang +, Dong Wei +, Kun He, Hang Gong, Pu Wang * School of Traffic and Transportation Engineering, Central South University, Changsha, Hunan,
Trip Generation Study: A 7-Eleven Gas Station with a Convenience Store Land Use Code: 945
 Trip Generation Study: A 7-Eleven Gas Station with a Convenience Store Land Use Code: 945 Introduction The Brigham Young University Institute of Transportation Engineers student chapter (BYU ITE) completed
Land Use Impacts on Trip Generation Rates
 TRANSPORTATION RESEARCH RECORD 1518 1 Land Use Impacts on Trip Generation Rates REID EWING, MARYBETH DEANNA, AND SHI-CHIANG LI In the conventional four-step travel demand modeling process, the number of
Technical Memorandum #2 Future Conditions
 Technical Memorandum #2 Future Conditions To: Dan Farnsworth Transportation Planner Fargo-Moorhead Metro Council of Governments From: Rick Gunderson, PE Josh Hinds PE, PTOE Houston Engineering, Inc. Subject:
Overview of Improved Data and Tools for Integrated Land Use-Transportation Planning in California Caltrans Planning Horizons program November 7, 2012
 Overview of Improved Data and Tools for Integrated Land Use-Transportation Planning in California Caltrans Planning Horizons program November 7, 2012 Presentation Outline Part 1. Overview - Terry Parker,
I. M. Schoeman North West University, South Africa. Abstract
 Urban Transport XX 607 Land use and transportation integration within the greater area of the North West University (Potchefstroom Campus), South Africa: problems, prospects and solutions I. M. Schoeman
Douglas County/Carson City Travel Demand Model
 Douglas County/Carson City Travel Demand Model FINAL REPORT Nevada Department of Transportation Douglas County Prepared by Parsons May 2007 May 2007 CONTENTS 1. INTRODUCTION... 1 2. DEMOGRAPHIC INFORMATION...
Note on Transportation and Urban Spatial Structure
 Note on Transportation and Urban Spatial Structure 1 By Alain Bertaud, Washington, ABCDE conference, April 2002 Email: duatreb@msn.com Web site: http://alain-bertaud.com/ http://alainbertaud.com/ The physical
River North Multi-Modal Transit Analysis
 River North Multi-Modal Transit Analysis November 7, 2006 Dan Meyers, AICP URS Corporation 612-373-6446 / dan_meyers@urscorp.com River North Study Area Reasons for initiating the study Downtown areas north
REFINEMENT OF FSUTMS TRIP DISTRIBUTION METHODOLOGY
 REFINEMENT OF FSUTMS TRIP DISTRIBUTION METHODOLOGY Percentage of Trips (%) 10.00 9.00 8.00 7.00 6.00 5.00 4.00 3.00 2.00 1.00 Survey Destination Choice Model with Spatial Variables Destination Choice Model
Assessing the impact of urban form measures on nonwork trip mode choice after controlling for demographic and level-of-service effects
 Assessing the impact of urban form measures on nonwork trip mode choice after controlling for demographic and level-of-service effects Jayanthi Rajamani Department of Civil Engineering The University of
محاضرة رقم 4. UTransportation Planning. U1. Trip Distribution
 UTransportation Planning U1. Trip Distribution Trip distribution is the second step in the four-step modeling process. It is intended to address the question of how many of the trips generated in the trip
URBAN SPRAWL, COMMUTING, AND ACCESS TO PUBLIC TRANSPORTATION IN SELECTED SOUTHEASTERN METROPOLITAN AREAS
 Papers of the Applied Geography Conferences (2006) 29: 282-291 URBAN SPRAWL, COMMUTING, AND ACCESS TO PUBLIC TRANSPORTATION IN SELECTED SOUTHEASTERN METROPOLITAN AREAS Joe Weber Department of Geography
John Thomas & Lori Zeller US Environmental Protection Agency Office of Sustainable Communities. Rich Kuzmyak & Alex Bell Renaissance Planning Group
 Transportation Research Board ADD30 - Transportation and Land Development Committee Methods to Better Account for Land Use in Planning Multimodal Transportation Systems and Sustainable Communities Moderator:
THE LEGACY OF DUBLIN S HOUSING BOOM AND THE IMPACT ON COMMUTING
 Proceedings ITRN2014 4-5th September, Caulfield and Ahern: The Legacy of Dublin s housing boom and the impact on commuting THE LEGACY OF DUBLIN S HOUSING BOOM AND THE IMPACT ON COMMUTING Brian Caulfield
Keywords: Commuter Rail; Market Analysis; Commuter Rail Planning
 1 2 3 4 5 6 7 8 9 10 11 12 13 14 15 16 17 18 19 20 21 22 23 24 25 26 27 28 29 30 31 32 33 34 35 36 Analysis of the Variation in Apartment and Office Market Rents with Respect to Commuter Rail Transit Station
APPENDIX I: Traffic Forecasting Model and Assumptions
 APPENDIX I: Traffic Forecasting Model and Assumptions Appendix I reports on the assumptions and traffic model specifications that were developed to support the Reaffirmation of the 2040 Long Range Plan.
Transportation impacts of affordable housing: Informing development review with travel behavior analysis
 THE JOURNAL OF TRANSPORT AND LAND USE http://jtlu.org VOL. 11 NO. 1 [2018] pp. 103 118 Transportation impacts of affordable housing: Informing development review with travel behavior analysis Amanda Howell
Data Collection. Lecture Notes in Transportation Systems Engineering. Prof. Tom V. Mathew. 1 Overview 1
 Data Collection Lecture Notes in Transportation Systems Engineering Prof. Tom V. Mathew Contents 1 Overview 1 2 Survey design 2 2.1 Information needed................................. 2 2.2 Study area.....................................
Developing Built Environment Indicators for Urban Oregon. Dan Rubado, MPH EPHT Epidemiologist Oregon Public Health Division
 Developing Built Environment Indicators for Urban Oregon Dan Rubado, MPH EPHT Epidemiologist Oregon Public Health Division What is the built environment? The built environment encompasses spaces and places
Employment Decentralization and Commuting in U.S. Metropolitan Areas. Symposium on the Work of Leon Moses
 Employment Decentralization and Commuting in U.S. Metropolitan Areas Alex Anas Professor of Economics University at Buffalo Symposium on the Work of Leon Moses February 7, 2014 9:30-11:15am, and 2:30-4:30pm
OFFICE RENT PREMIUMS WITH RESPECT TO DISTANCE FROM LIGHT RAIL TRANSIT STATIONS IN DALLAS AND DENVER
 1 2 3 4 5 6 7 8 9 10 11 12 13 14 15 16 17 18 19 20 21 22 23 24 25 26 27 28 29 30 31 32 33 34 35 36 37 38 39 40 41 42 43 44 45 46 OFFICE RENT PREMIUMS WITH RESPECT TO DISTANCE FROM LIGHT RAIL TRANSIT STATIONS
Case Study: Orange County, California. Overview. Context
 Case Study: Orange County, California Overview The Orange County Transportation Authority (OCTA) provides transit service in a generally automobile-oriented part of southern California. Consequently, OCTA
A/Prof. Mark Zuidgeest ACCESSIBILITY EFFECTS OF RELOCATION AND HOUSING PROJECT FOR THE URBAN POOR IN AHMEDABAD, INDIA
 A/Prof. Mark Zuidgeest ACCESSIBILITY EFFECTS OF RELOCATION AND HOUSING PROJECT FOR THE URBAN POOR IN AHMEDABAD, INDIA South African Cities Network/University of Pretoria, 09 April 2018 MOBILITY Ability
Assessment of Models to Estimate Bus-Stop Level Transit Ridership using Spatial Modeling Methods
 Assessment of Models to Estimate Bus-Stop Level Transit Ridership using Spatial Modeling Methods Assessment of Models to Estimate Bus-Stop Level Transit Ridership using Spatial Modeling Methods Srinivas