John Thomas & Lori Zeller US Environmental Protection Agency Office of Sustainable Communities. Rich Kuzmyak & Alex Bell Renaissance Planning Group
|
|
|
- Marylou Booth
- 5 years ago
- Views:
Transcription

1 Transportation Research Board ADD30 - Transportation and Land Development Committee Methods to Better Account for Land Use in Planning Multimodal Transportation Systems and Sustainable Communities Moderator: John L. Renne, Chair, TRB Transportation and Land Development Committee December 10, :00pm Eastern Rich Kuzmyak & Alex Bell Renaissance Planning Group John Thomas & Lori Zeller US Environmental Protection Agency Office of Sustainable Communities
2 TRB Transportation and Land Development Committee (ADD30) Mission: To look at the interrelationships between transportation and land use and development, including but not limited to the following: the effect that transportation has on urban form and development, the effects of urban form, development and design on travel behavior, and tools and techniques for understanding and influencing the above. 32 Committee Members Friends on Google Groups To join Google Group as Friend, please John Renne at jrenne@fau.edu Early 2016 Committee Rotation One-third of the committee spots must be rotated per TRB rules All Are Welcome - Annual Meeting, Tuesday, January 12, from 8 am - Noon in the Marriott Marquis
3 Next speaker John Thomas: Director of the Community Assistance and Research Division in the Office of Sustainable Communities at the US Environmental Protection Agency. Works on sustainable transportation and land use planning issues at the Federal level and provides technical assistance to state and local governments. Adjunct Professor at George Washington University.
4 Key themes webinar will address Multimodal accessibility Land use interaction and influence on accessibility Tools for exploring these interactions How communities, researchers, planners and leaders can take advantage of these tools to create more connected, sustainable communities
5 Background: EPA s Smart Growth Program Helps communities pursue smart growth strategies through: Grants and technical assistance Partnerships Research and tool development


6 Urban Form and Travel D Variables 4 Units per Acre Density Diversity Design of Street Network 11 Units per Acre Destination Accessibility Distance to Transit Image sources: Lincoln Land Institute s Visualizing Density and Victor Dover
7 Next speaker Rich Kuzmyak, Principal - Transportation planner and research analyst with more than 30 years experience - Specialize in quantifying relationships between transportation and land use - Created Ds models for estimating travel behavior in relation to land use in Los Angeles, Phoenix, Baltimore, other places - Recent manager of NCHRP Project (Report 770) used accessibility methods to estimate demand for bicycle and pedestrian travel
8 Background: Renaissance Planning Key mission: To help build cities that work Urban design + transportation/land use integration Works with communities in the application of smart growth approaches
9 Webinar outline EPA s Smart Location Database: Purpose, use and demo Examples of use: AARP Livability Index, GSA Smart Location Calculator, EPA Walkability Index Renaissance Activities and Tools: Research on Multimodal Accessibility Methods Applications for State/MPO/local planning & project prioritization
10 Next speaker Lori Zeller ORISE Fellow in the Office of Sustainable Communities at the US Environmental Protection Agency Research focuses on reducing vehicle miles traveled and greenhouse gas emissions through tools and resources promoting location efficiency and active transportation. Master in City and Regional Planning from the Bloustein School of Planning and Public Policy at Rutgers, the State University of New Jersey.

11 EPA s Smart Location Database Lori Zeller US Environmental Protection Agency Office of Sustainable Communities
12 The Smart Location Database (SLD) and community solutions for multimodal accessibility Jobs within a 45 minute transit ride
 and community solutions")

13 The Smart Location Database (SLD) and community solutions for multimodal accessibility Low income workers (home location)
 0 25 26 50 51 100 101 200 201 500 501 750 751 1,000 1,001 5,000 5,001 10,000 >")
14 The Smart Location Database (SLD) and community solutions for multimodal accessibility Low income workers (work location) ,000 1,001 5,000 5,001 10,000 > 10,000
15 Lightning SLD Demo! Play along here: Scroll to Smart Location Database and click Interactive map viewer Note: some of these processes take more than a splitsecond to complete, so for the purpose of conducting a speedy webinar demo, I will be using screenshots


16 Online interactive map viewer Clip n Ship Complete dataset for download smart-location-mapping#sld
17 Lightning SLD Demo: Slide 1/9 What you see when you navigate to SLD interactive map
 enter any address or city, state, and SLD will jump to that location")
18 Lightning SLD Demo: Slide 2/9 Scroll down to see variety of SLD attributes with premade layers Also note the search bar (red arrow pointing) enter any address or city, state, and SLD will jump to that location
19 Lightning SLD Demo: Slide 3/9 Click left-most icon (looks like a list) to see the legend for attribute
20 Lightning SLD Demo: Slide 4/9 Click on a block group and a pop-up appears with block group data
21 Lightning SLD Demo: Slide 5/9 Want to change color scheme? Classification system? Change the attribute? To do this, click on the icon with small shapes (circled in red)
22 Lightning SLD Demo: Slide 6/9 Use the drop-down menu to choose a new attribute from the SLD to display. Refer to the user guide for attribute definitions. SLD User Guide: /production/files/ /documents/sld_usergu ide.pdf % households in block group with 0 automobiles
 attribute by another")
23 Lightning SLD Demo: Slide 7/9 Option to normalize (divide) attribute by another attribute

24 Lightning SLD Demo: Slide 8/9 Opportunity to change color scheme
25 Lightning SLD Demo: Slide 9/9 Opportunity to change classification method and number of classes
26 Highlights of SLD attributes for use in multimodal accessibility research Activity density % households with zero automobiles

27 Activity density (housing and jobs per acre) Significance: dense activity centers in a region demand access via regular transit service Use: compare activity density to transit service frequency to determine gaps

28 % households with zero automobiles Significance: demand for multimodal transportation options is high in areas with high proportion of zero-car households Use: examine multimodal transportation network performance for these areas (bike & ped network, transit)
29 The SLD as a resource Other organizations and agencies using SLD data for mapping applications and as a decision-making tool AARP s Livability Index GSA s Smart Location Calculator EPA s Walkability Index Can be navigated by anyone interactive online map for novice mappers download geodatabase/shapefile for experienced mappers

30 AARP s Livability Index SLD data used in 2 of the 7 factors for Transportation: - Frequency of local transit service - Walk trips


31 GSA s Smart Location Calculator Measuring the environmental benefits of workplace location efficiency. Address search: Location Score: 72 (Good)? 72?
32 GSA s Smart Location Calculator Modeling VMT generation per worker by block group (variables from SLD highlighted in green) Household income Gender Vehicles per household Gas price Regional compactness score Regional land area Regional transit unlinked trips per capita Residential density Employment density Employment mix Trip production and attraction index Auto- and pedestrianoriented intersection density Distance to transit Proportion of employment near rail station Transit service frequency Accessibility by workers via auto and transit
33 EPA s Walkability Index Why Walkable communities growing in popularity around country Many factors determine walkability, no central definition or index Desire for transparent walkability data for communities and researchers to utilize How A weighted index calculated using 4 variables from SLD: High intersection density Close proximity to transit stops High diversity of business uses High diversity of business and residential uses

34 EPA s Walkability Index Least walkable Below average Above average Most walkable
35 Concluding thoughts Beneficial for regional land use planning, transportation planning and facility siting Tools for wide audiences Need for regular updates as transportation networks and development change over time
36 The Growing Role of Accessibility In Transportation and Land Use Planning Rich Kuzmyak and Alex Bell Renaissance Planning
37 WHAT IS ACCESSIBILITY & HOW IS IT MEASURED? Accessibility measures opportunity how much stuff can I get to in X miles or Y minutes? Kinds of stuff: Employment/Jobs Shopping, Schools, Health Care, Essential Services, Recreation Mode Neutral not just about speed Measurement techniques: Simple count More complex: put weights on travel time or activity type Score
38 RELATION TO THE Ds IN SLD DATABASE Density One of the Original Ds: Access to Destinations Diversity Design Destinations Distance to Transit Demographics D5ar D5ae D5br D5be Accessibility Variables in SLD Jobs within 45 minutes auto travel time, time-decay (network travel time) weighted Working age population within 45 minutes auto travel time, time-decay (network travel time) weighted Jobs within 45-minute transit commute, distance decay (walk network travel time, GTFS schedules) weighted Working-age population within 45-minute transit commute, time decay (walk network travel time, GTFS schedules) weighted Demand Management

39 CONTRASTING ACCESSIBILITY WITH THE OTHER Ds Local Design (neighborhood) 3Ds Regional Accessibility 4th D Travel Behavior = f (demographics, local design, regional accessibility)
 Major role for GIS data/tools")
40 Purpose: Develop responsive tools for estimating bike/walk demand Goal: Account for Effects of: Land Use Facilities Impact on motorized travel Response: Original research & tool development (Washington DC & Seattle) Major role for GIS data/tools
41 Seattle/ PSRC Tour Generation & Mode Choice Enhanced 4-Step Process All Rely on Accessibility Relationships Arlington/ MWCOG GIS-Based Accessibility Approach
 intuitive, visual Unusually good data & MPO support Arlington County = Smart Growth laboratory!")
42 ARLINGTON GIS ACCESSIBILITY MODEL Multiple Contributing Factors Needed fine geospatial resolution for walk/bike strength of GIS Liked Walk Score (Transit Score, Bike Score) intuitive, visual Unusually good data & MPO support Arlington County = Smart Growth laboratory! Creative project team GIS skills

43 GIS Enables Data Sources to Talk to Each Other Land Use Transportation Network InfoUSA Employment Data NAVTEQ Digitized Networks
")


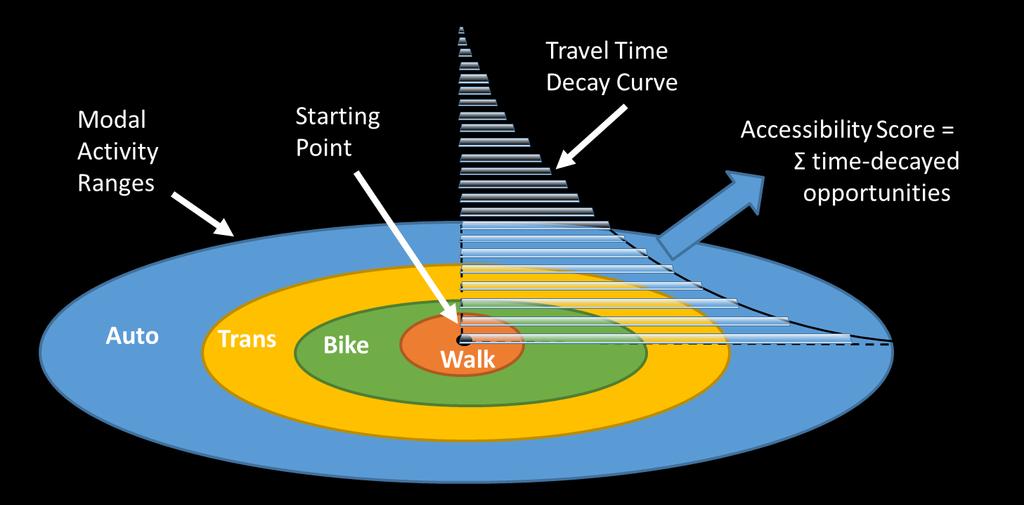
44 CALCULATING ACCESSIBILITY SCORES THROUGH GIS OVERLAY METHODS Where: OPPORTUNITIES = Number of Jobs (HBW) or Number of Retail/Service Establishments (HBNW) TRAVEL TIME = Time to reach opportunity over actual network (Network Analyst) DECAY* = Factor reflecting decrease in value of opportunities that are farther away
45 Percent of Trips which are Longer Than Percent of Trips Which Are Longer Than TRAVEL TIME DECAY A CRITICAL ELEMENT Travel Time Decay Walking for Work Trips Travel Time Decay -- Walking for Non-Work Trips requiring 15 minutes have only 37% of the value of trips < I minute Trips requiring 15 minutes have only 23% of the value of trips < I minute y = 100e -0.07x R² = y = 100e x R² = Minutes Minutes
46 Decay Factor DECAY RATES CALCULATED FOR: Each Mode Auto Transit Walk Trip Purpose Work Non-Work auto hbw transit hbw walk hbw auto hbo transit hbo walk hbo Travel Time (Minutes)
47 ACCESSIBILITY CALCULATION


48 WHAT THE SCORES LOOK LIKE (AND BEGIN TO TELL US)
 Logan Circle 41% Clarendon 21% McLean")
49 ACCESSIBILITY S INFLUENCE ON MODE CHOICE It s the RATIOS that really matter! Non-Motorized Mode Share (HH survey) Logan Circle 41% Clarendon 21% McLean 8%

50 Percent Auto (from ACS JTW) USING THE RATIO RELATIONSHIPS: Transit-to-Auto Ratio in SLD Explains Mode Shares Auto vs Transit Mode Split for Work Trips in Virginia Using Auto & Transit Accessibility Scores in SLD Transit-to-Auto Accessibility Ratio
51 USING ACCESSIBILITY SCORES TO CALIBRATE MODE SHARE MODEL * Auto Score Transit Score Walk Score Mode Share Model MPO Travel Survey Data Mode Share for Work Trips: Auto Transit (drive access) Transit (walk access) Walk Mode Share for Non-Work Trips: Auto Driver Auto Passenger Transit Walk * Discussed later in Maryland DOT Multimodal Corridor Study
52 USING SCORES TO ESTIMATE VMT* MPO Travel Survey Data Regression Models Modal Accessibility Scores Household Auto Ownership = HH Size HH Income Transit/Auto Ratio Walk Score (-24.3) (-29.1) R 2 = n = 13,700 Daily Household VMT = HH Size HH Income HH Vehicles Transit/Auto Ratio Walk Score (-19.4) (-10.6) R 2 = n = 13,700 * Discussed later in MWCOG GHG Study

53 RESULT: A COMPREHENSIVE AND VERSATILE PLANNING FRAMEWORK ACCESSIBILITY = Land Use Transportation Network Opportunities Number Density Diversity Design Travel Time Connectivity Directness Safety
54 Application Examples Alex Bell, AICP Senior Planner at Renaissance (Durham office) M.A. in Urban Planning Lead architect in Renaissance s accessibility work Arlington Accessibility Model (NCHRP 770) Project manager on the Smart Location Database
55 ACCESSIBILITY APPLICATIONS Assessing Walkability in Shirlington, VA Transportation Network Plan for Asheville, NC Design Guidelines for Affordable Housing in Washington, DC Impact of Alternative Land Use Scenarios for GHG Reduction for Metropolitan Washington Council of Governments Multimodal Corridor Study for Maryland Department of Transportation Project Prioritization for Virginia Department of Transportation
56 DIAGNOSTICS PLANNING PROGRAMMING


57 ESTIMATING WALKING POTENTIALS IN SHIRLINGTON VA (NCHRP REPORT 770)


58 SERVING UNMET WALK OPPORTUNITIES THROUGH NETWORK IMPROVEMENTS Major attractions Major productions No-man s land New link results in 500 new walk trips

59 ASHEVILLE EAST OF THE RIVERWAY TRANSPORTATION PLAN Improve connectivity to, from and within the area Strengthen existing neighborhoods Improve multimodal access to jobs, housing, services Reduce vehicle dependency and VMT


60 CREATING NEW WALK OPPORTUNITIES THROUGH LAND USE CHANGES Problem: limited access to food stores for southern portion of study area Best solution: provide new food market! Existing markets too far for walking
61 DIAGNOSTICS PLANNING PROGRAMMING
 access to key opportunities Jobs Schools Fresh food retailers Health care & services Parks & open space Limit exposure to: Environmental hazards Liquor")
62 HEALTHY DESIGN FOR AFFORDABLE HOUSING IN WASHINGTON, DC Develop guidelines for optimal locations for affordable housing based on: Multimodal transportation (walk, bike, transit) access to key opportunities Jobs Schools Fresh food retailers Health care & services Parks & open space Limit exposure to: Environmental hazards Liquor stores


63 ASSESSING SUITABILITY FOR AFFORDABLE HOUSING BASED ON ACCESSIBILITY
64 USING ACCESSIBILITY FOR SCENARIO PLANNING AND GHG MITIGATION Metropolitan Washington COG evaluating strategies to meet regional GHG reduction goals Alternative Land Use a key strategy Shift more future jobs and HHs into Activity Centers especially with premium transit (TODs) Improve regional jobs/housing balance Insufficient time/resources to use regional model

65 APPROACH & FINDINGS Carve region into rings and corridors Delineate TODs & Activity Centers by TAZ Reallocate new jobs & HHs to TODs and ACs Develop VMT Model from Accessibility Scores Use VMT rates to reallocate growth Recalculate accessibility scores and VMT rates Estimate impact 14% reduction in 2040 VMT

66 STATE DOT TOOLS FOR MULTIMODAL PLANNING Maryland DOT looking to accessibility for improved planning and policy support Gaps in existing tools Important to know about land use, transit, non-motorized modes Exploring accessibility to better understand mode choice, transportation-land use interactions

67 GETTING BELOW THE TAZ SCALE Gain sensitivity to land uses, non-motorized accessibility, access to transit

68 ESTIMATING MODE SHARE USING ACCESSIBILITY SCORES 5.0% 35.6% 10.7% 2.1% 45.9% 6.9% 8.7% Auto driver 73.8% Auto passenger Transit 5.4% 12.1% 6.8% 67.8% Walk 4.2% 6.9% 11.1% 77.7%
69 DIAGNOSTICS PLANNING PROGRAMMING
70 USING ACCESSIBILITY TO PRIORITIZE PROJECTS UNDER HB 2 IN VIRGINIA Focus transportation planning and programming on the true purpose of transportation: connecting people and goods Provide a consistent means of evaluating projects across modes and jurisdictions
71 RANKING PROJECTS BY ACCESSIBILITY IMPROVEMENT

72 RANKING PROJECTS BY ACCESSIBILITY IMPROVEMENT Common metric for a variety of project types Highway capacity Transit Interchange improvement
73 Accessibility Methods Summary Accessibility methods are greatly increasing our ability to analyze and intervene on key planning and policy questions Get to the heart of MAP-21 goals for multimodal planning, performance measures, and connectivity Expect to see current limitations in access to these tools remedied through software enhancements and continued testing and application.
74 Summary & Concluding Thoughts Demands on planning and analysis tools are growing Strong awareness of relationship between land use and transportation Tools are evolving in response EPA s Smart Location Database & related tools Proliferation and use of GIS and Accessibility-based methods Recognize diverse audience for tools State DOTs and MPOs scenario planning, multimodal needs assessment, project prioritization Transit agencies land use and access at both trip ends is critical Local Jurisdictions comprehensive and master planning, project design National MAP -21 call for multimodal performance measures
75 Questions Welcome
Transit Time Shed Analyzing Accessibility to Employment and Services
 Transit Time Shed Analyzing Accessibility to Employment and Services presented by Ammar Naji, Liz Thompson and Abdulnaser Arafat Shimberg Center for Housing Studies at the University of Florida www.shimberg.ufl.edu
Figure 8.2a Variation of suburban character, transit access and pedestrian accessibility by TAZ label in the study area
 Figure 8.2a Variation of suburban character, transit access and pedestrian accessibility by TAZ label in the study area Figure 8.2b Variation of suburban character, commercial residential balance and mix
Speakers: Jeff Price, Federal Transit Administration Linda Young, Center for Neighborhood Technology Sofia Becker, Center for Neighborhood Technology
 Speakers: Jeff Price, Federal Transit Administration Linda Young, Center for Neighborhood Technology Sofia Becker, Center for Neighborhood Technology Peter Haas, Center for Neighborhood Technology Craig
Impact of Metropolitan-level Built Environment on Travel Behavior
 Impact of Metropolitan-level Built Environment on Travel Behavior Arefeh Nasri 1 and Lei Zhang 2,* 1. Graduate Research Assistant; 2. Assistant Professor (*Corresponding Author) Department of Civil and
PlaceTypes. How the built environment is measured. Variables Measures Levels. AREA TYPE + DEVELOPMENT TYPE = PlaceType
 PlaceTypes In order to better understand land use and transportation interactions and to make more informed policy decisions, neighborhood characteristics can be analyzed by the role that they play in
Forecasts for the Reston/Dulles Rail Corridor and Route 28 Corridor 2010 to 2050
 George Mason University Center for Regional Analysis Forecasts for the Reston/Dulles Rail Corridor and Route 28 Corridor 21 to 25 Prepared for the Fairfax County Department of Planning and Zoning Lisa
2040 MTP and CTP Socioeconomic Data
 SE Data 6-1 24 MTP and CTP Socioeconomic Data Purpose of Socioeconomic Data The socioeconomic data (SE Data) shows the location of the population and employment, median household income and other demographic
Neighborhood Locations and Amenities
 University of Maryland School of Architecture, Planning and Preservation Fall, 2014 Neighborhood Locations and Amenities Authors: Cole Greene Jacob Johnson Maha Tariq Under the Supervision of: Dr. Chao
April 18, Accessibility and Smart Scale: Using Access Scores to Prioritize Projects
 Accessibility and Smart Scale: Using Access Scores to Prioritize Projects April 18, 2017 Accessibility and Smart Scale: Using Access Scores to Prioritize Projects State Smart Transportation Initiative
California Urban Infill Trip Generation Study. Jim Daisa, P.E.
 California Urban Infill Trip Generation Study Jim Daisa, P.E. What We Did in the Study Develop trip generation rates for land uses in urban areas of California Establish a California urban land use trip
Understanding Land Use and Walk Behavior in Utah
 Understanding Land Use and Walk Behavior in Utah 15 th TRB National Transportation Planning Applications Conference Callie New GIS Analyst + Planner STUDY AREA STUDY AREA 11 statistical areas (2010 census)
Density and Walkable Communities
 Density and Walkable Communities Reid Ewing Professor & Chair City and Metropolitan Planning University of Utah ewing@arch.utah.edu Department of City & Metropolitan Planning, University of Utah MRC Research
StanCOG Transportation Model Program. General Summary
 StanCOG Transportation Model Program Adopted By the StanCOG Policy Board March 17, 2010 What are Transportation Models? General Summary Transportation Models are technical planning and decision support
FHWA GIS Outreach Activities. Loveland, Colorado April 17, 2012
 FHWA GIS Outreach Activities Loveland, Colorado April 17, 2012 GIS for Improved Decision Making FHWA believes that geographic information systems and other geospatial technologies (remote sensing and GPS)
Improving the Model s Sensitivity to Land Use Policies and Nonmotorized Travel
 Improving the Model s Sensitivity to Land Use Policies and Nonmotorized Travel presented to MWCOG/NCRTPB Travel Forecasting Subcommittee presented by John (Jay) Evans, P.E., AICP Cambridge Systematics,
Guidelines on Using California Land Use/Transportation Planning Tools
 Guidelines on Using California Land Use/Transportation Planning Tools 1. Selecting Ds Analysis Modules Appropriate to a Region In almost all cases, the appropriate Ds Analysis Module to use for analysis
Committee Meeting November 6, 2018
 Committee Meeting November 6, 2018 Agenda Where we are in the process Land Use Plan Transportation Element Housing & Neighborhoods Elements Next Steps Schedule November 6: Plan Elements December: Plan
East Bay BRT. Planning for Bus Rapid Transit
 East Bay BRT Planning for Bus Rapid Transit Regional Vision Draper Prison The Bottleneck is a State-Level issue, Salt Lake County 2050 Population: 1.5M Draper Prison hopefully with some State-Level funding!
Overview of Improved Data and Tools for Integrated Land Use-Transportation Planning in California Caltrans Planning Horizons program November 7, 2012
 Overview of Improved Data and Tools for Integrated Land Use-Transportation Planning in California Caltrans Planning Horizons program November 7, 2012 Presentation Outline Part 1. Overview - Terry Parker,
Knowledge claims in planning documents on land use and transport infrastructure impacts
 Knowledge claims in planning documents on land use and transport infrastructure impacts Presentation at the Final Workshop of the research project "Innovations for sustainable public transport in Nordic
MPOs SB 375 LAFCOs SCAG Practices/Experiences And Future Collaborations with LAFCOs
 Connecting LAFCOs and COGs for Mutual Benefits MPOs SB 375 LAFCOs SCAG Practices/Experiences And Future Collaborations with LAFCOs Frank Wen, Manager Research & Analysis Land Use & Environmental Planning
BROOKINGS May
 Appendix 1. Technical Methodology This study combines detailed data on transit systems, demographics, and employment to determine the accessibility of jobs via transit within and across the country s 100
GIS Analysis of Crenshaw/LAX Line
 PDD 631 Geographic Information Systems for Public Policy, Planning & Development GIS Analysis of Crenshaw/LAX Line Biying Zhao 6679361256 Professor Barry Waite and Bonnie Shrewsbury May 12 th, 2015 Introduction
Transit Service Gap Technical Documentation
 Transit Service Gap Technical Documentation Introduction This document is an accompaniment to the AllTransit TM transit gap methods document. It is a detailed explanation of the process used to develop
The 3V Approach. Transforming the Urban Space through Transit Oriented Development. Gerald Ollivier Transport Cluster Leader World Bank Hub Singapore
 Transforming the Urban Space through Transit Oriented Development The 3V Approach Gerald Ollivier Transport Cluster Leader World Bank Hub Singapore MDTF on Sustainable Urbanization The China-World Bank
Developing Built Environment Indicators for Urban Oregon. Dan Rubado, MPH EPHT Epidemiologist Oregon Public Health Division
 Developing Built Environment Indicators for Urban Oregon Dan Rubado, MPH EPHT Epidemiologist Oregon Public Health Division What is the built environment? The built environment encompasses spaces and places
PLANNING FOR TOD IN SMART CITIES
 PLANNING FOR TOD IN SMART CITIES Making transit a preferred choice, not the only choice! Dr. Yamini J. Singh*, Dr. Johannes Flacke^ and Prof. M.F.A.M. van Maarseveen^ * Founder Director, Planit, The Netherlands
ADDRESSING TITLE VI AND ENVIRONMENTAL JUSTICE IN LONG-RANGE TRANSPORTATION PLANS
 ADDRESSING TITLE VI AND ENVIRONMENTAL JUSTICE IN LONG-RANGE TRANSPORTATION PLANS Activities from the National Capital Region Transportation Planning Board Sergio Ritacco Transportation Planner 2017 Association
Date: June 19, 2013 Meeting Date: July 5, Consideration of the City of Vancouver s Regional Context Statement
 Section E 1.5 To: From: Regional Planning and Agriculture Committee Lee-Ann Garnett, Senior Regional Planner Planning, Policy and Environment Department Date: June 19, 2013 Meeting Date: July 5, 2013 Subject:
Regional Growth Strategy Regional TOD Advisory Committee
 Regional Strategy Regional TOD Advisory Committee September 21, 2018 Overview Regional Geographies Transit-Oriented Development Goal Scenarios Next Steps 2 Schedule + Process September 6 Management Policy
Regional Performance Measures
 G Performance Measures Regional Performance Measures Introduction This appendix highlights the performance of the MTP/SCS for 2035. The performance of the Revenue Constrained network also is compared to
Taming the Modeling Monster
 Taming the Modeling Monster Starring: Ellen Greenberg Scott McCarey Jim Charlier Audience Poll, part 1 Elected Officials Board Members Public Staff Consultants Journalists Other Audience Poll, part 2 Modeling
MOR CO Analysis of future residential and mobility costs for private households in Munich Region
 MOR CO Analysis of future residential and mobility costs for private households in Munich Region The amount of the household budget spent on mobility is rising dramatically. While residential costs can
Mapping Accessibility Over Time
 Journal of Maps, 2006, 76-87 Mapping Accessibility Over Time AHMED EL-GENEIDY and DAVID LEVINSON University of Minnesota, 500 Pillsbury Drive S.E., Minneapolis, MN 55455, USA; geneidy@umn.edu (Received
CRP 608 Winter 10 Class presentation February 04, Senior Research Associate Kirwan Institute for the Study of Race and Ethnicity
 CRP 608 Winter 10 Class presentation February 04, 2010 SAMIR GAMBHIR SAMIR GAMBHIR Senior Research Associate Kirwan Institute for the Study of Race and Ethnicity Background Kirwan Institute Our work Using
HORIZON 2030: Land Use & Transportation November 2005
 PROJECTS Land Use An important component of the Horizon transportation planning process involved reviewing the area s comprehensive land use plans to ensure consistency between them and the longrange transportation
The Built Environment, Car Ownership, and Travel Behavior in Seoul
 The Built Environment, Car Ownership, and Travel Behavior in Seoul Sang-Kyu Cho, Ph D. Candidate So-Ra Baek, Master Course Student Seoul National University Abstract Although the idea of integrating land
Local Economic Activity Around Rapid Transit Stations
 Local Economic Activity Around Rapid Transit Stations The Case of Chicago s Orange Line Julie Cooper, MPP 2014 Harris School of Public Policy Transport Chicago June 6, 2014 Motivation Impacts of transit
Spatial Organization of Data and Data Extraction from Maptitude
 Spatial Organization of Data and Data Extraction from Maptitude N. P. Taliceo Geospatial Information Sciences The University of Texas at Dallas UT Dallas GIS Workshop Richardson, TX March 30 31, 2018 1/
An online data and consulting resource of THE UNIVERSITY OF TOLEDO THE JACK FORD URBAN AFFAIRS CENTER
 An online data and consulting resource of THE JACK FORD URBAN AFFAIRS CENTER THE CENTER FOR GEOGRAPHIC INFORMATION SCIENCE AND APPLIED GEOGRAPHICS DEPARTMENT OF GEOGRAPHY AND PLANNING THE UNIVERSITY OF
Regional Performance Measures
 G Performance Measures Regional Performance Measures Introduction This appendix highlights the performance of the MTP/SCS for 2035. The performance of the Revenue Constrained network also is compared to
Proposed Scope of Work Village of Farmingdale Downtown Farmingdale BOA Step 2 BOA Nomination Study / Draft Generic Environmental Impact Statement
 Proposed Scope of Work Village of Farmingdale Downtown Farmingdale BOA Step 2 BOA Nomination Study / Draft Generic Environmental Impact Statement The scope of work that follows incorporates and covers
March 31, diversity. density. 4 D Model Development. submitted to: design. submitted by: destination
 March 31, 2010 diversity density 4 D Model Development submitted to: design submitted by: destination 4 D Model Development Team SANDAG: Mike Calandra Rick Curry Rob Rundle Parsons Brinckerhoff: Bill Davidson
How GIS based Visualizations Support Land Use and Transportation Modeling
 How GIS based Visualizations Support Land Use and Transportation Modeling ESRI International Users Conference San Diego, CA - July 23, 2015 Prepared by: Troy Hightower Introduction This presentation will
Travel behavior of low-income residents: Studying two contrasting locations in the city of Chennai, India
 Travel behavior of low-income residents: Studying two contrasting locations in the city of Chennai, India Sumeeta Srinivasan Peter Rogers TRB Annual Meet, Washington D.C. January 2003 Environmental Systems,
THE FUTURE OF FORECASTING AT METROPOLITAN COUNCIL. CTS Research Conference May 23, 2012
 THE FUTURE OF FORECASTING AT METROPOLITAN COUNCIL CTS Research Conference May 23, 2012 Metropolitan Council forecasts Regional planning agency and MPO for Twin Cities metropolitan area Operates regional
Frequently Asked Questions
 What is the Regional Transit Engagement Series? As one of the fastest growing regions in the country, there is recognition that long-term transit planning efforts should be accelerated if we are to remain
CORRIDORS OF FREEDOM Access Management (Ability) Herman Pienaar: Director City Transformation and Spatial Planning
 Herman Pienaar: Director City Transformation and Spatial Planning") CORRIDORS OF FREEDOM Access Management (Ability) 2016 Herman Pienaar: Director City Transformation and Spatial Planning PLANNING DEVELOPMENT PROCESS RATHER THAN A PLAN CAPITAL INVESTMENT DEVELOPMENT FACILITATION
CORRIDORS OF FREEDOM Access Management (Ability) 2016 Herman Pienaar: Director City Transformation and Spatial Planning PLANNING DEVELOPMENT PROCESS RATHER THAN A PLAN CAPITAL INVESTMENT DEVELOPMENT FACILITATION
Regional Growth Strategy Work Session Growth Management Policy Board
 Regional Growth Strategy Work Session Growth Management Policy Board September 6, 2018 1 Overview Recap June GMPB work session Objectives and outcomes Regional geographies Growth scenarios Breakout Discussion:
Land Use Advisory Committee. Updating the Transit Market Areas
 Land Use Advisory Committee Updating the Transit Market Areas March 20, 2014 Agenda Transit Market Areas Purpose of Transit Market Areas Transit Market Index Current Market Area boundaries Updating the
Transit Market Index. Validating Local Potential for Transit Ridership
 Transit Market Index Validating Local Potential for Transit Ridership Transit Market Areas Characteristics 2010 TPP Characterized by different levels of transit service. Core Areas, 1 & 2: A variety of
Encapsulating Urban Traffic Rhythms into Road Networks
 Encapsulating Urban Traffic Rhythms into Road Networks Junjie Wang +, Dong Wei +, Kun He, Hang Gong, Pu Wang * School of Traffic and Transportation Engineering, Central South University, Changsha, Hunan,
Foreword. Vision and Strategy
 GREATER MANCHESTER SPATIAL FRAMEWORK Friends of Walkden Station Consultation Response January 2017 Foreword Friends of Walkden Station are a group of dedicated volunteers seeking to raise the status and
Chao Liu, Ting Ma, and Sevgi Erdogan National Center for Smart Growth Research & Education (NCSG) University of Maryland, College Park
 University of Maryland, College Park") Chao Liu, Ting Ma, and Sevgi Erdogan National Center for Smart Growth Research & Education (NCSG) University of Maryland, College Park 2015 GIS in Transit, September 1-3, 2015 Shared-use Vehicle Services
Chao Liu, Ting Ma, and Sevgi Erdogan National Center for Smart Growth Research & Education (NCSG) University of Maryland, College Park 2015 GIS in Transit, September 1-3, 2015 Shared-use Vehicle Services
Urban Planning Word Search Level 1
 Urban Planning Word Search Level 1 B C P U E C O S Y S T E M P A R E U O E U R B A N P L A N N E R T N S T D H E C O U N T Y G E R E R D W R E N I C I T Y C O U N C I L A A A S U G G C I L A G P R I R
Appendixx C Travel Demand Model Development and Forecasting Lubbock Outer Route Study June 2014
 Appendix C Travel Demand Model Development and Forecasting Lubbock Outer Route Study June 2014 CONTENTS List of Figures-... 3 List of Tables... 4 Introduction... 1 Application of the Lubbock Travel Demand
Analysis and Design of Urban Transportation Network for Pyi Gyi Ta Gon Township PHOO PWINT ZAN 1, DR. NILAR AYE 2
 www.semargroup.org, www.ijsetr.com ISSN 2319-8885 Vol.03,Issue.10 May-2014, Pages:2058-2063 Analysis and Design of Urban Transportation Network for Pyi Gyi Ta Gon Township PHOO PWINT ZAN 1, DR. NILAR AYE
Westside Extension Los Angeles, California
 Westside Extension Los Angeles, California Rail~Volution 2010 Portland, Oregon Monica Villalobos AECOM History of Westside Suburban Growth in the Westside (1920 1970 s) LA Centers Concept + Employment
Assessing spatial distribution and variability of destinations in inner-city Sydney from travel diary and smartphone location data
 Assessing spatial distribution and variability of destinations in inner-city Sydney from travel diary and smartphone location data Richard B. Ellison 1, Adrian B. Ellison 1 and Stephen P. Greaves 1 1 Institute
Alternatives Analysis
 Alternatives Analysis Prepared for: Metropolitan Atlanta Rapid Transit Authority Prepared by: AECOM/Jacobs-JJG Joint Venture Atlanta, GA November 2012 Page Left Intentionally Blank ii TABLE OF CONTENTS
I. M. Schoeman North West University, South Africa. Abstract
 Urban Transport XX 607 Land use and transportation integration within the greater area of the North West University (Potchefstroom Campus), South Africa: problems, prospects and solutions I. M. Schoeman
Economic and Social Urban Indicators: A Spatial Decision Support System for Chicago Area Transportation Planning
 Economic and Social Urban Indicators: A Spatial Decision Support System for Chicago Area Transportation Planning Piyushimita Thakuriah (Vonu), P.S. Sriraj, Paul Metaxatos, Inshu Minocha & Tanushri Swarup
A GIS TOUR OF DES MOINES PRESENTED BY ANNA WHIPPLE, GIS MANAGER APRIL 20, 2015
 A GIS TOUR OF DES MOINES PRESENTED BY ANNA WHIPPLE, GIS MANAGER APRIL 20, 2015 Welcome to Des Moines! Capital of Iowa Among 100 largest metropolitan areas Insurance, biotech, healthcare, and entertainment
Shaping Your Neighbourhood
 Shaping Your Neighbourhood Building a Core Sustainable Neighbourhood Action Plan Nov. 25 & 26, 2006 Welcome! Peter Russell Planner, Holland Barrs Planning Group Inc. Role in this project: Work with the
Council Workshop on Neighbourhoods Thursday, October 4 th, :00 to 4:00 p.m. Burlington Performing Arts Centre
 Council Workshop on Neighbourhoods Thursday, October 4 th, 2012 1:00 to 4:00 p.m. Burlington Performing Arts Centre Agenda Introductions Warm-Up Exercise Presentation Exercise Neighbourhood Planning Break
CERTIFIED RESOLUTION. introduction: and dated May 29, 2017, as attached, as appropriate
 15322 Buena Vista Avenue, White Rock BC, Canada V4B 1Y6 www.whiterockcity.ca City of White Rock P: 604.541.22121 F: 604.541.9348 /2tC% City Clerk s Office IT E ROC K June 13,2017 Stephanie Lam, Deputy
SBCAG Travel Model Upgrade Project 3rd Model TAC Meeting. Jim Lam, Stewart Berry, Srini Sundaram, Caliper Corporation December.
 SBCAG Travel Model Upgrade Project 3rd Model TAC Meeting Jim Lam, Stewart Berry, Srini Sundaram, Caliper Corporation December. 7, 2011 1 Outline Model TAZs Highway and Transit Networks Land Use Database
Developing the Transit Demand Index (TDI) Gregory Newmark, Regional Transportation Authority Transport Chicago Presentation July 25, 2012
 Gregory Newmark, Regional Transportation Authority Transport Chicago Presentation July 25, 2012") Developing the Transit Demand Index (TDI) Gregory Newmark, Regional Transportation Authority Transport Chicago Presentation July 25, 2012 Outline Present RTA methodology Transit Demand Index (TDI) Demonstrate
Developing the Transit Demand Index (TDI) Gregory Newmark, Regional Transportation Authority Transport Chicago Presentation July 25, 2012 Outline Present RTA methodology Transit Demand Index (TDI) Demonstrate
Data driven approaches to Urban Planning Experience from Derry/Londonderry
 Data driven approaches to Urban Planning Experience from Derry/Londonderry Anna Rose RTPI Belfast 11 th of September 1 June 26 07:47AM 2 The value of the City The space of the city is a theatre: playing
Transit-Oriented Development. Christoffer Weckström
 Transit-Oriented Development Christoffer Weckström 31.10.2017 Outline Context of Transit-oriented Development Elements of Transit-oriented Development A short history of land use and transit integration
Typical information required from the data collection can be grouped into four categories, enumerated as below.
 Chapter 6 Data Collection 6.1 Overview The four-stage modeling, an important tool for forecasting future demand and performance of a transportation system, was developed for evaluating large-scale infrastructure
Advancing Transportation Performance Management and Metrics with Census Data
 Advancing Transportation Performance Management and Metrics with Census Data Authors: Ivana Tasic, University of Utah, Department of Civil and Environmental Engineering, 110 Central Campus Drive, Salt
Susan Clark NRS 509 Nov. 29, 2005
 Susan Clark NRS 509 Nov. 29, 2005 The original intent of this project was to look at the role of GIS in the inventory of bicycle and pedestrian facilities. The research, however, indicates a different
High Speed / Commuter Rail Suitability Analysis For Central And Southern Arizona
 High Speed / Commuter Rail Suitability Analysis For Central And Southern Arizona Item Type Reports (Electronic) Authors Deveney, Matthew R. Publisher The University of Arizona. Rights Copyright is held
Measuring Performance:
 Accessibility Metrics in Metropolitan Regions around the World Geneviève Boisjoly and Ahmed El-Geneidy August 2017 Table of Contents Executive Summary...3 1 Introduction...4 2 Theoretical Background...4
Regional Growth Strategy Regional Staff Committee
 Regional Growth Strategy Regional Staff Committee June 21, 2018 1 Overview Summary of June Growth Management Policy Board Regional Growth Strategy Objectives Regional Geographies Regional Growth Strategy
River North Multi-Modal Transit Analysis
 River North Multi-Modal Transit Analysis November 7, 2006 Dan Meyers, AICP URS Corporation 612-373-6446 / dan_meyers@urscorp.com River North Study Area Reasons for initiating the study Downtown areas north
3.0 ANALYSIS OF FUTURE TRANSPORTATION NEEDS
 3.0 ANALYSIS OF FUTURE TRANSPORTATION NEEDS In order to better determine future roadway expansion and connectivity needs, future population growth and land development patterns were analyzed as part of
Employment Decentralization and Commuting in U.S. Metropolitan Areas. Symposium on the Work of Leon Moses
 Employment Decentralization and Commuting in U.S. Metropolitan Areas Alex Anas Professor of Economics University at Buffalo Symposium on the Work of Leon Moses February 7, 2014 9:30-11:15am, and 2:30-4:30pm
The Elusive Connection between Density and Transit Use
 The Elusive Connection between Density and Transit Use Abstract: The connection between density and transportation is heralded by planners, yet results are often elusive. This paper analyzes two regions,
Case Study: Orange County, California. Overview. Context
 Case Study: Orange County, California Overview The Orange County Transportation Authority (OCTA) provides transit service in a generally automobile-oriented part of southern California. Consequently, OCTA
VALIDATING THE RELATIONSHIP BETWEEN URBAN FORM AND TRAVEL BEHAVIOR WITH VEHICLE MILES TRAVELLED. A Thesis RAJANESH KAKUMANI
 VALIDATING THE RELATIONSHIP BETWEEN URBAN FORM AND TRAVEL BEHAVIOR WITH VEHICLE MILES TRAVELLED A Thesis by RAJANESH KAKUMANI Submitted to the Office of Graduate Studies of Texas A&M University in partial
Smart Growth: Threat to the Quality of Life. Experience
 Smart Growth: Threat to the Quality of Life Presentation by Wendell Cox Wendell Cox Consultancy Visiting Professor Conservatoire National des Arts et Metiers Paris Frontier Centre for Public Policy Winnipeg
Analyzing the Market Share of Commuter Rail Stations using LEHD Data
 Analyzing the Market Share of Commuter Rail Stations using LEHD Data Using Census Data for Transportation Applications Conference, Irvine, CA October 26, 2011 1. What is the size of Metrolink s commute
Modeling Mode in a Statewide Context
 Modeling Mode in a Statewide Context CDM Smith ADOT Transportation Planning Applications Conference May 6, 2013 Presentation Overview Development Team AZTDM3 Overview AZTDM3 Modes of Travel Transit Abstraction
Managing Growth: Integrating Land Use & Transportation Planning
 Managing Growth: Integrating Land Use & Transportation Planning Metro Vancouver Sustainability Community Breakfast Andrew Curran Manager, Strategy June 12, 2013 2 Integrating Land Use & Transportation
Land Use Modeling at ABAG. Mike Reilly October 3, 2011
 Land Use Modeling at ABAG Mike Reilly michaelr@abag.ca.gov October 3, 2011 Overview What and Why Details Integration Use Visualization Questions What is a Land Use Model? Statistical relationships between
CTR Employer Survey Report
 CTR Employer Survey Report Thank you for completing your Commute Trip Reduction survey. This report contains the survey results. Employer Id : E10983 Employer : WA State Dept. of Enterprise Services Worksite
Simplified Trips-on-Project Software (STOPS): Strategies for Successful Application
: Strategies for Successful Application") Simplified Trips-on-Project Software (STOPS): Strategies for Successful Application presented to Transit Committee Florida Model Task Force presented by Cambridge Systematics, Inc. John (Jay) Evans, AICP
Simplified Trips-on-Project Software (STOPS): Strategies for Successful Application presented to Transit Committee Florida Model Task Force presented by Cambridge Systematics, Inc. John (Jay) Evans, AICP
2014 Certification Review Regional Data & Modeling
 2014 Certification Review Regional Data & Modeling July 22, 2014 Regional Data Census Program Coordination PAG works with and for member agencies to ensure full participation in all Census Bureau programs
FHWA Planning Data Resources: Census Data Planning Products (CTPP) HEPGIS Interactive Mapping Portal
 HEPGIS Interactive Mapping Portal") FHWA Planning Data Resources: Census Data Planning Products (CTPP) HEPGIS Interactive Mapping Portal Jeremy Raw, P.E. FHWA, Office of Planning, Systems Planning and Analysis August 2017 Outline Census
FHWA Planning Data Resources: Census Data Planning Products (CTPP) HEPGIS Interactive Mapping Portal Jeremy Raw, P.E. FHWA, Office of Planning, Systems Planning and Analysis August 2017 Outline Census
Data Collection. Lecture Notes in Transportation Systems Engineering. Prof. Tom V. Mathew. 1 Overview 1
 Data Collection Lecture Notes in Transportation Systems Engineering Prof. Tom V. Mathew Contents 1 Overview 1 2 Survey design 2 2.1 Information needed................................. 2 2.2 Study area.....................................
Access Across America: Transit 2017
 Access Across America: Transit 2017 Final Report Prepared by: Andrew Owen Brendan Murphy Accessibility Observatory Center for Transportation Studies University of Minnesota CTS 18-12 1. Report No. CTS
Trip Generation Characteristics of Super Convenience Market Gasoline Pump Stores
 Trip Generation Characteristics of Super Convenience Market Gasoline Pump Stores This article presents the findings of a study that investigated trip generation characteristics of a particular chain of
Trip Generation Model Development for Albany
 Trip Generation Model Development for Albany Hui (Clare) Yu Department for Planning and Infrastructure Email: hui.yu@dpi.wa.gov.au and Peter Lawrence Department for Planning and Infrastructure Email: lawrence.peter@dpi.wa.gov.au
Traffic Demand Forecast
 Chapter 5 Traffic Demand Forecast One of the important objectives of traffic demand forecast in a transportation master plan study is to examine the concepts and policies in proposed plans by numerically
Webinar Series for Comprehensive Plan Updates. School Districts: More than just an affected jurisdiction
 Webinar Series for Comprehensive Plan Updates School Districts: More than just an affected jurisdiction Presented by Tara Beard, AICP March 9, 2017 Goals for this webinar City planning staff are more aware
Measuring connectivity in London
 Measuring connectivity in London OECD, Paris 30 th October 2017 Simon Cooper TfL City Planning 1 Overview TfL Connectivity measures in TfL PTALs Travel time mapping Catchment analysis WebCAT Current and
Transport Planning in Large Scale Housing Developments. David Knight
 Transport Planning in Large Scale Housing Developments David Knight Large Scale Housing Developments No longer creating great urban spaces in the UK (Hall 2014) Transport Planning Transport planning processes
ACCESSIBILITY OF INTERMODAL CENTERS STUDY
 ACCESSIBILITY OF INTERMODAL CENTERS STUDY Presentation for VDOT Forum - Coordinating Transportation Planning and Land Use Wednesday, April 2, 2014 Vlad Gavrilovic, AICP - Renaissance Planning Group Tasks