Creation of built environment indices
|
|
|
- Tobias Armstrong
- 5 years ago
- Views:
Transcription
1 Creation of built environment indices Daniel A. Rodriguez, Ph.D Department of City and Regional Planning, University of North Carolina, Chapel Hill with Lawrence J. Frank, Ph.D. Department of Community and Regional Planning, University of British Columbia
2 Outline Definition of built environment indices Previous applications Suggested alternative/complementary approach Data Methods Comparison of methods Comparison to established standard Conclusions
3 Objectives Identify data requirements Understand development of indices Assess strengths/weakness of various approaches with example Develop or propose Refinements to indices New uses for indices
4 Definition Score or scores qualifying environment Sprawl index Pedestrian environment index Transit serviceability index 3 Ds: diversity, design, density Characteristics of the urban environment Attribute 2 Attribute 2 Attribute 2 Attribute n Attribute n Attribute n Analytical tools Cluster analysis Delphi methods Principal components analysis Factor analysis Index or indices
5 Motivation Usefulness of built environment indices Research Data reduction technique (spatial co-variation) Input to sampling frame Identify priority areas Funding Transportation improvements (roads, transit) Safety interventions Water/sewer/school investments Areas of change, areas of stability Benchmark for measuring community goals
6 Selected previous examples Metropolitan-level compare across areas Intra-metropolitan County-level sprawl index Pedestrian Friendliness Index (PFI) Pedestrian Environment Factor (PEF)
7 County-level sprawl A priori factors Street access Centering Density Sprawl county i Land use mix
8 County-level sprawl Census Bureau Density: Pop/mi 2 % pop < 2.35 per. /acre % pop > 19.5 per. /acre Density at core (empirical) Street access Centering Density Sprawl county i NRI Net density (/built area) Land use mix AHS Mean single family lot size Claritas Density of city centers Principal components analysis
9 PFI Montgomery County, MD Analysis unit: Traffic analysis zones Range: 0-1, 1 = very friendly Method: Delphi-like Data elements Land use mix (0-0.25) Setbacks (0-0.1) Transit stops (0-0.1), Bicycle integration (0-0.1), Sidewalks (0-0.45) Data sources: GIS, expert knowledge, site visits
10 PEF Portland metro (LUTRAQ) Analysis unit: Traffic analysis zone Range: 4-12, 12 = supportive environment Method: Delphi-like Data elements Ease of street crossing width, volumes, signals (1-3) Sidewalk continuity on arterials (1-3) Street connectivity (1-3), Topography (1-3) Data sources: GIS, expert knowledge, site visits
11 Srinivasan (2002) Boston metro Analysis unit: Traffic Analysis Zone Range: unclear Method: Factor analysis Data elements % roads with no urbanization, % roads with no sidewalk, % roads with level terrain, average road width Data sources: GIS, expert knowledge, site visits
12 Observations Limited ability to generalize Reliability of methods PCA vs. factor analysis? Delphi-method vs. PCA? Validity of GIS data? Clear urban-suburban focus Rural areas? Use of surrogates (e.g., population density, street density)
13 A suggested approach Relies mostly on Census Bureau data Available throughout most of the U.S. Varying quality Robust analysis tool High inter-tool reliability Applied in Portland & Montgomery Cty, MD Following are Portland s results Comparison with established index Portland s PEF
14 Data Portland example Development intensity factors Population density Census 1990 Housing unit density Census 1990 Employment density CTPP, 1990 Park density RLIS Motorized transportation factors Roadway density RLIS (Census) Bus route density RLIS Transit commuting Census 1990 Proximity to subway station RLIS Pedestrian and bicycle infrastructure factors Sidewalk density RLIS Sidewalk coverage RLIS Ped & bicycle commuting Census 1990
15 Methods Tested 3 approaches to calculating BEI Principal components analysis Output: formula to score each TAZ Range of score: Non-hierarchical cluster analysis Output: cluster membership (urban, suburban, exurban) Range of score: 1-3 Naïve ranking method (16% increments) Output: formula to score for each TAZ Range of score:
16 Reliability part 1 Pearson correlations of raw score from each method Cluster PCA PCA 0.86 Naïve P < 0.00 in all cases
 Minimize within category")
17 Classification into three categories For continuous scores (PCA, naïve) Minimize within category variation
18 Classification into three categories Naïve classifies more areas as urban Cluster classifies most number as exurban
19 Reliability part 2 Agreement of classification into three groups from each method % agreement Cluster PCA PCA 96.9% Naïve 69.1% 68.9% Kappa coefficient Cluster PCA 0.94* Naïve 0.52* PCA 0.52* *P < 0.00
20 Comparison to PEF? PEF is quasi- gold standard Predictive & face validity Widely used in planning practice and research about Portland Compare three approaches to PEF Pearson correlation of raw scores and Kappa for three categories
21 Comparison to PEF? Pearson correlation Cluster method 0.68* % agreement 64.1 Kappa PCA method 0.71* * Naïve method 0.67* *P < * 0.43*
22 Conclusions Not all indices are created equal Use of BEI instead of PEF not justified Measuring same construct, just differently? Measuring different constructs? PEF: Ease of street crossing, sidewalk continuity on arterials, connectivity & topography Can they complement each other? Predictive validity of BEI?
23 Acknowledgments Part of this work was funded by RWJF s ALR program Robert Schneider, Toole Design Group Hannah Young, MRP UNC


24 MEASURING THE ENVIRONMENT
25 Methods for Macro-Level Measures Proximity Compactness Heterogeneity Floor Area Ration Connectivity Intersection Density Micro Level Measures Pedestrian Environment Not shown Here
26 Figure 4-2: Comparative Analysis of neighborhood street patterns in California suburbs Gridiron (c. 1900) Fragmented Parallel (c. 1950) Warped Parallel (c. 1960) Loops and Lollipops (c. 1970) Lollipops on a Stick (c. 1980) Street patterns Intersections Linear feet of streets 20,800 19,000 16,500 15,300 15,600 # Blocks # of Intersections # of Access points # of Loops & Cul-de-Sacs Source: Southworth, M. and P. Owens The Evolving Metropolis: Studies of Community, Neighborhood, and Street Form at the Urban Edge. Journal of the American Planning Association 59(3): , Figure 13.
27 ROUTE DIRECTNESS 1.3 miles vs. 0.5 miles Images are same scale, approximately 1 sq mi.
28


29 Parcel Level Land Use Database Parcel ID Owner Fowler, George Address 2111 Grace Circle Sales Price 371,995 Sale Date 5/12/96 Sq. Footage 3269 No. of Bdrooms 4 Garage Y Lot Size 12,500
30 Levels of Aggregation Mobile Homes Single Family Residential Single Family Multi-Family 2-9 Units Multi-Family Multi-Family 10 or More Units Office Park Commercial Commercial Low-Rise Office High-Rise Office Misc. Office Industrial Industrial Industrial High Tech Large Retail Large Retail Retail Neighborhood Retail Small Retail Misc. Retail Passive Recreation Passive Recreation Recreation/Entertainment Art Galleries and Museums Playgrounds Active Recreation Public Parks Health Clubs Restaurants and Bars Food Sources Convenience Stores Grocery Stores Fast Food Restaurant Institutional Institutional Institutional Civic Agriculture Agriculture Agriculture Manufacturing Manufacturing Manufacturing Dr. Lawrence Frank Fine-Scaled Course-Scaled

31 Distribution of Parcels by Land Use Category Land Use Number of Parcels Percent of Total Agriculture % Commercial % Multifamily Residential % Mixed Use % Office % Open Space % Public % Recreation % Single Family Residential % Unknown % Vacant % Total % Source: French, Frank, and Bachman, 2000
32

33 Dr. Lawrence Frank Land Use Triangle

34


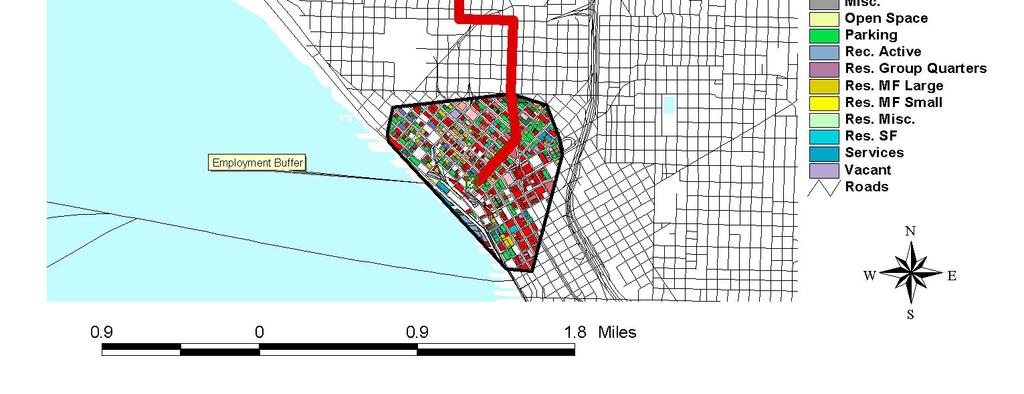
35 Residential Buffer Square Footage # of Land Uses Land Area Residenti al 4,306, acres Retail 18, acres Entertainme nt 94, acres Office 194, acres Institutio nal 390, acres
36 The Choice to Walk Larger Numbers = Stronger Relationship Assessed at Place of Residence
37 80 Oxides of Nitrogen and Land Use Heterogenity at Home and Work 70 Person Level NOx Emissions (grams / day) LOW Source: King County LUTAQH Study, 2003 Note: Findings Are Significant After Controlling for Household Size and Income Employment Location Number of Land Use Types Household Location HIGH
38 Net Residential Stratification SMARTRAQ 2/8/2001 GT GIS Center OPTION TWO: Units / Acre Res. Units Sq. KM
39 200 Meter Walkability Surface Mixed Use Street Connectivity Residential Density Other Factors Z Score Sum Low Walkability (-2 to 1) -1 to 0 Std Dev 0 to 1 Std Dev 1 to 2 Std Dev 2 to 3 Std Dev High Walkability (> 3)
 Measure: Transit Accessibility Distance (Miles) to Transit Stop Proportion of county within certain distance to transit 47% 21% 4% Less")
40 Built Environment Dekalb 28% Goal: Improve Mobility, Accessibility and the Coordination of Land Use and Transportation Decisions (GRTA 2001 Annual Report) Objective: Improve accessibility to jobs and essential activities and services (GRTA 2001 Annual Report) Measure: Transit Accessibility Distance (Miles) to Transit Stop Proportion of county within certain distance to transit 47% 21% 4% Less than ½ mile ½ to 1.9 miles 2 to 4.9 miles 5 miles or farther+ Fulton 20% 32% 25% 23% Cobb 9% 28% 32% 31% Clayton 4% 11% 28% 57% Rockdale 6% 94% Fayette 5% 95% Douglas Gwinnett 6% 7% 94% 91% Forsyth 5% 95% Coweta 4% 96% Henry 3% 96% Cherokee 99% Paulding 100% Source: SMARTRAQ, UBC Research Group
41 APPROACH PERFORMANCE MEASURE PYRAMID Quality of Life Environmental Quality Air Quality and Greenspace Human Behavior Travel Patterns and Physical Activity Built Environment Transportation Investments and Land Use
42 Neighborhood Quality of Life Study: Results from King County, Washington James F. Sallis, Ph.D. Brian E. Saelens, Ph.D. Lawrence D. Frank, Ph.D. Kelli L. Cain, M.A. Terry L. Conway, Ph.D. Lauren Leary, M.A.
43 Neighborhood Quality of Life Study: Results from King County, Washington Primary Aim Investigate whether people who live in walkable communities are more active and less likely to be obese, after adjusting for SES, than people who live in less walkable communities. Walkability means high density, high street connectivity, and mixed land use. James Sallis, Ph.D. (PI), Lawrence Frank, Ph.D. (CO-PI) Brian Saelens, Ph.D. (CO-PI) Kelli L. Cain, M.A., Terry L. Conway, Ph.D. Lauren Leary, M.A.


44 Walkability Mixed Use Density Street Connectivity Amount of Retail Census Block Groups
45 NQLS Neighborhood Categories Walkability Low High Income Low High High Low 4 per city 4 per city 4 per city 4 per city
46 King County
47 NQLS Environmental variables and PA aesthetics convenient rec facilities walking/cycling facilities safety from traffic * * * ** Walking (leisure) Walking (transport) safety from crime ** ** GIS walkability score ** *p<0.05 **p<
48 NQLS Body Mass Index (BMI) (Walkability x Income) 28 Walkability F=7.14; p<0.008 Income F=18.58; p< BMI Walk Income Low High High High Low Low High Low

49 NQLS 250 Walking for Transportation (min/week) (Walkability x Income) Walkability F=24.14; p<0.001 Income F=9.48; p< Walk Income Low High High High Low Low High Low
50 OBJECTIVELY MEASURED PHYSICAL ACTIVITY % meeting 30 min per day guideline of moderate + vigorous Walkability: F=4.71 p=.030 * Income: F=1.1 p=.295 Walkability x Income: F=3.18 p=.075 Percent Walk0 walkability SES Low W Low Low W High High W Low High W High Adjusted for age and sex; * p <.05
51
An easy to compute index for identifying built environments that support walking
 An easy to compute index for identifying built environments that support walking 1. Daniel A. Rodríguez Carolina Transportation Program Department of City and Regional Planning CB 3140 New East Building,
Developing Built Environment Indicators for Urban Oregon. Dan Rubado, MPH EPHT Epidemiologist Oregon Public Health Division
 Developing Built Environment Indicators for Urban Oregon Dan Rubado, MPH EPHT Epidemiologist Oregon Public Health Division What is the built environment? The built environment encompasses spaces and places
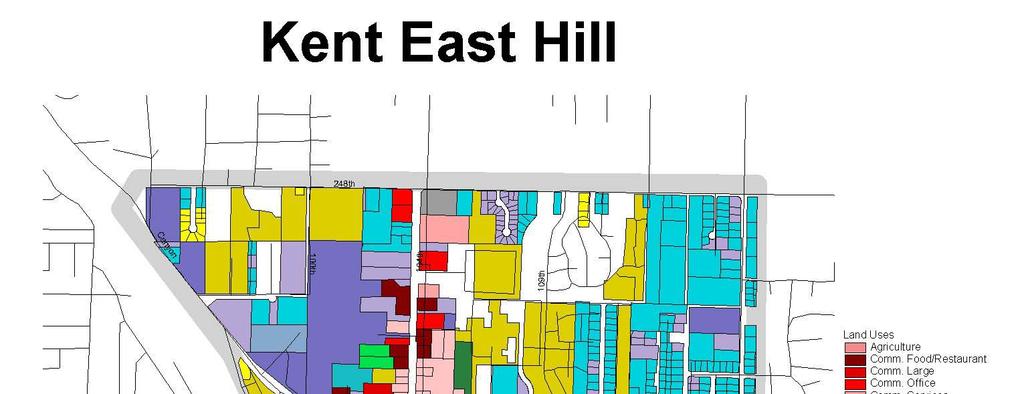
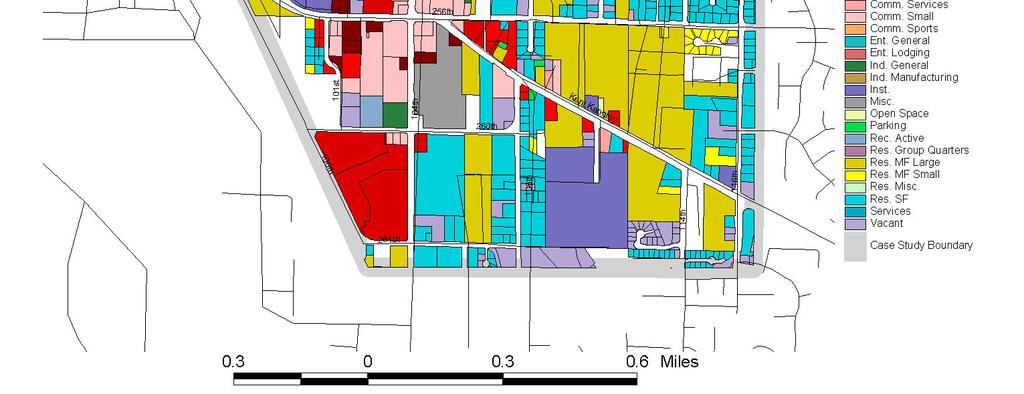
Figure 8.2a Variation of suburban character, transit access and pedestrian accessibility by TAZ label in the study area
 Figure 8.2a Variation of suburban character, transit access and pedestrian accessibility by TAZ label in the study area Figure 8.2b Variation of suburban character, commercial residential balance and mix
Urban Planning Word Search Level 1
 Urban Planning Word Search Level 1 B C P U E C O S Y S T E M P A R E U O E U R B A N P L A N N E R T N S T D H E C O U N T Y G E R E R D W R E N I C I T Y C O U N C I L A A A S U G G C I L A G P R I R
King City URA 6D Concept Plan
 King City URA 6D Concept Plan King City s Evolution Among the fastest growing cities 2000 Census 1,949 2010 Census 3,111 60% increase 2016 Census estimate 3,817 23% increase Average annual rate 4.3% Surpassing
Appendix: Development Patterns and Design
 Appendix: Development Patterns and Design Development Patterns Figure 1 lists the amount of land converted from undeveloped to some other form of land for the 13 county and 20 county Atlanta Region. In
Density and Walkable Communities
 Density and Walkable Communities Reid Ewing Professor & Chair City and Metropolitan Planning University of Utah ewing@arch.utah.edu Department of City & Metropolitan Planning, University of Utah MRC Research
GIS for the Non-Expert
 GIS for the Non-Expert Ann Forsyth University of Minnesota February 2006 GIS for the Non-Expert 1. Definitions and problems 2. Measures being tested in Twin Cities Walking Study Basic approach, data, variables
A Comprehensive Method for Identifying Optimal Areas for Supermarket Development. TRF Policy Solutions April 28, 2011
 A Comprehensive Method for Identifying Optimal Areas for Supermarket Development TRF Policy Solutions April 28, 2011 Profile of TRF The Reinvestment Fund builds wealth and opportunity for lowwealth communities
Brian J. Morton Center for Urban and Regional Studies University of North Carolina - Chapel Hill June 8, 2010
 Brian J. Morton Center for Urban and Regional Studies University of North Carolina - Chapel Hill June 8, 2010 1. TRANUS Highway vehicle technology Trips Mode choice Link-level traffic volumes and average
Impact of Metropolitan-level Built Environment on Travel Behavior
 Impact of Metropolitan-level Built Environment on Travel Behavior Arefeh Nasri 1 and Lei Zhang 2,* 1. Graduate Research Assistant; 2. Assistant Professor (*Corresponding Author) Department of Civil and
BROOKINGS May
 Appendix 1. Technical Methodology This study combines detailed data on transit systems, demographics, and employment to determine the accessibility of jobs via transit within and across the country s 100
Understanding Land Use and Walk Behavior in Utah
 Understanding Land Use and Walk Behavior in Utah 15 th TRB National Transportation Planning Applications Conference Callie New GIS Analyst + Planner STUDY AREA STUDY AREA 11 statistical areas (2010 census)
California Urban Infill Trip Generation Study. Jim Daisa, P.E.
 California Urban Infill Trip Generation Study Jim Daisa, P.E. What We Did in the Study Develop trip generation rates for land uses in urban areas of California Establish a California urban land use trip
The effects of impact fees on urban form and congestion in Florida
 The effects of impact fees on urban form and congestion in Florida Principal Investigators: Andres G. Blanco Ruth Steiner Presenters: Hyungchul Chung Jeongseob Kim Urban and Regional Planning Contents
HORIZON 2030: Land Use & Transportation November 2005
 PROJECTS Land Use An important component of the Horizon transportation planning process involved reviewing the area s comprehensive land use plans to ensure consistency between them and the longrange transportation
Susan Clark NRS 509 Nov. 29, 2005
 Susan Clark NRS 509 Nov. 29, 2005 The original intent of this project was to look at the role of GIS in the inventory of bicycle and pedestrian facilities. The research, however, indicates a different
CORRIDORS OF FREEDOM Access Management (Ability) Herman Pienaar: Director City Transformation and Spatial Planning
 Herman Pienaar: Director City Transformation and Spatial Planning") CORRIDORS OF FREEDOM Access Management (Ability) 2016 Herman Pienaar: Director City Transformation and Spatial Planning PLANNING DEVELOPMENT PROCESS RATHER THAN A PLAN CAPITAL INVESTMENT DEVELOPMENT FACILITATION
CORRIDORS OF FREEDOM Access Management (Ability) 2016 Herman Pienaar: Director City Transformation and Spatial Planning PLANNING DEVELOPMENT PROCESS RATHER THAN A PLAN CAPITAL INVESTMENT DEVELOPMENT FACILITATION
Local Economic Activity Around Rapid Transit Stations
 Local Economic Activity Around Rapid Transit Stations The Case of Chicago s Orange Line Julie Cooper, MPP 2014 Harris School of Public Policy Transport Chicago June 6, 2014 Motivation Impacts of transit
Regional Performance Measures
 G Performance Measures Regional Performance Measures Introduction This appendix highlights the performance of the MTP/SCS for 2035. The performance of the Revenue Constrained network also is compared to
GIS Analysis of Crenshaw/LAX Line
 PDD 631 Geographic Information Systems for Public Policy, Planning & Development GIS Analysis of Crenshaw/LAX Line Biying Zhao 6679361256 Professor Barry Waite and Bonnie Shrewsbury May 12 th, 2015 Introduction
Urban White Paper on Tokyo Metropolis 2002
 Urban White Paper on Tokyo Metropolis 2002 By Bureau of City Planning Tokyo Metropolitan Government Part I. "Progress in IT and City Building" Effects of computer networks on cities and cities' response
Neighborhood Locations and Amenities
 University of Maryland School of Architecture, Planning and Preservation Fall, 2014 Neighborhood Locations and Amenities Authors: Cole Greene Jacob Johnson Maha Tariq Under the Supervision of: Dr. Chao
CLAREMONT MASTER PLAN 2017: LAND USE COMMUNITY INPUT
 Planning and Development Department 14 North Street Claremont, New Hampshire 03743 Ph: (603) 542-7008 Fax: (603) 542-7033 Email: cityplanner@claremontnh.com www.claremontnh.com CLAREMONT MASTER PLAN 2017:
Alternatives Analysis
 Alternatives Analysis Prepared for: Metropolitan Atlanta Rapid Transit Authority Prepared by: AECOM/Jacobs-JJG Joint Venture Atlanta, GA November 2012 Page Left Intentionally Blank ii TABLE OF CONTENTS
Regional Performance Measures
 G Performance Measures Regional Performance Measures Introduction This appendix highlights the performance of the MTP/SCS for 2035. The performance of the Revenue Constrained network also is compared to
Public Transportation Infrastructure Study (PTIS) - 2 nd Technical Advisory Committee Meeting
 - 2 nd Technical Advisory Committee Meeting") Public Transportation Infrastructure Study (PTIS) - 2 nd Technical Advisory Committee Meeting Presentation to: Technical Advisory Committee (TAC) Presented by: and Team July 8th, 2009 Public Transportation
Public Transportation Infrastructure Study (PTIS) - 2 nd Technical Advisory Committee Meeting Presentation to: Technical Advisory Committee (TAC) Presented by: and Team July 8th, 2009 Public Transportation
Forecasts for the Reston/Dulles Rail Corridor and Route 28 Corridor 2010 to 2050
 George Mason University Center for Regional Analysis Forecasts for the Reston/Dulles Rail Corridor and Route 28 Corridor 21 to 25 Prepared for the Fairfax County Department of Planning and Zoning Lisa
Transit Service Gap Technical Documentation
 Transit Service Gap Technical Documentation Introduction This document is an accompaniment to the AllTransit TM transit gap methods document. It is a detailed explanation of the process used to develop
Internal Capture in Mixed-Use Developments (MXDs) and Vehicle Trip and Parking Reductions in Transit-Oriented Developments (TODs)
 and Vehicle Trip and Parking Reductions in Transit-Oriented Developments (TODs)") Internal Capture in Mixed-Use Developments (MXDs) and Vehicle Trip and Parking Reductions in Transit-Oriented Developments (TODs) Reid Ewing City and Metropolitan Planning University of Utah ewing@arch.utah.edu
Internal Capture in Mixed-Use Developments (MXDs) and Vehicle Trip and Parking Reductions in Transit-Oriented Developments (TODs) Reid Ewing City and Metropolitan Planning University of Utah ewing@arch.utah.edu
Council Workshop on Neighbourhoods Thursday, October 4 th, :00 to 4:00 p.m. Burlington Performing Arts Centre
 Council Workshop on Neighbourhoods Thursday, October 4 th, 2012 1:00 to 4:00 p.m. Burlington Performing Arts Centre Agenda Introductions Warm-Up Exercise Presentation Exercise Neighbourhood Planning Break
East Bay BRT. Planning for Bus Rapid Transit
 East Bay BRT Planning for Bus Rapid Transit Regional Vision Draper Prison The Bottleneck is a State-Level issue, Salt Lake County 2050 Population: 1.5M Draper Prison hopefully with some State-Level funding!
GIS BASED ANALYSIS OF EXPRESS VS LOCAL STATIONS ON SURROUNDING LAND USES IN NEW YORK CITY
 GIS BASED ANALYSIS OF EXPRESS VS LOCAL STATIONS ON SURROUNDING LAND USES IN NEW YORK CITY GIS in Transit Conference, Washington D.C Date: September 2, 2015 1 Subrina Rahman Supervised by Dr. Candace Brakewood
The Influence of Land Use on Travel Behavior: Empirical Evidence from Santiago de Chile
 The Influence of Land Use on Travel Behavior: Empirical Evidence from Santiago de Chile Transportation Research Board (TRB) 83 rd Annual Meeting Washington, DC, January 2004 P. Christopher Zegras Massachusetts
URBAN SPRAWL, COMMUTING, AND ACCESS TO PUBLIC TRANSPORTATION IN SELECTED SOUTHEASTERN METROPOLITAN AREAS
 Papers of the Applied Geography Conferences (2006) 29: 282-291 URBAN SPRAWL, COMMUTING, AND ACCESS TO PUBLIC TRANSPORTATION IN SELECTED SOUTHEASTERN METROPOLITAN AREAS Joe Weber Department of Geography
APPENDIX I: Traffic Forecasting Model and Assumptions
 APPENDIX I: Traffic Forecasting Model and Assumptions Appendix I reports on the assumptions and traffic model specifications that were developed to support the Reaffirmation of the 2040 Long Range Plan.
The 3V Approach. Transforming the Urban Space through Transit Oriented Development. Gerald Ollivier Transport Cluster Leader World Bank Hub Singapore
 Transforming the Urban Space through Transit Oriented Development The 3V Approach Gerald Ollivier Transport Cluster Leader World Bank Hub Singapore MDTF on Sustainable Urbanization The China-World Bank
Transit-Oriented Development. Christoffer Weckström
 Transit-Oriented Development Christoffer Weckström 31.10.2017 Outline Context of Transit-oriented Development Elements of Transit-oriented Development A short history of land use and transit integration
Geodatabase for Sustainable Urban Development. Presented By Rhonda Maronn Maurice Johns Daniel Ashney Jack Anliker
 Geodatabase for Sustainable Urban Development Presented By Rhonda Maronn Maurice Johns Daniel Ashney Jack Anliker Objective Build a Geodatabase that will enable urban planners to create and assess the
Subject: Note on spatial issues in Urban South Africa From: Alain Bertaud Date: Oct 7, A. Spatial issues
 Page 1 of 6 Subject: Note on spatial issues in Urban South Africa From: Alain Bertaud Date: Oct 7, 2009 A. Spatial issues 1. Spatial issues and the South African economy Spatial concentration of economic
Mapping Accessibility Over Time
 Journal of Maps, 2006, 76-87 Mapping Accessibility Over Time AHMED EL-GENEIDY and DAVID LEVINSON University of Minnesota, 500 Pillsbury Drive S.E., Minneapolis, MN 55455, USA; geneidy@umn.edu (Received
The Built Environment, Car Ownership, and Travel Behavior in Seoul
 The Built Environment, Car Ownership, and Travel Behavior in Seoul Sang-Kyu Cho, Ph D. Candidate So-Ra Baek, Master Course Student Seoul National University Abstract Although the idea of integrating land
MPOs SB 375 LAFCOs SCAG Practices/Experiences And Future Collaborations with LAFCOs
 Connecting LAFCOs and COGs for Mutual Benefits MPOs SB 375 LAFCOs SCAG Practices/Experiences And Future Collaborations with LAFCOs Frank Wen, Manager Research & Analysis Land Use & Environmental Planning
STAR COMMUNITY RATING SYSTEM OBJECTIVE EE-4: EQUITABLE SERVICES & ACCESS COMMUNITY LEVEL OUTCOMES FOR KING COUNTY, WA
 STAR COMMUNITY RATING SYSTEM OBJECTIVE EE-4: EQUITABLE SERVICES & ACCESS COMMUNITY LEVEL OUTCOMES FOR KING COUNTY, WA OUTCOME I: EQUITABLE ACCESS AND PROXIMITY Background: This analysis has been developed
Analysis of Change in Land Use around Future Core Transit Corridors: Austin, TX, Eric Porter May 3, 2012
 Analysis of Change in Land Use around Future Core Transit Corridors: Austin, TX, 1990-2006 PROBLEM DEFINITION Eric Porter May 3, 2012 This study examines the change in land use from 1990 to 2006 in the
Riocan Centre Study Area Frontenac Mall Study Area Kingston Centre Study Area
 OVERVIEW the biggest challenge of the next century (Dunham Jones, 2011). New books are continually adding methods and case studies to a growing body of literature focused on tackling this massive task.
VALIDATING THE RELATIONSHIP BETWEEN URBAN FORM AND TRAVEL BEHAVIOR WITH VEHICLE MILES TRAVELLED. A Thesis RAJANESH KAKUMANI
 VALIDATING THE RELATIONSHIP BETWEEN URBAN FORM AND TRAVEL BEHAVIOR WITH VEHICLE MILES TRAVELLED A Thesis by RAJANESH KAKUMANI Submitted to the Office of Graduate Studies of Texas A&M University in partial
Transit Time Shed Analyzing Accessibility to Employment and Services
 Transit Time Shed Analyzing Accessibility to Employment and Services presented by Ammar Naji, Liz Thompson and Abdulnaser Arafat Shimberg Center for Housing Studies at the University of Florida www.shimberg.ufl.edu
Lee County, Alabama 2015 Forecast Report Population, Housing and Commercial Demand
 Lee County, Alabama 2015 Forecast Report Population, Housing and Commercial Demand Thank you for purchasing this report, which contains forecasts of population growth, housing demand and demand for commercial
A Socioeconomic Analysis of the Spatial Distribution of Fire Hydrants. History of Portland Fire Hydrants
 A Socioeconomic Analysis of the Spatial Distribution of Fire Hydrants By Dylan Carmody Robert Chappell Jana Tracy Allan McMillian 2003 History of Portland Fire Hydrants The first fire hydrant was installed
METHODOLOGICAL ISSUES IN CREATING A REGIONAL NEIGHBORHOOD TYPOLOGY
 METHODOLOGICAL ISSUES IN CREATING A REGIONAL NEIGHBORHOOD TYPOLOGY Z. Asligul Gocmen Urban and Regional Planning Program, University of Michigan Ann Arbor, MI 48109 Tel: +1 734-904-2762 (c) Fax: +1 734-763-2322
Get Over, and Beyond, the Half-Mile Circle (for Some Transit Options)
") Get Over, and Beyond, the Half-Mile Circle (for Some Transit Options) Arthur C. Nelson, Ph.D., FAICP Associate Dean for Research & Discovery College of Architecture, Planning and Landscape Architecture
Get Over, and Beyond, the Half-Mile Circle (for Some Transit Options) Arthur C. Nelson, Ph.D., FAICP Associate Dean for Research & Discovery College of Architecture, Planning and Landscape Architecture
Updating the Urban Boundary and Functional Classification of New Jersey Roadways using 2010 Census data
 Updating the Urban Boundary and Functional Classification of New Jersey Roadways using 2010 Census data By: Glenn Locke, GISP, PMP 1 GIS-T May, 2013 Presentation Overview Purpose of Project Methodology
Speakers: Jeff Price, Federal Transit Administration Linda Young, Center for Neighborhood Technology Sofia Becker, Center for Neighborhood Technology
 Speakers: Jeff Price, Federal Transit Administration Linda Young, Center for Neighborhood Technology Sofia Becker, Center for Neighborhood Technology Peter Haas, Center for Neighborhood Technology Craig
Environmental Analysis, Chapter 4 Consequences, and Mitigation
 Environmental Analysis, Chapter 4 4.17 Environmental Justice This section summarizes the potential impacts described in Chapter 3, Transportation Impacts and Mitigation, and other sections of Chapter 4,
Westside Extension Los Angeles, California
 Westside Extension Los Angeles, California Rail~Volution 2010 Portland, Oregon Monica Villalobos AECOM History of Westside Suburban Growth in the Westside (1920 1970 s) LA Centers Concept + Employment
TUESDAYS AT APA PLANNING AND HEALTH. SAGAR SHAH, PhD AMERICAN PLANNING ASSOCIATION SEPTEMBER 2017 DISCUSSING THE ROLE OF FACTORS INFLUENCING HEALTH
 SAGAR SHAH, PhD sshah@planning.org AMERICAN PLANNING ASSOCIATION SEPTEMBER 2017 TUESDAYS AT APA PLANNING AND HEALTH DISCUSSING THE ROLE OF FACTORS INFLUENCING HEALTH Outline of the Presentation PLANNING
Modeling the land-use correlates of vehicle-trip lengths for assessing the transportation impacts of land developments
 THE JOURL OF TRANSPORT AND LAND USE http://jtlu.org VOL. 6 NO. 2 [2013] pp. 59 75 doi: 10.5198/jtlu.v6i2.254 Modeling the land-use correlates of vehicle-trip lengths for assessing the transportation impacts
Appendixx C Travel Demand Model Development and Forecasting Lubbock Outer Route Study June 2014
 Appendix C Travel Demand Model Development and Forecasting Lubbock Outer Route Study June 2014 CONTENTS List of Figures-... 3 List of Tables... 4 Introduction... 1 Application of the Lubbock Travel Demand
PlaceTypes. How the built environment is measured. Variables Measures Levels. AREA TYPE + DEVELOPMENT TYPE = PlaceType
 PlaceTypes In order to better understand land use and transportation interactions and to make more informed policy decisions, neighborhood characteristics can be analyzed by the role that they play in
Volume Title: Empirical Models of Urban Land Use: Suggestions on Research Objectives and Organization. Volume URL:
 This PDF is a selection from an out-of-print volume from the National Bureau of Economic Research Volume Title: Empirical Models of Urban Land Use: Suggestions on Research Objectives and Organization Volume
Urban Revival in America
 Urban Revival in America Victor Couture 1 Jessie Handbury 2 1 University of California, Berkeley 2 University of Pennsylvania and NBER May 2016 1 / 23 Objectives 1. Document the recent revival of America
To Drive or Not to Drive:
 To Drive or Not to Drive: A Study of the Influence of the Built Environment on Employee Travel Mode Choice in Chapel Hill by Jennifer C. Lewis A Masters Project submitted to the faculty of the University
A Grocery Store for the Big Apple Research Question
 A Grocery Store for the Big Apple Research Question 0 To verify the validity of existing grocery stores, I searched all of the addresses on Google. Out of the original 1,547 results, only 62 were true,
Land Use and Zoning Page 1 of 10 LAND USE AND ZONING
 LAND USE AND ZONING Land Use and Zoning Page 1 of 10 BACKGROUND The Clifton-Fruitvale planning area is about 3,962 acres (6.2 sq. miles) with a population of 14,000 residents. The density of the area is
TRAVEL DEMAND MODEL. Chapter 6
 Chapter 6 TRAVEL DEMAND MODEL As a component of the Teller County Transportation Plan development, a computerized travel demand model was developed. The model was utilized for development of the Transportation
MULTIPLE CHOICE. Choose the one alternative that best completes the statement or answers the question.
 AP Test 13 Review Name MULTIPLE CHOICE. Choose the one alternative that best completes the statement or answers the question. 1) Compared to the United States, poor families in European cities are more
About Visualizing Density
 About Visualizing Density Visualizing Density is a pilot project created by the Canadian Urban Institute to help planners, designers, elected officials, residents groups, and private sector builders design
Regional Snapshot Series: Transportation and Transit. Commuting and Places of Work in the Fraser Valley Regional District
 Regional Snapshot Series: Transportation and Transit Commuting and Places of Work in the Fraser Valley Regional District TABLE OF CONTENTS Complete Communities Daily Trips Live/Work Ratio Commuting Local
ROBBERY VULNERABILITY
 Spatial Risk Assessment: ROBBERY VULNERABILITY A Spatial Risk Assessment was conducted to identify environmental features which make locations conducive to robberies in the City of Burlington, NC. Findings
SPATIAL ANALYSIS OF URBAN BUILT ENVIRONMENTS AND VEHICLE TRANSIT BEHAVIOR. Daniel Currie Eisman
 SPATIAL ANALYSIS OF URBAN BUILT ENVIRONMENTS AND VEHICLE TRANSIT BEHAVIOR by Daniel Currie Eisman A Thesis Presented to the FACULTY OF THE USC GRADUATE SCHOOL UNIVERSITY OF SOUTHERN CALIFORNIA In Partial
Transportation and Social Equity as a Way to Alleviate Poverty
 Transportation and Social Equity as a Way to Alleviate Poverty The Case of Low-Income Neighborhoods in Savannah, GA Vishanya F. Forbes1, Dr. Deden Rukmana2 What is Social Equity? It s a term that implies
REO 100% Leased Four (4) Unit Mixed-Use Property Along Ashland
 Unit Mixed-Use Property Along Ashland") 5015 SOUTH ASHLAND AVENUE CHICAGO, IL 60609 DETAILS Sale Price $119,000 Lot Size 0.06 Acres Building Size 3,784 SF Occupancy 100% Year Built 1893 Market Cook County Sub Market South Chicago Cross Streets
5015 SOUTH ASHLAND AVENUE CHICAGO, IL 60609 DETAILS Sale Price $119,000 Lot Size 0.06 Acres Building Size 3,784 SF Occupancy 100% Year Built 1893 Market Cook County Sub Market South Chicago Cross Streets
Kitsap County 2016 Comprehensive Plan Update. Appendix A: Growth Estimates
 Kitsap County 2016 Comprehensive Plan Update Appendix A: Growth Estimates Appendix A 1 April 2016 Kitsap County 2016 Comprehensive Plan Update Appendix A: Growth Estimates Land Capacity Land capacity
The Road to Data in Baltimore
 Creating a parcel level database from high resolution imagery By Austin Troy and Weiqi Zhou University of Vermont, Rubenstein School of Natural Resources State and local planning agencies are increasingly
Smart Growth: Threat to the Quality of Life. Experience
 Smart Growth: Threat to the Quality of Life Presentation by Wendell Cox Wendell Cox Consultancy Visiting Professor Conservatoire National des Arts et Metiers Paris Frontier Centre for Public Policy Winnipeg
Lee County, Florida 2015 Forecast Report Population, Housing and Commercial Demand
 Lee County, Florida 2015 Forecast Report Population, Housing and Commercial Demand Thank you for purchasing this report, which contains forecasts of population growth, housing demand and demand for commercial
Technical Memorandum #2 Future Conditions
 Technical Memorandum #2 Future Conditions To: Dan Farnsworth Transportation Planner Fargo-Moorhead Metro Council of Governments From: Rick Gunderson, PE Josh Hinds PE, PTOE Houston Engineering, Inc. Subject:
Minneapolis Riverfront Vitality Indicator Project. Macalester College GEOG 365: Urban GIS Seminar April 30, 2013
 Minneapolis Riverfront Vitality Indicator Project Macalester College GEOG 365: Urban GIS Seminar April 30, 2013 Project Context Establishing a baseline for observing how the Minneapolis Riverfront is shaping
ZONING DISTRICT REGULATIONS. Table 4-2 Permitted Uses by Zoning Districts Use Types AG RR R-1 R-2 R-3 MH LC CC DC GC LI GI P Addl Reg
 ZONING DITRICT REGULATION Table 4-2 Permitted Uses by Zoning Districts Agricultural Uses Horticulture P P P P P P P P P 39.06.002a Crop Production P P P 39.06.002a Type I Animal Production Type II Animal
Urban development. The compact city concept was seen as an approach that could end the evil of urban sprawl
 The compact city Outline 1. The Compact City i. Concept ii. Advantages and the paradox of the compact city iii. Key factor travel behavior 2. Urban sustainability i. Definition ii. Evaluating the compact
Application of GIS in urban planning. Iran Experiences of land use planning and air pollution
 Application of GIS in urban planning Iran Experiences of land use planning and air pollution Index Introducing the case study Geographical characteristics Demographical characteristics Urban Development
Estimating Neighborhood Environments from Survey Data
 Estimating Neighborhood Environments from Survey Data Ikuho Yamada Interfaculty Initiative in Information Studies Center for Spatial Information Science ersity of Tokyo Research themes Keywords Geographic
A Comparison of the Accessibility of Three Neighborhoods Institutions and Amenities in Frederick, MD
 A Comparison of the Accessibility of Three Neighborhoods Institutions and Amenities in Frederick, MD Elizabeth Hampton Christopher Johansson Yana Demireva Albert Engel Table of Contents EXECUTIVE SUMMARY...
A GIS TOUR OF DES MOINES PRESENTED BY ANNA WHIPPLE, GIS MANAGER APRIL 20, 2015
 A GIS TOUR OF DES MOINES PRESENTED BY ANNA WHIPPLE, GIS MANAGER APRIL 20, 2015 Welcome to Des Moines! Capital of Iowa Among 100 largest metropolitan areas Insurance, biotech, healthcare, and entertainment
Case Study: Orange County, California. Overview. Context
 Case Study: Orange County, California Overview The Orange County Transportation Authority (OCTA) provides transit service in a generally automobile-oriented part of southern California. Consequently, OCTA
Six (6) Unit Apartment Building Along Garfield Boulevard - Bank Owned WEST GARFIELD BOULEVARD CHICAGO, IL DETAILS PROPERTY OVERVIEW
 Unit Apartment Building Along Garfield Boulevard - Bank Owned WEST GARFIELD BOULEVARD CHICAGO, IL DETAILS PROPERTY OVERVIEW") 907-909 WEST GARFIELD BOULEVARD CHICAGO, IL 60621 DETAILS Sale Price $370,000 Lot Size 7,500 SF Building Size 8,538 SF Taxes (2016) $6,021.31 Zoning R-1, Low Density Residential Market South Chicago Cross
907-909 WEST GARFIELD BOULEVARD CHICAGO, IL 60621 DETAILS Sale Price $370,000 Lot Size 7,500 SF Building Size 8,538 SF Taxes (2016) $6,021.31 Zoning R-1, Low Density Residential Market South Chicago Cross
Modeling Land Use Change Using an Eigenvector Spatial Filtering Model Specification for Discrete Response
 Modeling Land Use Change Using an Eigenvector Spatial Filtering Model Specification for Discrete Response Parmanand Sinha The University of Tennessee, Knoxville 304 Burchfiel Geography Building 1000 Phillip
Transport Planning in Large Scale Housing Developments. David Knight
 Transport Planning in Large Scale Housing Developments David Knight Large Scale Housing Developments No longer creating great urban spaces in the UK (Hall 2014) Transport Planning Transport planning processes
Spatiotemporal Analysis of Commuting Patterns in Southern California Using ACS PUMS, CTPP and LODES
 Spatiotemporal Analysis of Commuting Patterns in Southern California Using ACS PUMS, CTPP and LODES 2017 ACS Data Users Conference May 11-12, 2017 Alexandria, VA Jung Seo, Tom Vo, Frank Wen and Simon Choi
Technical Report: Population
 Cherokee County orecasts Technical Report: An Element of the Joint Comprehensive Plan For Cherokee County and the Cities of Ball Ground, Waleska and Woodstock, Georgia Plan Cherokee Team: ROSS+associates
Shaping Your Neighbourhood
 Shaping Your Neighbourhood Building a Core Sustainable Neighbourhood Action Plan Nov. 25 & 26, 2006 Welcome! Peter Russell Planner, Holland Barrs Planning Group Inc. Role in this project: Work with the
Committee Meeting November 6, 2018
 Committee Meeting November 6, 2018 Agenda Where we are in the process Land Use Plan Transportation Element Housing & Neighborhoods Elements Next Steps Schedule November 6: Plan Elements December: Plan
Transect Code Manual
 Transect Code Manual A Step-by-Step Guide Emily Talen Transect Code Manual 1 Contents Introduction Who this Manual is for A brief history of how we got into this predicament Part I. The Basics A new approach
INVITATION TO NEGOTIATE DOWNTOWN DEVELOPMENT OF CITY- OWNED SITES WITH PRIVATE SECTOR INVESTMENT PARTICIPATION
 INVITATION TO NEGOTIATE DOWNTOWN DEVELOPMENT OF CITY- OWNED SITES WITH PRIVATE SECTOR INVESTMENT PARTICIPATION John Zobler, City Manager March 10, 2015 Review of Needs, Wants & Desires 2 2004 Downtown
Guidelines on Using California Land Use/Transportation Planning Tools
 Guidelines on Using California Land Use/Transportation Planning Tools 1. Selecting Ds Analysis Modules Appropriate to a Region In almost all cases, the appropriate Ds Analysis Module to use for analysis
CERTIFIED RESOLUTION. introduction: and dated May 29, 2017, as attached, as appropriate
 15322 Buena Vista Avenue, White Rock BC, Canada V4B 1Y6 www.whiterockcity.ca City of White Rock P: 604.541.22121 F: 604.541.9348 /2tC% City Clerk s Office IT E ROC K June 13,2017 Stephanie Lam, Deputy
New Partners for Smart Growth: Building Safe, Healthy, and Livable Communities Mayor Jay Williams, Youngstown OH
 New Partners for Smart Growth: Building Safe, Healthy, and Livable Communities Mayor Jay Williams, Youngstown OH The City of Youngstown Youngstown State University Urban Strategies Inc. Youngstown needed
CRP 608 Winter 10 Class presentation February 04, Senior Research Associate Kirwan Institute for the Study of Race and Ethnicity
 CRP 608 Winter 10 Class presentation February 04, 2010 SAMIR GAMBHIR SAMIR GAMBHIR Senior Research Associate Kirwan Institute for the Study of Race and Ethnicity Background Kirwan Institute Our work Using