GIS Geographic Information System
|
|
|
- Arron Tyler
- 6 years ago
- Views:
Transcription

1 GIS Geographic Information System Andrea Petroselli Tuscia University, Italy
2 SUMMARY Part 1: Part 2: Part 3: Part 4: What is a GIS? Why do we need a GIS? Which are the possibilities of a GIS? Practical example
3 Part 1: What is a GIS?
4 There are many definitions for a Geographic Information System mainly it is a computer based technology which provides the tools for collecting, editing, storing, retrieving, analyzing and displaying spatial data. A GIS can create new information from existing data. This thing is what distinguishes a GIS from a CAD (Computer Aided Design). These characteristics makes a GIS useful for a wide variety of applications.
5 Which are the Physical Components of a GIS? 1) Computer (hardware): one or many : one is a single position, many is a computer network 1) GIS software (the programs that run within the computer); Environmental Systems Research Institute (ESRI) is the world s largest supplier of GIS software. ESRI produces and sells different GIS sofware, for example: ArcMap, ArcInfo, ArcView 3) Georeferenced Data or information 4) GIS Analyst (people who use GIS)
6 What is Data? Data is the core of a GIS, because it is what GIS analyzes Data is a collection of observations and measurements usually related by a common theme (e.g.: Temperatures, Elevations, Land Cover, Population, Prices, and so on ) Data by itself has no particular value, but when we associate Data with Geographically Referenced information (spatial coordinates that describe the geographic location of the data) we obtain the Spatial Data, that is the core of GIS. The main characteristic of these Spatial Data is the fact that they have some Attributes
7 What are Attributes? Attributes are characteristics and information about spatial features. Information, built into a larger context, constructs knowledge. Examples include geographic names, management information, etc. Generally stored on the computer in a relational DataBase Management System (DBMS) that is part of the GIS software. So, another difference between GIS and CAD is the existence (and linking) of the Data with its Attributes that form the DataBase
8 These Data Attributes often are the ways to describe earth surface features. There are two descriptor choices: 1. Features are entities. Described by their attributes or properties. Position is mapped via a geographic coordinate system. E.g.: Land use/cover map, Population density They are: Discrete Data 2. Feature is a continuous surface or field. Variation occurs across time and/or space. E.g.: Slopes, Lake surface temperatures, Elevations They are: Continuous Data
9 The important thing is that all features (discrete or continuous) have a Spatial Reference System Spatial reference system is critical for a GIS to be operational and fully functional. Otherwise, the GIS software is nothing else than an expensive map display package. Spatial reference is a mechanism to situate measurements on a geometric body, such as the earth The spatial reference system (or coordinate system) provides a measure of absolute location as opposed to relative location (street address).
10 We can have several types of Spatial Information and Spatial Data Point Line Polygon (Vector Data or Shapefile) Point: just a location on the earth s surface. No width, no perimeter, neither area. E.g: the position on trees within a field Line: it is a linear feature in which width is not important, length is measured and important. E.g.: roads and rivers Polygon: it is a feature in which also area and its associated measurements are important. E.g.: whole fields, countries
11 The problem we have with vector formats (points, lines, polygons) is that they represent very well features like points, lines or polygons, but they do lack capability (not for us, but for the computer memory and/or its way to think and compute) to represent continuous surfaces o features; so when we have to represent and analyze continuous surfaces by computers we deal mainly with Raster Data (or GRID data) Raster Data is a gridded (simplified) representation of a continuous feature: The Grid format is made up of individual cells (pixels) where area is defined, in opposition with Vector format that is composed of nodes and arcs Each pixel in Raster Data or node in Vector Data is associated with a X, Y and possibly a Z coordinate (where Z does not mean always elevation ) E.g.: Elevation, Slopes, Aspects

 has a X, Y and Z coordinate (referred to the center of the")
12 Example of Raster Data: The tridimensional real feature (elevation) From the tridimensional we pass in the bidimensional representation The surface seems still continuous, but if we zoom in we see the gridded structure where every pixel (cell) has a X, Y and Z coordinate (referred to the center of the cell)
 and reconstruct the whole stream network")
13 Example of interaction between Raster and Vector Data: Elevation grid (Raster Data) Using the concept that water follows the steepest descent direction, starting from Grid Elevation, GIS Software can recognize where every cell is headed (comparing for every cell the 8 surrounding slopes and choosing as the flow direction that one with the greatest slope) and reconstruct the whole stream network (represented finally as a vector line) Stream network (Vector Data)


14 Why we choose vector data if it is possible ρ8 A representation of a linear feature with Raster Data is ugly to see, because if we zoom in we see a gridded scheme that is unrealistic, but in case of large territory is the only way to represent the feature
15 Part 1 Conclusions: A GIS is a mix of hardware, software and data that the analyst can use to manipulate territory The computers are the hardware, The programs (like the ones developed by ESRI) are the software; using hardware and software analyst can manage the data (Raster and Vector) and extract information from them. But what information?!
16 Part 2: Why do we need a GIS?
17 As said before in the definition, GIS is only a tool that the analyst can use to: collecting, editing, storing, retrieving, analyzing and displaying spatial data So, first of all, we must have (or create ) spatial data Once we have spatial data, GIS provides analyst whatever operation has to be performed on these data So, actually, we need GIS to do many things, but basically to MANAGE OUR ENVIRONMENT AND TAKE DECISIONS
18 Why GIS and why not without GIS? Geography has always been important to humans. Applied geography, in the form of maps and spatial information, has served for discovery, planning, commerce, and so on. Because spatial information is so important, have been developed tools called Geographic Information Systems (GIS) to help us deepen our geographic knowledge. Because GIS is only a tool, each GIS user decides what features are important, and what is important about them.
19 For example, Forests are important to many people. They protect our water supplies, yield wood, harbor wildlife, and provide space to recreate. We are concerned about the level of harvest, the adjacent land use, pollution from nearby industries, or when and where forests burn. Informed management of our forests requires at a minimum knowledge of all these related factors, and perhaps above all the spatial arrangement of these factors.
20 Buffer strips near rivers may protect water supplies, clearings may prevent the spread of fire, and polluters downwind may not harm our forests while polluters upwind might. A GIS aids immensely in the analysis of these spatial relationships and interactions among them. A GIS is also particularly useful at displaying spatial data and reporting the results of spatial analysis. In many instances GIS is the only way to solve spatially-related problems.
21 GIS use has become widespread during the past two decades. GIS have been used in fields from archeology to zoology, and new applications of GIS are continuously emerging. GIS are essential tools in business, government, education, and nonprofit organizations. GIS have been used to fight crime, protect endangered species, reduce pollution, cope with natural disasters, and to improve public health; In short, GIS have been instrumental in addressing some of our most pressing societal problems
22 Concluding, GIS are needed in part because human population and technology have reached levels such that many resources, including air, land and water (our environment), are placing substantial limits on human action. Human populations have doubled in the last 50 years, reaching 6 billion, and we will likely add another 5 billion humans in the next 50 years. The first 100,000 years of human existence caused few impacts on the World s resources, while in the past 300 years humans have permanently altered most of the Earth s surface.
23 Silt chokes many rivers and there are many localized examples where pollutants substantially harm public health. By the end of the 20th century most suitable lands had been inhabited and only a minority percentage of the terrestrial surface had not been farmed, grazed, cut, built over, drained, flooded, or otherwise altered by humans! In the end, spatial data organization and analyses are widely applied to improve life. And that is why GIS are widely used in planning and environmental protection.
24 Part 3: Which are the possibilities of a GIS?

25 How should be GIS use: effective use of GIS depends on a set of protocols and an integration into the data collection, analysis, decision, and action loop of an organization. GIS
26 For understanding the GIS possibilities we must go back to the points: 1) each GIS user decides what features are important, and what is important about them 2) a GIS is a mix of hardware, software and data that the analyst can use to manipulate territory and take decisions So GIS possibilities are endless, because endless are the fields of interest, and endless are the features to apply GIS to
27 For example, these are the functions commonly provided by GIS software.
28 Because many are the fields of interest, and many are the necessities, we have many kinds of GIS software from freeware to very expensive Each software has its advantages and its drawbacks Some software is used at its top to describe Vector Data, others to manipulate and analyze Raster Data Some software is used with GPS Survey, other with Remote Satellite Survey, Some software works better with the production of maps and graphic output and others to make calculation between maps, and so on
29 The main GIS software are: a) ArcGIS, developed by ESRI, California. There are many versions of ArcGIS, from Arcview to ArcInfo: 1) ArcView: is an entry-level component of ArcGIS. GIS functions are provided for basic data entry, editing, and attribute and coordinate manipulation. Basic spatial data analyses are supported, and rapid, easy, basic map layout and printing capabilities are provided. 2) ArcInfo is the comprehensive GIS toolbox from ESRI. It is a large, complex, sophisticated product. It supports multiple data formats, many data types and structures, and literally thousands of possible operations that may be applied to spatial data. Substantial training is required to master the full capabilities of ArcInfo
30 b) MapInfo: it is a comprehensive set of GIS products developed and sold by the Map-Info Corporation, of Troy, New York. Map-Info products are used in a broad array of endeavors, although use seems to be concentrated in many business and municipal applications. c) Idrisi: it is a GIS system developed by Clark University, in Massachusetts. Idrisi differs from the previously discussed GIS software packages in that it provides both image processing (mainly for remotely sensed Digital Elevation Models) and GIS functions. d) AutoCAD Map: Produced by Autodesk of San Rafael, California, AUTOCAD began as an engineering drawing and printing tool. AUTOCAD MAP adds analytical capability to the already complete set of data input, coordinate manipulation, and data output tools provided by AUTOCAD, but it works better with Vector Data and less well with Raster Data.
31 e) Manifold: it is a relatively inexpensive GIS package with a surprising number of capabilities. Basic spatial data entry and editing support are provided, as well as basic vector and raster analysis, image display and editing, and output. The program is extensible through a series of software modules. Modules are available for surface analysis, business applications, internet map development and serving, database support, and advanced analyses. Manifold GIS is different from other packages in providing sophisticated image editing capabilities, much like Adobe Photoshop, but in a spatially-reference framework. By the way, the most used GIS sofware are Arcview and ArcInfo, and later these two will be explored
32 Turning back to possibilities, we have seen that, due to the large number of GIS software in the world and due to their use in many fields of interest, these possibilities are virtually endless We are interested, by the way, in the environment management, in particular to what does happen on territory, and when we talk about land and territory (i.e. a large region), we are forced to deal with Raster Data. There is an important (maybe the most important of all) Raster Data that you can obtain when your attribute is the Elevation. In this case we don t talk about Raster Data but we talk about DIGITAL ELEVATION MODEL (DEM)
.")
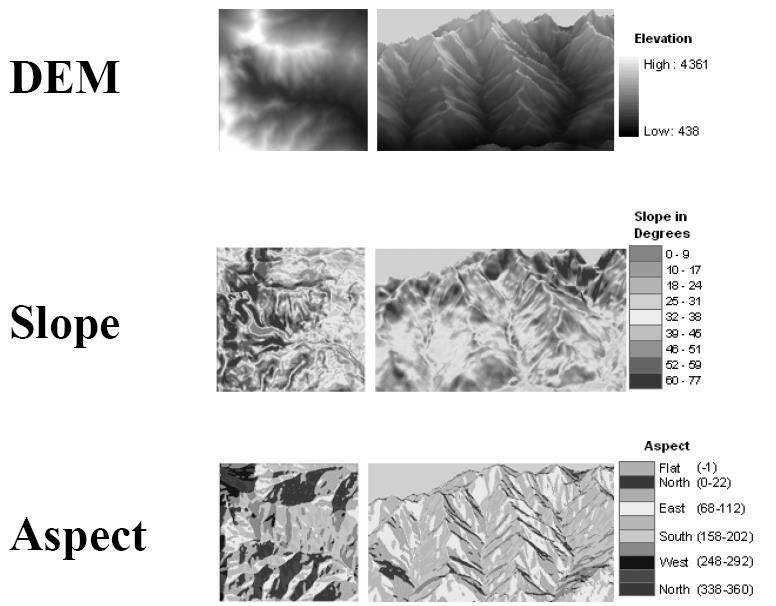
33 An example of Digital Elevation Model Digital Elevation Model Data: as the others Raster Data, it is a matrix of cells regularly spaced, where the attribute is the elevation datum, usually measured at particular ground positions and later interpolated in order to reconstruct the whole matrix of cells. This operation of interpolation is done applying several techniques (i.e. Kriging). DEMs are useful because, from them, we can obtain other interesting data
34 Two Types of Data Commonly Derived from DEMs: Slope and Aspect Slope - change in elevation over a predefined distance. With a raster base DEM the predefined distance is usually the pixel size. Aspect - orientation or direction that a surfaces faces, with respect to the direction of North. Both maintain the raster format of the DEM. Spatial resolution of the slope and the aspect images cannot be finer than the spatial resolution of the DEM.
35 Plant Assonometric view
36 For example, in the case of Slope, ArcGIS calculates slope using a 3 X 3 moving window. Data is replicated along the edges of the image to create a pseudo 3 X 3 window. The Slope value for the central cell is calculated as follows, starting from the values of the 8 surrounding elevation values: d

37 instead, in the case of Aspect, The Aspect value for the central cell of the 3 X 3 moving window is calculated as follows, starting always from the values of the 8 surrounding elevation values:
38 But Slope and Aspect are not the only features we can derive from a DEM: Applications are numerous: calculate solar insolation; watershed determination; viewshed; construction (roads/harvest operations); soil erosion (Universal Soil Loss Equation); contour lines; hillshade

39 Example: Contour Lines Polylines (Vector Data) that connect points (elevations) of equal value. Their distribution shows how elevations change across a surface and it is an example of interaction between Raster and Vector Data. Close- much change; Far apart- little change


40 Example: Hillshade Shows the hypothetical illumination of a surface by determining illumination values for each cell in a raster which is the same file size and spatial resolution of the DEM. A position is determined for the light source and illumination values are calculated for each cell in relation to neighboring cells. For graphical purposes shows terrain relief in relation to other Layers; For analytical purposes show illumination across the landscape by adjusting the sun angle for each hour of the day.

41 Example: Viewshed What is a good purpose for the viewshed tool?


42 The answer is the Line of Sight Analysis A line of sight is a line between 2 points that show the parts of the surface along the line that are visible to or hidden from the observer. Creating a line of sight lets you determine whether or not a given point is visible from another point.
43 Part 4: Practical example (Using ArcInfo) Watershed Delineation

44 A watershed is an area that drains water to a common outlet as a concentrated drainage. This area is normally defined as the total area flowing to a given outlet, or pour point. Watershed delineation is the process of identifying the drainage area of a point or set of points. For years, have been determined using paper maps

45 How is it possible identify Watershed from DEM? We know that water flows in the direction of the terrain s steepest downhill slope and is orthogonal to the elevation contour lines.

46 Streamlines do not flow towards drainage divides, and do not intersect them. Drainage divides are found along the highest points of the terrain. DEMs store the same type of information as contour lines but with a different data structure (Raster) Outlet
47 ArcInfo is organized in modules, everyone of it doing specific operations: in particular ArcInfo has a hydrology package within the toolbox under the Spatial Analyst tools.
48 This is the scheme by which we can derive watershed; saddly, it is not a simple operation (as usual!) because it is the result of several steps one after the other:

49 a) Calculating Flow Direction: Water flows to one of its neighbor cells according to the direction of the steepest descent. Flow direction takes one out of eight possible values, codified in this way. The eight-direction pour point algorithm assigns a flow direction code to each cell, based on the steepest downhill slope as defined by the DEM. The flow direction code indicates the cell out of the eight neighbor cells towards which the water flows.

, and interpolation methods used to create regularly spaced.")
50 b) Sinks Removal The problem rises because in every DEM we have errors related to uncertainties in elevation data acquisition methods (GPS, SRTM, digitalization topographic maps, laser scanning, etc.), and interpolation methods used to create regularly spaced. The final effect on DEM is the presence of sinks or pits: Pit
 Map, because otherwise we wold see these effect of Pits on drainage")
51 These pits must be removed before calculating the real Flow Direction (and then Watershed) Map, because otherwise we wold see these effect of Pits on drainage network:
52 GEMINI Department Water Engineering Section Andrea Petroselli The most used approach (ESRI ArcInfo) to remove pits is the Filling method (FILL command) that arises the elevation of the pit until the lower elevation between the 8 surroundig cells:
53 This DEM is the result of a Filling operation (application on FILL command on ArcInfo)

54 On the previous DEM it is possible now to calculate the exact Flow direction (application on FLOWDIRECTION command on ArcInfo)

55 Starting now from the Flow direction Raster it is possible to determine the Flow accumulation Map (application on FLOWACCUMULATION command on ArcInfo) Flow accumulation is a measure of the drainage area in units of grid cells, and it is much similar to the river network Infact output cells with a high flow accumulation are areas of concentrated flow and may be used to identify stream channels. Output cells with a flow accumulation of zero are local topographic highs and may be used to identify ridges.
")
56 On the basis of the Flow accumulation Map we can choose our outlet (it must stay on the river network ) OUtlet

57 And the ArcInfo command WATERSHED will extract, combining the information of the outlet with that of the flow direction, our watershed. In this way we are able, with every DEM and choosing every possible outlet, to know how much area has the watershed, which is, which rivers insist within the watershed, and so on
58 Thank you for your attention
4. GIS Implementation of the TxDOT Hydrology Extensions
 4. GIS Implementation of the TxDOT Hydrology Extensions A Geographic Information System (GIS) is a computer-assisted system for the capture, storage, retrieval, analysis and display of spatial data. It
Popular Mechanics, 1954
 Introduction to GIS Popular Mechanics, 1954 1986 $2,599 1 MB of RAM 2017, $750, 128 GB memory, 2 GB of RAM Computing power has increased exponentially over the past 30 years, Allowing the existence of
Introduction-Overview. Why use a GIS? What can a GIS do? Spatial (coordinate) data model Relational (tabular) data model
 data model Relational (tabular) data model") Introduction-Overview Why use a GIS? What can a GIS do? How does a GIS work? GIS definitions Spatial (coordinate) data model Relational (tabular) data model intro_gis.ppt 1 Why use a GIS? An extension
Introduction-Overview Why use a GIS? What can a GIS do? How does a GIS work? GIS definitions Spatial (coordinate) data model Relational (tabular) data model intro_gis.ppt 1 Why use a GIS? An extension
NR402 GIS Applications in Natural Resources
 NR402 GIS Applications in Natural Resources Lesson 1 Introduction to GIS Eva Strand, University of Idaho Map of the Pacific Northwest from http://www.or.blm.gov/gis/ Welcome to NR402 GIS Applications in
![)UDQFR54XHQWLQ(DQG'tD]'HOJDGR&](/thumbs/95/125846872.jpg ")UDQFR54XHQWLQ(DQG'tD]'HOJDGR&") &21&(37,21$1',03/(0(17$7,212)$1+
&21&(37,21$1',03/(0(17$7,212)$1+ ENGRG Introduction to GIS
 ENGRG 59910 Introduction to GIS Michael Piasecki March 17, 2014 Lecture 08: Terrain Analysis Outline: Terrain Analysis Earth Surface Representation Contour TIN Mass Points Digital Elevation Models Slope
ENGRG Introduction to GIS
 ENGRG 59910 Introduction to GIS Michael Piasecki November 17, 2017 Lecture 11: Terrain Analysis Outline: Terrain Analysis Earth Surface Representation Contour TIN Mass Points Digital Elevation Models Slope
Techniques for Science Teachers: Using GIS in Science Classrooms.
 Techniques for Science Teachers: Using GIS in Science Classrooms. After ESRI, 2008 GIS A Geographic Information System A collection of computer hardware, software, and geographic data used together for
ENV208/ENV508 Applied GIS. Week 1: What is GIS?
 ENV208/ENV508 Applied GIS Week 1: What is GIS? 1 WHAT IS GIS? A GIS integrates hardware, software, and data for capturing, managing, analyzing, and displaying all forms of geographically referenced information.
GIS = Geographic Information Systems;
 What is GIS GIS = Geographic Information Systems; What Information are we talking about? Information about anything that has a place (e.g. locations of features, address of people) on Earth s surface,
MODULE 7 LECTURE NOTES 5 DRAINAGE PATTERN AND CATCHMENT AREA DELINEATION
 MODULE 7 LECTURE NOTES 5 DRAINAGE PATTERN AND CATCHMENT AREA DELINEATION 1. Introduction Topography of the river basin plays an important role in hydrologic modelling, by providing information on different
Outline. Chapter 1. A history of products. What is ArcGIS? What is GIS? Some GIS applications Introducing the ArcGIS products How does GIS work?
 Outline Chapter 1 Introducing ArcGIS What is GIS? Some GIS applications Introducing the ArcGIS products How does GIS work? Basic data formats The ArcCatalog interface 1-1 1-2 A history of products Arc/Info
Introduction to GIS I
 Introduction to GIS Introduction How to answer geographical questions such as follows: What is the population of a particular city? What are the characteristics of the soils in a particular land parcel?
Remote Sensing and GIS Applications for Hilly Watersheds SUBASHISA DUTTA DEPARTMENT OF CIVIL ENGINEERING IIT GUWAHATI
 Remote Sensing and GIS Applications for Hilly Watersheds SUBASHISA DUTTA DEPARTMENT OF CIVIL ENGINEERING IIT GUWAHATI Deciding Alternative Land Use Options in a Watershed Using GIS Source: Anita Prakash
Geography 38/42:376 GIS II. Topic 1: Spatial Data Representation and an Introduction to Geodatabases. The Nature of Geographic Data
 Geography 38/42:376 GIS II Topic 1: Spatial Data Representation and an Introduction to Geodatabases Chapters 3 & 4: Chang (Chapter 4: DeMers) The Nature of Geographic Data Features or phenomena occur as
Hydrology and Floodplain Analysis, Chapter 10
 Hydrology and Floodplain Analysis, Chapter 10 Hydrology and Floodplain Analysis, Chapter 10.1 Introduction to GIS GIS Geographical Information System Spatial Data Data linked with geographical location
Introduction to Geographic Information Systems
 Introduction to Geographic Information Systems Lynn_Carlson@brown.edu 401-863-9917 The Environmental And Remote TecHnologies Lab MacMillan Hall, Room 105 http://www.brown.edu/research/earthlab/ Outline
Geo-spatial Analysis for Prediction of River Floods
 Geo-spatial Analysis for Prediction of River Floods Abstract. Due to the serious climate change, severe weather conditions constantly change the environment s phenomena. Floods turned out to be one of
Applied Cartography and Introduction to GIS GEOG 2017 EL. Lecture-2 Chapters 3 and 4
 Applied Cartography and Introduction to GIS GEOG 2017 EL Lecture-2 Chapters 3 and 4 Vector Data Modeling To prepare spatial data for computer processing: Use x,y coordinates to represent spatial features
An Introduction to Geographic Information System
 An Introduction to Geographic Information System PROF. Dr. Yuji MURAYAMA Khun Kyaw Aung Hein 1 July 21,2010 GIS: A Formal Definition A system for capturing, storing, checking, Integrating, manipulating,
software, just as word processors or databases are. GIS was originally developed and cartographic capabilities have been augmented by analysis tools.
 1. INTRODUCTION 1.1Background A GIS is a Geographic Information System, a software package for creating, viewing, and analyzing geographic information or spatial data. GIS is a class of software, just
13 Watershed Delineation & Modeling
 Module 4 (L12 - L18): Watershed Modeling Standard modeling approaches and classifications, system concept for watershed modeling, overall description of different hydrologic processes, modeling of rainfall,
Using Earthscope and B4 LiDAR data to analyze Southern California s active faults
 Using Earthscope and B4 LiDAR data to analyze Southern California s active faults Exercise 8: Simple landscape morphometry and stream network delineation Introduction This exercise covers sample activities
Lab 1: Landuse and Hydrology, learning ArcGIS II. MANIPULATING DATA
 Lab 1: Landuse and Hydrology, learning ArcGIS II. MANIPULATING DATA As you experienced in the first lab session when you created a hillshade, high resolution data can be unwieldy if you are trying to perform
What are the five components of a GIS? A typically GIS consists of five elements: - Hardware, Software, Data, People and Procedures (Work Flows)
") LECTURE 1 - INTRODUCTION TO GIS Section I - GIS versus GPS What is a geographic information system (GIS)? GIS can be defined as a computerized application that combines an interactive map with a database
LECTURE 1 - INTRODUCTION TO GIS Section I - GIS versus GPS What is a geographic information system (GIS)? GIS can be defined as a computerized application that combines an interactive map with a database
Welcome to NR502 GIS Applications in Natural Resources. You can take this course for 1 or 2 credits. There is also an option for 3 credits.
 Welcome to NR502 GIS Applications in Natural Resources. You can take this course for 1 or 2 credits. There is also an option for 3 credits. The 1st credit consists of a series of readings, demonstration,
Course overview. Grading and Evaluation. Final project. Where and When? Welcome to REM402 Applied Spatial Analysis in Natural Resources.
 Welcome to REM402 Applied Spatial Analysis in Natural Resources Eva Strand, University of Idaho Map of the Pacific Northwest from http://www.or.blm.gov/gis/ Where and When? Lectures Monday & Wednesday
Introduction to Geographic Information Systems (GIS): Environmental Science Focus
: Environmental Science Focus") Introduction to Geographic Information Systems (GIS): Environmental Science Focus September 9, 2013 We will begin at 9:10 AM. Login info: Username:!cnrguest Password: gocal_bears Instructor: Domain: CAMPUS
Introduction to Geographic Information Systems (GIS): Environmental Science Focus September 9, 2013 We will begin at 9:10 AM. Login info: Username:!cnrguest Password: gocal_bears Instructor: Domain: CAMPUS
GIS Boot Camp for Education June th, 2011 Day 1. Instructor: Sabah Jabbouri Phone: (253) x 4854 Office: TC 136
 x 4854 Office: TC 136") GIS Boot Camp for Education June 27-30 th, 2011 Day 1 Instructor: Sabah Jabbouri Phone: (253) 833-9111 x 4854 Office: TC 136 Email: sjabbouri@greenriver.edu http://www.instruction.greenriver.edu/gis/ Summer
GIS Boot Camp for Education June 27-30 th, 2011 Day 1 Instructor: Sabah Jabbouri Phone: (253) 833-9111 x 4854 Office: TC 136 Email: sjabbouri@greenriver.edu http://www.instruction.greenriver.edu/gis/ Summer
Delineation of Watersheds
 Delineation of Watersheds Adirondack Park, New York by Introduction Problem Watershed boundaries are increasingly being used in land and water management, separating the direction of water flow such that
Watershed Delineation in GIS Environment Rasheed Saleem Abed Lecturer, Remote Sensing Centre, University of Mosul, Iraq
 Watershed Delineation in GIS Environment Rasheed Saleem Abed Lecturer, Remote Sensing Centre, University of Mosul, Iraq Abstract: The management and protection of watershed areas is a major issue for human
Working with Digital Elevation Models in ArcGIS 8.3
 Working with Digital Elevation Models in ArcGIS 8.3 The homework that you need to turn in is found at the end of this document. This lab continues your introduction to using the Spatial Analyst Extension
GeoWEPP Tutorial Appendix
 GeoWEPP Tutorial Appendix Chris S. Renschler University at Buffalo - The State University of New York Department of Geography, 116 Wilkeson Quad Buffalo, New York 14261, USA Prepared for use at the WEPP/GeoWEPP
CS 350 A Computing Perspective on GIS
 CS 350 A Computing Perspective on GIS What is GIS? Definitions A powerful set of tools for collecting, storing, retrieving at will, transforming and displaying spatial data from the real world (Burrough,
GEOGRAPHIC INFORMATION SYSTEMS
 GEOGRAPHIC INFORMATION SYSTEMS 4-H Round-Up Community Transitions Workshop Daniel Hanselka June 14, 2011 Goals of the Workshop Answer the question: What is GIS? Uses of GIS. Some of the Common Terminology
Basics of GIS. by Basudeb Bhatta. Computer Aided Design Centre Department of Computer Science and Engineering Jadavpur University
 Basics of GIS by Basudeb Bhatta Computer Aided Design Centre Department of Computer Science and Engineering Jadavpur University e-governance Training Programme Conducted by National Institute of Electronics
GIS (GEOGRAPHIC INFORMATION SYSTEMS)
") GIS (GEOGRAPHIC INFORMATION SYSTEMS) 1 1. DEFINITION SYSTEM Any organised assembly of resources and procedures united and regulated by interaction or interdependence to complete a set of specific functions.
GIS (GEOGRAPHIC INFORMATION SYSTEMS) 1 1. DEFINITION SYSTEM Any organised assembly of resources and procedures united and regulated by interaction or interdependence to complete a set of specific functions.
GRAPEVINE LAKE MODELING & WATERSHED CHARACTERISTICS
 GRAPEVINE LAKE MODELING & WATERSHED CHARACTERISTICS Photo Credit: Lake Grapevine Boat Ramps Nash Mock GIS in Water Resources Fall 2016 Table of Contents Figures and Tables... 2 Introduction... 3 Objectives...
PRINCIPLES OF GIS. 1 Low
 PRINCIPLES OF GIS Dhubri 1 Low Water Very High Vegetation High Vegetation Medium vegetatin vegetation Sand/bars Dhubri Dr. R N Sankhua Capture Store Computer Mapping People Analyze Display Query Software
THE 3D SIMULATION INFORMATION SYSTEM FOR ASSESSING THE FLOODING LOST IN KEELUNG RIVER BASIN
 THE 3D SIMULATION INFORMATION SYSTEM FOR ASSESSING THE FLOODING LOST IN KEELUNG RIVER BASIN Kuo-Chung Wen *, Tsung-Hsing Huang ** * Associate Professor, Chinese Culture University, Taipei **Master, Chinese
Display data in a map-like format so that geographic patterns and interrelationships are visible
 Vilmaliz Rodríguez Guzmán M.S. Student, Department of Geology University of Puerto Rico at Mayagüez Remote Sensing and Geographic Information Systems (GIS) Reference: James B. Campbell. Introduction to
SRJC Applied Technology 54A Introduction to GIS
 SRJC Applied Technology 54A Introduction to GIS Overview Lecture of Geographic Information Systems Fall 2004 Santa Rosa Junior College Presented By: Tim Pudoff, GIS Coordinator, County of Sonoma, Information
Lab 1: Importing Data, Rectification, Datums, Projections, and Coordinate Systems
 Lab 1: Importing Data, Rectification, Datums, Projections, and Coordinate Systems Topics covered in this lab: i. Importing spatial data to TAS ii. Rectification iii. Conversion from latitude/longitude
Lab 1: Importing Data, Rectification, Datums, Projections, and Output (Mapping)
") Lab 1: Importing Data, Rectification, Datums, Projections, and Output (Mapping) Topics covered in this lab: i. Importing spatial data to TAS ii. Rectification iii. Conversion from latitude/longitude to
Lab 1: Importing Data, Rectification, Datums, Projections, and Output (Mapping) Topics covered in this lab: i. Importing spatial data to TAS ii. Rectification iii. Conversion from latitude/longitude to
Introduction to GIS. Geol 4048 Geological Applications of Remote Sensing
 Introduction to GIS Geol 4048 Geological Applications of Remote Sensing GIS History: Before Computers GIS History Using maps for a long time Dr. Roger F. Tomlinson Father of GIS He was an English geographer
RiparianZone = buffer( River, 100 Feet )
") GIS Analysts perform spatial analysis when they need to derive new data from existing data. In GIS I, for example, you used the vector approach to derive a riparian buffer feature (output polygon) around
GIS Analysts perform spatial analysis when they need to derive new data from existing data. In GIS I, for example, you used the vector approach to derive a riparian buffer feature (output polygon) around
DATA SOURCES AND INPUT IN GIS. By Prof. A. Balasubramanian Centre for Advanced Studies in Earth Science, University of Mysore, Mysore
 DATA SOURCES AND INPUT IN GIS By Prof. A. Balasubramanian Centre for Advanced Studies in Earth Science, University of Mysore, Mysore 1 1. GIS stands for 'Geographic Information System'. It is a computer-based
GIS IN ECOLOGY: ANALYZING RASTER DATA
 GIS IN ECOLOGY: ANALYZING RASTER DATA Contents Introduction... 2 Raster Tools and Functionality... 2 Data Sources... 3 Tasks... 4 Getting Started... 4 Creating Raster Data... 5 Statistics... 8 Surface
BSEN 6220 GIS LAB #5
 BSEN 6220 GIS LAB #5 Dustin Till 10/29/2014 INTRODUCTION: ArcGIS is a geographic information system for working with maps and geographic information. It is used for creating and using maps, compiling geographic
Syllabus Reminders. Geographic Information Systems. Components of GIS. Lecture 1 Outline. Lecture 1 Introduction to Geographic Information Systems
 Syllabus Reminders Geographic Information s Lecture Introduction to Geographic Information s. Class Info: www.saigis.com/class/ 2. Office T / TH (8:00-9:30 a.m.) and (2:30 3:30pm) or Appt 3. Email: burgerpr@unk.edu
Week 7 Last week: This week s topics. GIS and Forest Engineering Applications. FE 257. GIS and Forest Engineering Applications.
 FE 257. GIS and Forest Engineering Applications Week 7 Week 7 Last week: Spatial Projections Questions? Next week- read: Chapter 10: Updating GIS Databases Chapter 12: Synthesis of Techniques Applied to
Hydrologic Engineering Applications of Geographic Information Systems
 Hydrologic Engineering Applications of Geographic Information Systems Davis, California Objectives: The participant will acquire practical knowledge and skills in the application of GIS technologies for
Georelational Vector Data Model
 Georelational Vector Data Model Contents Georelational Data Model Representation of Simple Features Topology Non-topological Vector Data Data Models for Composite Features Geo-relational Looking at a paper
Key Processes
 Data Manipulation and Extraction Key Processes Key Processes Re-Projecting Data Selecting by Attributes Exporting Data Hillshade Reclassification Conversion of Raster to Vector Re-Projecting Data Purpose
It s a Model. Quantifying uncertainty in elevation models using kriging
 It s a Model Quantifying uncertainty in elevation models using kriging By Konstantin Krivoruchko and Kevin Butler, Esri Raster based digital elevation models (DEM) are the basis of some of the most important
Introduction to the 176A labs and ArcGIS
 Introduction to the 176A labs and ArcGIS Acknowledgement: Slides by David Maidment, U Texas-Austin and Francisco Olivera (TAMU) Purpose of the labs Hands-on experience with one software pakage Introduction
Digital Elevation Models. Using elevation data in raster format in a GIS
 Digital Elevation Models Using elevation data in raster format in a GIS What is a Digital Elevation Model (DEM)? Digital representation of topography Model based on scale of original data Commonly a raster
GIS feature extraction tools in diverse landscapes
 CE 394K.3 GIS in Water Resources GIS feature extraction tools in diverse landscapes Final Project Anna G. Kladzyk M.S. Candidate, Expected 2015 Department of Environmental and Water Resources Engineering
Welcome to NetMap Portal Tutorial
 Welcome to NetMap Portal Tutorial Potential Applications What Can you do with the Portal? At least 25 things! 1) Locate the best potential fish habitats. 2) Identify biological hotspots. 3) Map floodplain
GIS in Water Resources Midterm Exam Fall 2008 There are 4 questions on this exam. Please do all 4.
 Page 1 of 8 Name: GIS in Water Resources Midterm Exam Fall 2008 There are 4 questions on this exam. Please do all 4. 1. Basic Concepts [20 points] Find the letter with the best answer for each term: 1.
GIS APPLICATIONS IN SOIL SURVEY UPDATES
 GIS APPLICATIONS IN SOIL SURVEY UPDATES ABSTRACT Recent computer hardware and GIS software developments provide new methods that can be used to update existing digital soil surveys. Multi-perspective visualization
ARCGIS PRO COURSE, APPLIED TO ENVIROMENTAL MANAGEMENT GIS. Course. Training. .com
 ARC PRO COURSE, APPLIED TO ENVIROMENTAL MANAGEMENT TYC Training Course.com TRAINING OVERVIEW This Arc Pro online course will provide a great deal of information about the link between earth s ecosystems
ISSUES AND APPROACHES TO COUPLING GIS TO AN IRRIGATION DISTRIBUTION NETWORK AND SEEPAGE LOSS MODELS ABSTRACT
 ISSUES AND APPROACHES TO COUPLING GIS TO AN IRRIGATION DISTRIBUTION NETWORK AND SEEPAGE LOSS MODELS Yanbo Huang 1, Milton Henry 2, David Flahive 3, Guy Fipps 4 ABSTRACT Geographic Information Systems (GIS)
Introduction to GIS. Dr. M.S. Ganesh Prasad
 Introduction to GIS Dr. M.S. Ganesh Prasad Department of Civil Engineering The National Institute of Engineering, MYSORE ganeshprasad.nie@gmail.com 9449153758 Geographic Information System (GIS) Information
Watershed Modeling With DEMs
 Watershed Modeling With DEMs Lesson 6 6-1 Objectives Use DEMs for watershed delineation. Explain the relationship between DEMs and feature objects. Use WMS to compute geometric basin data from a delineated
INTRODUCTION TO GEOGRAPHIC INFORMATION SYSTEM By Reshma H. Patil
 INTRODUCTION TO GEOGRAPHIC INFORMATION SYSTEM By Reshma H. Patil ABSTRACT:- The geographical information system (GIS) is Computer system for capturing, storing, querying analyzing, and displaying geospatial
Louisiana Transportation Engineering Conference. Monday, February 12, 2007
 Louisiana Transportation Engineering Conference Monday, February 12, 2007 Agenda Project Background Goal of EIS Why Use GIS? What is GIS? How used on this Project Other site selection tools I-69 Corridor
How to Pick a GIS. GIS Software Chapter 8 in Longley, Goodchild, Maguire, and Rhind,, 2001
 How to Pick a GIS GIS Software Chapter 8 in Longley, Goodchild, Maguire, and Rhind,, 2001 How to Pick a GIS Evolution of GIS software Architecture of GIS software Types of software Example products The
Automatic Watershed Delineation using ArcSWAT/Arc GIS
 Automatic Watershed Delineation using ArcSWAT/Arc GIS By: - Endager G. and Yalelet.F 1. Watershed Delineation This tool allows the user to delineate sub watersheds based on an automatic procedure using
FNRM 3131 Introduction to GIS in Natural Resource Management
 FNRM 3131 Introduction to GIS in Natural Resource Management Instructors: Andrew C Jenks 215 Green Hall ajenks@umnedu, @acjenks Paul V Bolstad 301H Green Hall pbolstad@umnedu Course Topics Motivation:
Teaching GIS for Land Surveying
 Teaching GIS for Land Surveying Zhanjing (John) Yu Evergreen Valley College, San Jose, California James Crossfield California State University at Fresno, Fresno California 7/13/2006 1 Outline of the Presentation
Using ArcGIS for Hydrology and Watershed Analysis:
 Using ArcGIS 10.2.2 for Hydrology and Watershed Analysis: A guide for running hydrologic analysis using elevation and a suite of ArcGIS tools Anna Nakae Feb. 10, 2015 Introduction Hydrology and watershed
Use of ArcGIS Applications for Analysis and Representation of the Terrains: The Case Study of Alakır River Sub-basin
 Use of ArcGIS Applications for Analysis and Representation of the Terrains: The Case Study of Alakır River Sub-basin Ahmet BENLİAY, Tahsin YILMAZ and H. Ekin OKTAY 1 Introduction 3D visualizations have
GIS PLANNING FOR MILITARY OPERATIONS
 International Conference for ESRI Users 2015 July 20 24, 2015 San Diego, California. USA GIS PLANNING FOR MILITARY OPERATIONS JOSE LUIS PAYARES VARELA ANDRES CARVAJAL DÍAZ FERNANDO AFANADOR FRANCO DEPARTMENT
Open ArcToolbox Spatial Analyst Tools Hydrology. This should display the tools shown at the right:
 Project 2: Watershed Functions Save and close your project, above, if you haven t done so already. Then, open a new project, and add the driftless DEM. We ll be using ArcToolbox for this new project, but
Creating Watersheds from a DEM
 Creating Watersheds from a DEM These instructions enable you to create watersheds of specified area using a good quality Digital Elevation Model (DEM) in ArcGIS 8.1. The modeling is performed in ArcMap
Geometric Algorithms in GIS
 Geometric Algorithms in GIS GIS Software Dr. M. Gavrilova GIS System What is a GIS system? A system containing spatially referenced data that can be analyzed and converted to new information for a specific
Understanding Geographic Information System GIS
 Understanding Geographic Information System GIS What do we know about GIS? G eographic I nformation Maps Data S ystem Computerized What do we know about maps? Types of Maps (Familiar Examples) Street Maps
Using the Stock Hydrology Tools in ArcGIS
 Using the Stock Hydrology Tools in ArcGIS This lab exercise contains a homework assignment, detailed at the bottom, which is due Wednesday, October 6th. Several hydrology tools are part of the basic ArcGIS
Application of Geographical Information System (GIS) tools in watershed analysis
 tools in watershed analysis") Application of Geographical Information System (GIS) tools in watershed analysis Paritosh Gupta 1, Damanjit S Minhas 2, Rajendra M Tamhane 1, A K Mookerjee 2 1.ESRI India New Delhi 2. LEA Associates South
Application of Geographical Information System (GIS) tools in watershed analysis Paritosh Gupta 1, Damanjit S Minhas 2, Rajendra M Tamhane 1, A K Mookerjee 2 1.ESRI India New Delhi 2. LEA Associates South
Watershed Delineation
 Watershed Delineation Jessica L. Watkins, University of Georgia 2 April 2009 Updated by KC Love February 25, 2011 PURPOSE For this project, I delineated watersheds for the Coweeta synoptic sampling area
MAPPING POTENTIAL LAND DEGRADATION IN BHUTAN
 MAPPING POTENTIAL LAND DEGRADATION IN BHUTAN Moe Myint, Geoinformatics Consultant Rue du Midi-8, CH-1196, Gland, Switzerland moemyint@bluewin.ch Pema Thinley, GIS Analyst Renewable Natural Resources Research
These modules are covered with a brief information and practical in ArcGIS Software and open source software also like QGIS, ILWIS.
 Online GIS Training and training modules covered are: 1. ArcGIS, Analysis, Fundamentals and Implementation 2. ArcGIS Web Data Sharing 3. ArcGIS for Desktop 4. ArcGIS for Server These modules are covered
GIS Workshop Data Collection Techniques
 GIS Workshop Data Collection Techniques NOFNEC Conference 2016 Presented by: Matawa First Nations Management Jennifer Duncan and Charlene Wagenaar, Geomatics Technicians, Four Rivers Department QA #: FRG
Key Questions and Issues. What is GIS? GIS is to geographic analysis as: What is GIS? 9/3/2013. GEO 327G/386G, UT Austin 1
 What is GIS? Key Questions and Issues Geology Elevation Transportation Hydrography Imagery What is GIS? What are the applications of GIS? How is the real world represented in GIS? What analyses can GIS
The Geodatabase Working with Spatial Analyst. Calculating Elevation and Slope Values for Forested Roads, Streams, and Stands.
 GIS LAB 7 The Geodatabase Working with Spatial Analyst. Calculating Elevation and Slope Values for Forested Roads, Streams, and Stands. This lab will ask you to work with the Spatial Analyst extension.
Geographical Information System (GIS) Prof. A. K. Gosain
 Prof. A. K. Gosain") Geographical Information System (GIS) Prof. A. K. Gosain gosain@civil.iitd.ernet.in Definition of GIS GIS - Geographic Information System or a particular information system applied to geographical data
Geographical Information System (GIS) Prof. A. K. Gosain gosain@civil.iitd.ernet.in Definition of GIS GIS - Geographic Information System or a particular information system applied to geographical data
Government GIS and its Application for Decision Support
 Government GIS and its Application for Decision Support Zhang Qingpu (Chinese Academy of Surveying and Mapping, Email: zhangqp@casm.ac.cn) Abstract: Application of GIS in government agencies is called
Geographic Information Systems. Introduction to Data and Data Sources
 Geographic Information Systems Introduction to Data and Data Sources Presented by John Showler, NJDA-SSCC NJ SCD GIS Training Session December 10, 209 The Objectives of this session are 3-fold: 1. Introduce
Determination of Urban Runoff Using ILLUDAS and GIS
 Texas A&M University Department of Civil Engineering Instructor: Dr. Francisco Olivera CVEN689 Applications of GIS to Civil Engineering Determination of Urban Runoff Using ILLUDAS and GIS Tae Jin Kim 03.
INTRODUCTION AND PRINCIPLES OF GIS. Sunil Kumar. Introduction
 INTRODUCTION AND PRINCIPLES OF GIS Introduction Sunil Kumar Director, NWA Geographic Information System (GIS) is a computer based system designed to accept large volume of spatial data derived from a variety
Applications: Introduction Task 1: Introduction to ArcCatalog Task 2: Introduction to ArcMap Challenge Question References
 CHAPTER 1 INTRODUCTION 1.1 GIS? 1.1.1 Components of a GIS 1.1.2 A Brief History of GIS 1.1.3 GIS Software Products Box 1.1 A List of GIS Software Producers and Their Main Products 1.2 GIS Applications
G I S. Data and meaning of data Collections of facts, knowledge base, personal or collective values
 G I S Geographic? Reality Spatial location, scale, and time Information? Data and meaning of data Collections of facts, knowledge base, personal or collective values Systems? Computers and methods Physical
Basin characteristics
 Basin characteristics From hydrological processes at the point scale to hydrological processes throughout the space continuum: point scale à river basin The watershed characteristics (shape, length, topography,
GEOGRAPHIC INFORMATION SYSTEMS (GIS)
") AN INTRODUCTION TO GEOGRAPHIC INFORMATION SYSTEMS (GIS) Joana Magos Brehm 1, Ali Shehadeh 2 1 Botanical Garden, National Museum of Natural History, University of Lisbon (Portugal) 2 Genetic Resources Unit,
AN INTRODUCTION TO GEOGRAPHIC INFORMATION SYSTEMS (GIS) Joana Magos Brehm 1, Ali Shehadeh 2 1 Botanical Garden, National Museum of Natural History, University of Lisbon (Portugal) 2 Genetic Resources Unit,
CAUSES FOR CHANGE IN STREAM-CHANNEL MORPHOLOGY
 CAUSES FOR CHANGE IN STREAM-CHANNEL MORPHOLOGY Chad A. Whaley, Department of Earth Sciences, University of South Alabama, MobileAL, 36688. E-MAIL: caw408@jaguar1.usouthal.edu The ultimate goal of this
SWAMP GIS: A spatial decision support system for predicting and treating stormwater runoff. Michael G. Wing 1 * and Derek Godwin
 Journal of Spatial Hydrology Vol. 11, No. 2 Fall 2011 SWAMP GIS: A spatial decision support system for predicting and treating stormwater runoff Michael G. Wing 1 * and Derek Godwin Abstract SWAMP GIS
Lecture 1 Introduction to GIS. Dr. Zhang Spring, 2017
 Lecture 1 Introduction to GIS Dr. Zhang Spring, 2017 Topics of the course Using and making maps Navigating GIS Map design Working with spatial data Geoprocessing Spatial data infrastructure Digitizing
How to Create Stream Networks using DEM and TauDEM
 How to Create Stream Networks using DEM and TauDEM Take note: These procedures do not describe all steps. Knowledge of ArcGIS, DEMs, and TauDEM is required. TauDEM software ( http://hydrology.neng.usu.edu/taudem/
WORKING WITH DMTI DIGITAL ELEVATION MODELS (DEM)
") WORKING WITH DMTI DIGITAL ELEVATION MODELS (DEM) Contents (Ctrl-Click to jump to a specific page) Manipulating the DEM Step 1: Finding the DEM Tiles You Need... 2 Step 2: Importing the DEM Tiles into ArcMap...
WORKING WITH DMTI DIGITAL ELEVATION MODELS (DEM) Contents (Ctrl-Click to jump to a specific page) Manipulating the DEM Step 1: Finding the DEM Tiles You Need... 2 Step 2: Importing the DEM Tiles into ArcMap...