Welcome to NetMap Portal Tutorial
|
|
|
- Jared Marshall
- 5 years ago
- Views:
Transcription

1 Welcome to NetMap Portal Tutorial
2 Potential Applications
3 What Can you do with the Portal? At least 25 things! 1) Locate the best potential fish habitats. 2) Identify biological hotspots. 3) Map floodplain extent and variation. 4) Identify potential landslide prone slopes. 5) Examine landslide risk fish habitat interactions. 6) Detect potential debris flow risk areas. 7) Examine debris flow risk fish habitat interactions. 8) Examine slope stability proximity to built infrastructure. 9) Evaluate forest road erosion and sediment delivery to streams. 10) Identify stream reaches that receive road related sediment. 11) Determine optimal locations for new road drains to eliminate or reduce sedimentation. 12) Evaluate fish habitat amount upstream of road crossings. 13) Identify road landslide/debris flow risk interactions. 14) Detect road floodplain interactions. 15) Evaluate thermal sensitivity of streams.
4 What Can you do with the Portal? At least 25 things! 16) Predict current shade and thermal loading conditions in streams. 17) Identify where to put new shade for greatest effectiveness. 18) Estimate current in-stream wood recruitment potential. 19) Map potential thermal refugia three different types. 20) Map potential climate change to stream reaches. 21) Evaluate climate change fish habitat intersections. 22) Identify fire risk and severity, and mapped to streams. 23) Detect overlaps between fire risk and important resources. 24) Obtain information of channel fluvial conditions. 25) Identify all streams using shaded relief, including ephemeral reaches.

5 There are two ways into the Portal If you have a NetMap analysis in your watershed and or are a subscriber to NetMap tools, use a password to log in Anyone else can access map data by locating your watershed of interest using the Home Page Web Map

6 When using a password, you will be automatically flown into the watershed web map to your general geographic area of interest, saving time For example, we have just landed in the general area of North Chichigof Island in Southeast Alaska, showing four NetMap virtual watershed datasets, built in support of the Hoonah Community Forest Project

7 Clicking on the watershed of interest allows one to load the watershed map data

8 First things first: In addition to fluvial and aquatic habitat attributes, stream channels also contain hillside attributes, like erosion potential, wildfire, road characteristics. Why? Because it offers a channel- or fish-eye view of hillside conditions that are relevant to stream conditions and aquatic habitats. For example, in the Portal s Watershed Analyst module, you can search for and identify locations in the channel network where the highest potential for increased shade overlaps spatially with the most sensitive fish habitats. Or, where the highest erosion potential overlaps with the best quality habitats. How? Each 100 m stream segment in NetMap s Virtual Watershed has its local drainage area on both sides of the channel delineated (up to ridge tops); we refer to these as drainage wings. Any spatial data located within the local drainage areas can be summarized and reported to the stream channel, creating a fish-eye view of terrestrial attributes. Please see next page for an illustrative sketch. Learn more about virtual watersheds.
9 Reporting terrestrial attributes to stream channels (1) First, the digital stream network is created. (2) Next, the stream s local contributing drainage areas on both sides are delineated ( drainage wings ). (3) A stream network contains a network of drainage wings. (4) Then, any terrestrial information of interest in the wings is summarized and reported to channel segments. (5) This enables one of the Portal s key functions: to identify what places & interactions in your watershed matter most.

10 Reporting terrestrial attributes to stream channels example In this example, the terrestrial attribute of landslide potential (left image) is reported to stream channels, providing a fish-eye view of landslide potential. Now, landslide risk can be overlaid with fish habitat quality to identify critical locations where they overlap.

11 NetMap Portal watershed map data are split among three data types Streams Viewer: A list of stream attributes focused on fluvial and aquatic conditions Valley/Hillside: Includes map data on valley floor topography, including floodplains; also erosion attributes, such as landslide potential Road Viewer: Includes available NetMap roads analyses

12 Stream Viewer Map Navigation Panel (part 1) Load a new dataset Map background selector River basin name NetMap s watershed code Change shaded relief opacity Select stream data category All tools have pop up tips!

13 Stream Viewer Map Navigation Panel (part 2) Attribute mapped Select data category Display attribute Slider bar is used to limit display to specified attribute threshold values To increase the speed of map drawing in large watersheds, the steam orders displayed vary with zoom level Dynamic legend legend is based on the visible map and can change with zoom level


14 Use NetMap Portal to search and for prioritization First, select a data category and attribute for display The first slider allows you to select any attribute and search for a threshold value in absolute value or in percentile of the distribution You can use this alone to search for the threshold value and where it overlaps with your chosen display attribute The second slider is used to select a second attribute with another threshold value Locations in the network where one or both thresholds overlap are identified see example, next slide
 Select pink salmon habitat quality threshold (top")
15 Example Application: Question, where does the highest road erosion potential overlap with the best fish habitats? One stream segment met the search criteria Select map attribute to display Select road sediment delivery to streams threshold (top 50% of quality) Select pink salmon habitat quality threshold (top 50%) Indicates if any areas in the watershed met your criteria Specifies search criteria Specifies stream length meeting criteria but only in map view

16 Another way to use the interface is to determine where a potential stressor like forest road sediment delivery interacts with a sensitive fish habitat Map the stressor Then map the habitat Examine how the stressor is distributed according to sensitive fish habitats

17 View in 2D or 3D 3-D display tools


18 In Stream Viewer one can click on a reach and see all reach attribute values
 refer to the Stream Viewer and choose the Erosion data category.")
19 Valley/Hillside Map Navigation Panel This map interface displays several different kinds of data including slope stability, valley floors and floodplains Note for debris flow or flash flood predictions (available in some datasets) refer to the Stream Viewer and choose the Erosion data category. Overlay roads onto landslide risk and floodplains to identify critical locations


20 Valley/Hillside Map Navigation Panel see Landslide Potential and Valley Floor/Floodplains in 3-D Floodplains Landslide Potential


21 Valley/Hillside Map Navigation Panel Landslide Risk Locate road landscape interactions Flood Risk Potentially sensitive road locations

22 Road Viewer Map Navigation Panel This map interface contains predictions for forest road runoff and sediment delivery to stream channels. It also contains predictions about the most optimum locations to place new drains to maximize reductions in sediment delivery. See other ways to compare roads to watershed features

23 Printing a Map Just use a screen shot to capture the image and the legend. For many purposes this should be suitable. People with NetMap analyses in their watersheds and or have a subscription to NetMap tools have access to all map GIS shapefiles and can use those to create custom, high resolution images. If you would like to access the shapefiles for your watershed to create higher resolution or custom maps, please contact us.

24 Upgrade Your Watershed using the Highest Resolution Digital Elevation Model and More Advanced Analyses Note many NetMap datasets across the western US are based on 10 m DEMs and do not contain many of the latest analyses including: use of 1 m LiDAR detailed valley and floodplain mapping riparian processes (shadethermal energy, new shade effectiveness, in-stream wood recruitment and thermal refugia) forest road analyses These upgrades can be made in your watershed for very reasonable cost, please contact us. See the difference between LiDAR and 10 m DEMs in NetMap s watershed attributes here With the latest DEMs and the most advanced analyses using NetMap and NetMap Portal, you become the watershed expert! To learn more about virtual watersheds and NetMap, go
This Powerpoint presentation summarizes the use of NetMap for a Fire Decision Support System. Created on Sept 25, 2015 by Dr. Lee Benda and Kevin
 This Powerpoint presentation summarizes the use of NetMap for a Fire Decision Support System. Created on Sept 25, 2015 by Dr. Lee Benda and Kevin Andras (TerrainWorks). 1 The general approach strategy:
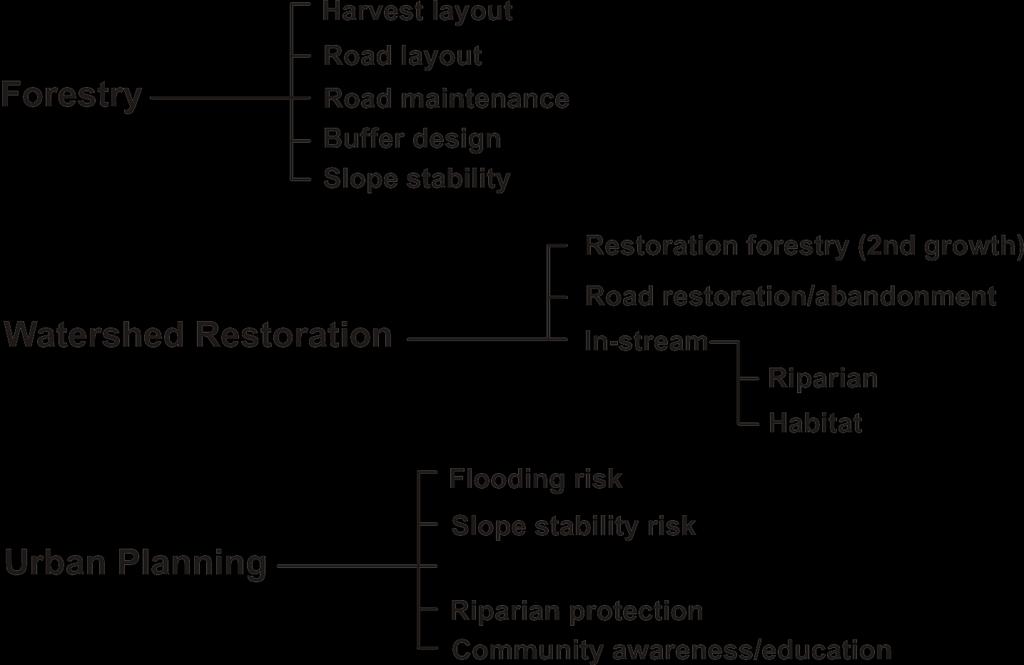
What is a watershed or landscape perspective?
 What is a watershed or landscape perspective? -remove sediment -add sediment -add wood, riparian manipulation -alter (engineer) channel/floodplain morphology -restore/abandon roads You are here What is
Dan Miller + Kelly Burnett, Kelly Christiansen, Sharon Clarke, Lee Benda. GOAL Predict Channel Characteristics in Space and Time
 Broad-Scale Models Dan Miller + Kelly Burnett, Kelly Christiansen, Sharon Clarke, Lee Benda GOAL Predict Channel Characteristics in Space and Time Assess Potential for Fish Use and Productivity Assess
NetMap''' Watershed'Database'and'Analysis'System'
 NetMap' Watershed'Database'and'Analysis'System' Earth'Systems'Ins8tute' Sea:le/Mt.'Shasta/Fort'Collins' NetMap: A collaborative enterprise since 2007 -US National Forests (WA, OR, NCA, AK, ID, MT) -US
Opportunities to Improve Ecological Functions of Floodplains and Reduce Flood Risk along Major Rivers in the Puget Sound Basin
 Opportunities to Improve Ecological Functions of Floodplains and Reduce Flood Risk along Major Rivers in the Puget Sound Basin Christopher Konrad, US Geological Survey Tim Beechie, NOAA Fisheries Managing
Distinct landscape features with important biologic, hydrologic, geomorphic, and biogeochemical functions.
 1 Distinct landscape features with important biologic, hydrologic, geomorphic, and biogeochemical functions. Have distinguishing characteristics that include low slopes, well drained soils, intermittent
Watershed concepts for community environmental planning
 Purpose and Objectives Watershed concepts for community environmental planning Dale Bruns, Wilkes University USDA Rural GIS Consortium May 2007 Provide background on basic concepts in watershed, stream,
GeoWEPP Tutorial Appendix
 GeoWEPP Tutorial Appendix Chris S. Renschler University at Buffalo - The State University of New York Department of Geography, 116 Wilkeson Quad Buffalo, New York 14261, USA Prepared for use at the WEPP/GeoWEPP
What s New in Topographic Information - USGS National Map
 + What s New in Topographic Information - USGS National Map SARGIS Workshop November 14, 2016 Rob Dollison, 703-648-5724 rdollison@usgs.gov + USGS 2 National Geospatial Program The National Geospatial
Vermont Stream Geomorphic Assessment. Appendix E. River Corridor Delineation Process. VT Agency of Natural Resources. April, E0 - April, 2004
 Vermont Stream Geomorphic Assessment Appendix E River Corridor Delineation Process Vermont Agency of Natural Resources - E0 - River Corridor Delineation Process Purpose A stream and river corridor delineation
GIS IN ECOLOGY: ANALYZING RASTER DATA
 GIS IN ECOLOGY: ANALYZING RASTER DATA Contents Introduction... 2 Raster Tools and Functionality... 2 Data Sources... 3 Tasks... 4 Getting Started... 4 Creating Raster Data... 5 Statistics... 8 Surface
Start of Presentation: No notes (Introductory Slide 1) 1) Salmonid Habitat Intrinsic Potential (IP) models are a type of habitat potential
 1) Salmonid Habitat Intrinsic Potential (IP) models are a type of habitat potential") The What and How of Salmonid Habitat Intrinsic Potential Modeling Start of Presentation: No notes (Introductory Slide 1) 1) Salmonid Habitat Intrinsic Potential (IP) models are a type of habitat potential
The What and How of Salmonid Habitat Intrinsic Potential Modeling Start of Presentation: No notes (Introductory Slide 1) 1) Salmonid Habitat Intrinsic Potential (IP) models are a type of habitat potential
MISSOURI LiDAR Stakeholders Meeting
 MISSOURI LiDAR Stakeholders Meeting East-West Gateway June 18, 2010 Tim Haithcoat Missouri GIO Enhanced Elevation Data What s different about it? Business requirements are changing.fast New data collection
Analysis of Road Sediment Accumulation to Monumental Creek using the GRAIP Method
 Analysis of Road Sediment Accumulation to Monumental Creek using the GRAIP Method Introduction (from http://www.neng.usu.edu/cee/faculty/dtarb/graip/#over): The Geomorphologic Road Analysis and Inventory
Create your own map for tidepooling, beach field trips, boating, camping, kayaking, fishing, and exploring the beaches in Southcentral Alaska.
 Create your own map for tidepooling, beach field trips, boating, camping, kayaking, fishing, and exploring the beaches in Southcentral Alaska. Here s an opportunity to download and customize your own free
1) NetMap Overview. 2) Habitat modeling HIP & Beyond. 3) What do you do with habitat models? 4) NetMap a platform for regional analysis & interactions
 NetMap Overview. 2) Habitat modeling HIP & Beyond. 3) What do you do with habitat models? 4) NetMap a platform for regional analysis & interactions") 1) NetMap Overview 2) Habitat modeling HIP & Beyond 3) What do you do with habitat models? 4) NetMap a platform for regional analysis & interactions Overview Multiple analysis tools Creates universal stream/hillslope
1) NetMap Overview 2) Habitat modeling HIP & Beyond 3) What do you do with habitat models? 4) NetMap a platform for regional analysis & interactions Overview Multiple analysis tools Creates universal stream/hillslope
Wetland & Floodplain Functional Assessments and Mapping To Protect and Restore Riverine Systems in Vermont. Mike Kline and Laura Lapierre Vermont DEC
 Wetland & Floodplain Functional Assessments and Mapping To Protect and Restore Riverine Systems in Vermont Mike Kline and Laura Lapierre Vermont DEC NWI+ Hydro-Geomorphic Characterization of Wetlands and
Eagle Creek Post Fire Erosion Hazard Analysis Using the WEPP Model. John Rogers & Lauren McKinney
 Eagle Creek Post Fire Erosion Hazard Analysis Using the WEPP Model John Rogers & Lauren McKinney Columbia River Gorge at Risk: Using LiDAR and GIS-based predictive modeling for regional-scale erosion susceptibility
USING 3D GIS TO ASSESS ENVIRONMENTAL FLOOD HAZARDS IN MINA
 King Fahd University of Petroleum & Minerals College of Environmental Design Geographical Information system USING 3D GIS TO ASSESS ENVIRONMENTAL FLOOD HAZARDS IN MINA Prepared by : Ali AL-Zahrani OUTLINE
The Geodatabase Working with Spatial Analyst. Calculating Elevation and Slope Values for Forested Roads, Streams, and Stands.
 GIS LAB 7 The Geodatabase Working with Spatial Analyst. Calculating Elevation and Slope Values for Forested Roads, Streams, and Stands. This lab will ask you to work with the Spatial Analyst extension.
EFFECTS OF RIPARIAN RETENTION (IN WATERSHEDS) ON ALLUVIAL FANS
 ON ALLUVIAL FANS") EFFECTS OF RIPARIAN RETENTION (IN WATERSHEDS) ON ALLUVIAL FANS TIM GILES GEOMORPHOLOGIST FLNRO EFFECTS OF RIPARIAN RETENTION (IN WATERSHEDS) ON ALLUVIAL FANS Description of alluvial fans Three case studies
EFFECTS OF RIPARIAN RETENTION (IN WATERSHEDS) ON ALLUVIAL FANS TIM GILES GEOMORPHOLOGIST FLNRO EFFECTS OF RIPARIAN RETENTION (IN WATERSHEDS) ON ALLUVIAL FANS Description of alluvial fans Three case studies
A SIMPLE GIS METHOD FOR OBTAINING FLOODED AREAS
 A SIMPLE GIS METHOD FOR OBTAINING FLOODED AREAS ROMAN P., I. 1, OROS C., R. 2 ABSTRACT. A simple GIS method for obtaining flooded areas. This paper presents a method for obtaining flooded areas near to
Using the Stock Hydrology Tools in ArcGIS
 Using the Stock Hydrology Tools in ArcGIS This lab exercise contains a homework assignment, detailed at the bottom, which is due Wednesday, October 6th. Several hydrology tools are part of the basic ArcGIS
Summary Description Municipality of Anchorage. Anchorage Coastal Resource Atlas Project
 Summary Description Municipality of Anchorage Anchorage Coastal Resource Atlas Project By: Thede Tobish, MOA Planner; and Charlie Barnwell, MOA GIS Manager Introduction Local governments often struggle
Archaeological Predictive Modeling within the context of Paleo-river Terraces in the City of Prince George
 Archaeological Predictive Modeling within the context of Paleo-river Terraces in the City of Prince George Background The documented pre-contact archaeological record of the Interior Plateau of B.C. is
ADDRESSING GEOMORPHIC AND HYDRAULIC CONTROLS IN OFF-CHANNEL HABITAT DESIGN
 ADDRESSING GEOMORPHIC AND HYDRAULIC CONTROLS IN OFF-CHANNEL HABITAT DESIGN Conor Shea - Hydrologist U.S. Fish and Wildlife Service Conservation Partnerships Program Arcata, CA Learning Objectives Examine
CE 394K.3 GIS in Water Resources Midterm Quiz Fall There are 5 questions on this exam. Please do all 5. They are of equal credit.
 Name: CE 394K.3 GIS in Water Resources Midterm Quiz Fall 2000 There are 5 questions on this exam. Please do all 5. They are of equal credit. 1. The ArcView Geographic Information System can display different
Introducing Iowa StreamStats Version 4, a Redesign of the USGS Application for Estimating Streamflow Stats
 Introducing Iowa StreamStats Version 4, a Redesign of the USGS Application for Estimating Streamflow Stats Presented at the 2016 Iowa Water Conference Ames, IA March 24, 2016 by David Eash U.S. Geological
AASHTO Extreme Weather Events Symposium Vermont s Road and Rivers - Managing for the Future
 AASHTO Extreme Weather Events Symposium Vermont s Road and Rivers - Managing for the Future May 22, 2013 PLANET EARTH 2 2 MANY MANYYEARS AGO 23,000 years ago there was more than 8,000 feet of glacier over
StreamStats: Delivering Streamflow Information to the Public. By Kernell Ries
 StreamStats: Delivering Streamflow Information to the Public By Kernell Ries U.S. Department of the Interior U.S. Geological Survey MD-DE-DC District 410-238-4317 kries@usgs.gov StreamStats Web Application
Laboratory Exercise #3 The Hydrologic Cycle and Running Water Processes
 Laboratory Exercise #3 The Hydrologic Cycle and Running Water Processes page - 1 Section A - The Hydrologic Cycle Figure 1 illustrates the hydrologic cycle which quantifies how water is cycled throughout
Why Geomorphology for Fish Passage
 Channel Morphology - Stream Crossing Interactions An Overview Michael Love Michael Love & Associates mlove@h2odesigns.com (707) 476-8938 Why Geomorphology for Fish Passage 1. Understand the Scale of the
MODULE 7 LECTURE NOTES 5 DRAINAGE PATTERN AND CATCHMENT AREA DELINEATION
 MODULE 7 LECTURE NOTES 5 DRAINAGE PATTERN AND CATCHMENT AREA DELINEATION 1. Introduction Topography of the river basin plays an important role in hydrologic modelling, by providing information on different
Erosion, Sediment Sources, and Channel Analysis in the Crystal River, Colorado
 Earth Systems Institute Erosion, Sediment Sources, and Channel Analysis in the Crystal River, Colorado Lee Benda and Sandra (Sam) Litschert Mt Shasta, CA/ Fort Collins, CO 10-23-2013 Contents Introduction...
Erosion, Sediment Sources, and Channel Analysis in the Crystal River Watershed, Colorado
 Earth Systems Institute Erosion, Sediment Sources, and Channel Analysis in the Crystal River Watershed, Colorado Lee Benda and Sandra (Sam) Litschert Mt Shasta, CA/ Fort Collins, CO 10-23-2013 Contents
Exercise 2: Working with Vector Data in ArcGIS 9.3
 Exercise 2: Working with Vector Data in ArcGIS 9.3 There are several tools in ArcGIS 9.3 used for GIS operations on vector data. In this exercise we will use: Analysis Tools in ArcToolbox Overlay Analysis
Chapter 6. Fundamentals of GIS-Based Data Analysis for Decision Support. Table 6.1. Spatial Data Transformations by Geospatial Data Types
 Chapter 6 Fundamentals of GIS-Based Data Analysis for Decision Support FROM: Points Lines Polygons Fields Table 6.1. Spatial Data Transformations by Geospatial Data Types TO: Points Lines Polygons Fields
USGS Hydrography Overview. May 9, 2018
 + 1 USGS Hydrography Overview May 9, 2018 + 2 The National Geospatial Program Provides the geospatial baseline of the Nation s topography, natural landscape and built environment through The National Map,
Flooding on the Somerset Levels. ArcGIS Online
 Flooding on the Somerset Levels ArcGIS Online Using this resource This resource has been written to help teachers make use of the ArcGIS Online program. It provides; guidance on how to use the program
An Integrated Habitat Classification and Map of the Lake Erie Basin: Final Report
 An Integrated Habitat Classification and Map of the Lake Erie Basin: Final Report Dr. Lucinda Johnson Natural Resources Research Institute University of Minnesota 5013 Miller Trunk Highway, Duluth, MN
SWAMP GIS: A spatial decision support system for predicting and treating stormwater runoff. Michael G. Wing 1 * and Derek Godwin
 Journal of Spatial Hydrology Vol. 11, No. 2 Fall 2011 SWAMP GIS: A spatial decision support system for predicting and treating stormwater runoff Michael G. Wing 1 * and Derek Godwin Abstract SWAMP GIS
1) make sure folks know what s available in terms of geospatial data and resources that could contribute to their decision support toolkits;
 make sure folks know what s available in terms of geospatial data and resources that could contribute to their decision support toolkits;") Introduction 1 2001 It was born out of the recognition that several of the regions prominent resource management agencies have similar, if not shared, requirements for GIS data. Some of the underlying
Introduction 1 2001 It was born out of the recognition that several of the regions prominent resource management agencies have similar, if not shared, requirements for GIS data. Some of the underlying
Fluvial Systems Lab Environmental Geology Lab Dr. Johnson
 Fluvial Systems Lab Environmental Geology Lab Dr. Johnson *Introductory sections of this lab were adapted from Pidwirny, M. (2006). "Streamflow and Fluvial Processes". Fundamentals of Physical Geography,
Lidar data in water resources applications. Paola Passalacqua CE 374K Lecture, April 5 th, 2012
 Lidar data in water resources applications Paola Passalacqua CE 374K Lecture, April 5 th, 2012 Airborne Lidar Airborne laser altimetry technology (LiDAR, Light Detection And Ranging) provides high-resolution
Studying Topography, Orographic Rainfall, and Ecosystems (STORE)
") Introduction Studying Topography, Orographic Rainfall, and Ecosystems (STORE) Lesson: Using ArcGIS Explorer to Analyze the Connection between Topography, Tectonics, and Rainfall GIS-intensive Lesson This
Introduction Studying Topography, Orographic Rainfall, and Ecosystems (STORE) Lesson: Using ArcGIS Explorer to Analyze the Connection between Topography, Tectonics, and Rainfall GIS-intensive Lesson This
CAUSES FOR CHANGE IN STREAM-CHANNEL MORPHOLOGY
 CAUSES FOR CHANGE IN STREAM-CHANNEL MORPHOLOGY Chad A. Whaley, Department of Earth Sciences, University of South Alabama, MobileAL, 36688. E-MAIL: caw408@jaguar1.usouthal.edu The ultimate goal of this
Exercise 2: Working with Vector Data in ArcGIS 9.3
 Exercise 2: Working with Vector Data in ArcGIS 9.3 There are several tools in ArcGIS 9.3 used for GIS operations on vector data. In this exercise we will use: Analysis Tools in ArcToolbox Overlay Analysis
Exercise 6: Using Burn Severity Data to Model Erosion Risk
 Exercise 6: Using Burn Severity Data to Model Erosion Risk Document Updated: November 2009 Software Versions: ERDAS Imagine 9.3 and ArcGIS 9.3, Microsoft Office 2007 Introduction A common use of burn severity
GIS feature extraction tools in diverse landscapes
 CE 394K.3 GIS in Water Resources GIS feature extraction tools in diverse landscapes Final Project Anna G. Kladzyk M.S. Candidate, Expected 2015 Department of Environmental and Water Resources Engineering
Creating Watersheds and Stream Networks. Steve Kopp
 Creating Watersheds and Stream Networks Steve Kopp Workshop Overview Demo Data Understanding the tools Elevation Data Types DEM : Digital Elevation Model bare Earth DSM : Digital Surface Model Data Structure
How to Model Stream Temperature Using ArcMap
 How to Model Stream Temperature Using ArcMap Take note: Assumption before proceeding: A temperature point file has been attributed with TauDEM variables. There are three processes described in this document.
Geo 327G Semester Project. Landslide Suitability Assessment of Olympic National Park, WA. Fall Shane Lewis
 Geo 327G Semester Project Landslide Suitability Assessment of Olympic National Park, WA Fall 2011 Shane Lewis 1 I. Problem Landslides cause millions of dollars of damage nationally every year, and are
Floodplain modeling. Ovidius University of Constanta (P4) Romania & Technological Educational Institute of Serres, Greece
 Romania & Technological Educational Institute of Serres, Greece") Floodplain modeling Ovidius University of Constanta (P4) Romania & Technological Educational Institute of Serres, Greece Scientific Staff: Dr Carmen Maftei, Professor, Civil Engineering Dept. Dr Konstantinos
Floodplain modeling Ovidius University of Constanta (P4) Romania & Technological Educational Institute of Serres, Greece Scientific Staff: Dr Carmen Maftei, Professor, Civil Engineering Dept. Dr Konstantinos
GIS IN ECOLOGY: ANALYZING RASTER DATA
 GIS IN ECOLOGY: ANALYZING RASTER DATA Contents Introduction... 2 Tools and Functionality for Raster Data... 2 Data Sources... 3 Tasks... 4 Getting Started... 4 Creating Raster Data... 5 Summary Statistics...
Great Lakes Online Watershed Interface W. Elliot, Research Engineer USDA Forest Service Rocky Mountain Research Station, Moscow, ID March, 2016
 Great Lakes Online Watershed Interface W. Elliot, Research Engineer USDA Forest Service Rocky Mountain Research Station, Moscow, ID March, 2016 Guidelines for using the Web WEPP Watershed Tool to Support
They include earthquakes, volcanic eruptions, floods, landslides, and other processes and occurrences. They are included in the broader concept of.
 They include earthquakes, volcanic eruptions, floods, landslides, and other processes and occurrences. They are included in the broader concept of. In general, natural processes are labeled hazardous only
Watershed Modeling Orange County Hydrology Using GIS Data
 v. 10.0 WMS 10.0 Tutorial Watershed Modeling Orange County Hydrology Using GIS Data Learn how to delineate sub-basins and compute soil losses for Orange County (California) hydrologic modeling Objectives
Using ArcGIS for Hydrology and Watershed Analysis:
 Using ArcGIS 10.2.2 for Hydrology and Watershed Analysis: A guide for running hydrologic analysis using elevation and a suite of ArcGIS tools Anna Nakae Feb. 10, 2015 Introduction Hydrology and watershed
Topographic Maps and Landforms Geology Lab
 Topographic Maps and Landforms Geology Lab Ray Rector: Instructor Today s Lab Activities 1) Discussion of Last Week s Lab 2) Lecture on Topo Maps and Elevation Contours 3) Construct Topographic Maps and
Impact of DEM Resolution on Topographic Indices and Hydrological Modelling Results
 Impact of DEM Resolution on Topographic Indices and Hydrological Modelling Results J. Vaze 1, 2 and J. Teng 1, 2 1 Department of Water and Energy, NSW, Australia 2 ewater Cooperative Research Centre, Australia
Workshops funded by the Minnesota Environment and Natural Resources Trust Fund
 Workshops funded by the Minnesota Environment and Natural Resources Trust Fund Conservation Applications of LiDAR Data Workshops funded by: Minnesota Environment and Natural Resources Trust Fund Presented
Lower South Fork McKenzie River Floodplain Enhancement Project
 Lower South Fork McKenzie River Floodplain Enhancement Project McKenzie River Ranger District Willamette National Forest Project Location The project is located in the South Fork McKenzie River Watershed,
Digital Elevation Models. Using elevation data in raster format in a GIS
 Digital Elevation Models Using elevation data in raster format in a GIS What is a Digital Elevation Model (DEM)? Digital representation of topography Model based on scale of original data Commonly a raster
GRAPEVINE LAKE MODELING & WATERSHED CHARACTERISTICS
 GRAPEVINE LAKE MODELING & WATERSHED CHARACTERISTICS Photo Credit: Lake Grapevine Boat Ramps Nash Mock GIS in Water Resources Fall 2016 Table of Contents Figures and Tables... 2 Introduction... 3 Objectives...
Introducing IMS. v) Select the Zoom to Full Extent tool. Did you return to the original view?
 Select the Zoom to Full Extent tool. Did you return to the original view?") Ocean/ENVIR 260, Winter 2006 Lab 1, Get to Know the Puget Sound Watershed Name Introducing IMS 1) Open your web browser and navigate to http://128.208.23.127/website/lab1. (This link can be found on the
Ocean/ENVIR 260, Winter 2006 Lab 1, Get to Know the Puget Sound Watershed Name Introducing IMS 1) Open your web browser and navigate to http://128.208.23.127/website/lab1. (This link can be found on the
In this exercise we will learn how to use the analysis tools in ArcGIS with vector and raster data to further examine potential building sites.
 GIS Level 2 In the Introduction to GIS workshop we filtered data and visually examined it to determine where to potentially build a new mixed use facility. In order to get a low interest loan, the building
Welcome to NR502 GIS Applications in Natural Resources. You can take this course for 1 or 2 credits. There is also an option for 3 credits.
 Welcome to NR502 GIS Applications in Natural Resources. You can take this course for 1 or 2 credits. There is also an option for 3 credits. The 1st credit consists of a series of readings, demonstration,
Using Earthscope and B4 LiDAR data to analyze Southern California s active faults
 Using Earthscope and B4 LiDAR data to analyze Southern California s active faults Exercise 8: Simple landscape morphometry and stream network delineation Introduction This exercise covers sample activities
Remote Sensing and GIS Applications for Hilly Watersheds SUBASHISA DUTTA DEPARTMENT OF CIVIL ENGINEERING IIT GUWAHATI
 Remote Sensing and GIS Applications for Hilly Watersheds SUBASHISA DUTTA DEPARTMENT OF CIVIL ENGINEERING IIT GUWAHATI Deciding Alternative Land Use Options in a Watershed Using GIS Source: Anita Prakash
Assessing Michigan s Biological diversity. Michigan Natural Features Inventory MSU Extension
 Assessing Michigan s Biological diversity John Paskus,, Amy Derosier,, Edward Schools, and Helen Enander Michigan Natural Features Inventory MSU Extension Goal Provide scientifically based information
Give 4 advantages of using ICT in the collection of data. Give. Give 4 disadvantages in the use of ICT in the collection of data
 Give 4 advantages of using ICT in the collection of data can use a handheld GPS to get accurate location information which can be used to show data linked to specific locations within a GIS can collect
A GIS-based Approach to Watershed Analysis in Texas Author: Allison Guettner
 Texas A&M University Zachry Department of Civil Engineering CVEN 658 Civil Engineering Applications of GIS Instructor: Dr. Francisco Olivera A GIS-based Approach to Watershed Analysis in Texas Author:
THE DIGITAL TERRAIN MAP LIBRARY: AN EXPLORATIONIST S RESOURCE
 THE DIGITAL TERRAIN MAP LIBRARY: AN EXPLORATIONIST S RESOURCE By I.C.L. Webster, P.J. Desjardins and W.E. Kilby KEYWORDS: digital terrain maps, digital terrain stability maps, surficial geology, GIS, raster
Grant 0299-NEP: Water Resources Project Preparatory Facility
 Document Produced under Grant Project Number: 45206 May 2016 Grant 0299-NEP: Water Resources Project Preparatory Facility Final Report Volume 3 East Rapti (1 of 9) Prepared by Pvt. Ltd. For Ministry of
4. GIS Implementation of the TxDOT Hydrology Extensions
 4. GIS Implementation of the TxDOT Hydrology Extensions A Geographic Information System (GIS) is a computer-assisted system for the capture, storage, retrieval, analysis and display of spatial data. It
SIE 509 Principles of GIS Exercise 5 An Introduction to Spatial Analysis
 SIE 509 Principles of GIS Exercise 5 An Introduction to Spatial Analysis Due: Oct. 31, 2017 Total Points: 50 Introduction: The Governor of Maine is asking communities to look at regionalization for major
Determining the Location of the Simav Fault
 Lindsey German May 3, 2012 Determining the Location of the Simav Fault 1. Introduction and Problem Formulation: The issue I will be focusing on involves interpreting the location of the Simav fault in
Fluvial Erosion Impacts on Infrastructure Along Indiana Rivers and Streams
 Fluvial Erosion Impacts on Infrastructure Along Indiana Rivers and Streams Siavash Beik, Robert Barr, Brian Meunier 2017 Purdue Road School March 6-9, 2017 In June 2008, flooding damaged or destroyed
The last three sections of the main body of this report consist of:
 Threatened and Endangered Species Geological Hazards Floodplains Cultural Resources Hazardous Materials A Cost Analysis section that provides comparative conceptual-level costs follows the Environmental
PENNSYLVANIA DEPARTMENT OF TRANSPORTATION ENGINEERING DISTRICT 3-0
 PENNSYLVANIA DEPARTMENT OF TRANSPORTATION ENGINEERING DISTRICT 3-0 LYCOMING COUNTY S.R.15, SECTION C41 FINAL HYDROLOGIC AND HYDRAULIC REPORT STEAM VALLEY RUN STREAM RELOCATION DATE: June, 2006 REVISED:
Automatic Watershed Delineation using ArcSWAT/Arc GIS
 Automatic Watershed Delineation using ArcSWAT/Arc GIS By: - Endager G. and Yalelet.F 1. Watershed Delineation This tool allows the user to delineate sub watersheds based on an automatic procedure using
Transactions on Information and Communications Technologies vol 18, 1998 WIT Press, ISSN
 STREAM, spatial tools for river basins, environment and analysis of management options Menno Schepel Resource Analysis, Zuiderstraat 110, 2611 SJDelft, the Netherlands; e-mail: menno.schepel@resource.nl
How Do Human Impacts and Geomorphological Responses Vary with Spatial Scale in the Streams and Rivers of the Illinois Basin?
 How Do Human Impacts and Geomorphological Responses Vary with Spatial Scale in the Streams and Rivers of the Illinois Basin? Bruce Rhoads Department of Geography University of Illinois at Urbana-Champaign
A Help Guide for Using gssurgo to Find Potential Wetland Soil Landscapes
 A Help Guide for Using gssurgo to Find Potential Wetland Soil Landscapes Wetland Mapping Consortium Webinar September 17, 2014 Dr. John M. Galbraith Crop & Soil Environmental Sciences Virginia Tech Wetland
How to Create Stream Networks using DEM and TauDEM
 How to Create Stream Networks using DEM and TauDEM Take note: These procedures do not describe all steps. Knowledge of ArcGIS, DEMs, and TauDEM is required. TauDEM software ( http://hydrology.neng.usu.edu/taudem/
NR402 GIS Applications in Natural Resources
 NR402 GIS Applications in Natural Resources Lesson 1 Introduction to GIS Eva Strand, University of Idaho Map of the Pacific Northwest from http://www.or.blm.gov/gis/ Welcome to NR402 GIS Applications in
Development of Riparian Maps for Sonoma County Long Term Riparian Corridor Conservation. Mark Tukman & Dylan Loudon Tukman Geospatial
 L A N D F O R Development of Riparian Maps for Sonoma County Long Term Riparian Corridor Conservation Mark Tukman & Dylan Loudon Tukman Geospatial L I F E Mark Background on functional riparian mapping
Stream Simulation: A Simple Example
 Stream Simulation: A Simple Example North Thompson Creek, CO Paul T. Anderson U.S.D.A. Forest Service Here s How We Started May 2011 2-1 USDA-Forest Service Here s How We Finished Forest Service Aquatic
Outcrop suitability analysis of blueschists within the Dry Lakes region of the Condrey Mountain Window, North-central Klamaths, Northern California
 Outcrop suitability analysis of blueschists within the Dry Lakes region of the Condrey Mountain Window, North-central Klamaths, Northern California (1) Introduction: This project proposes to assess the
Spatial units (Levels 0 and 1)
") Spatial units (Levels 0 and 1) Project: Advancing the SEEA Experimental Ecosystem Accounting Overview: Spatial units 1. Learning objectives 2. Level 1: Presentation & group exercise Spatial units (10m
Spatial units (Levels 0 and 1) Project: Advancing the SEEA Experimental Ecosystem Accounting Overview: Spatial units 1. Learning objectives 2. Level 1: Presentation & group exercise Spatial units (10m
06/04/2015. Overview: Spatial units. Advancing the SEEA Experimental Ecosystem Accounting Spatial units (Level 1)
") Advancing the SEEA Experimental Ecosystem Accounting Spatial units (Level 1) Advancing the SEEA-EEA Project Overview: Spatial units 1. Learning objectives 2. Level 1: Presentation & group exercise Spatial
Advancing the SEEA Experimental Ecosystem Accounting Spatial units (Level 1) Advancing the SEEA-EEA Project Overview: Spatial units 1. Learning objectives 2. Level 1: Presentation & group exercise Spatial
Flood Hazard Zone Modeling for Regulation Development
 Flood Hazard Zone Modeling for Regulation Development By Greg Lang and Jared Erickson Pierce County GIS June 2003 Abstract The desire to blend current digital information with government permitting procedures,
Hydrology and Watershed Analysis
 Hydrology and Watershed Analysis Manual By: Elyse Maurer Reference Map Figure 1. This map provides context to the area of Washington State that is being focused on. The red outline indicates the boundary
Exercise 4. Watershed and Stream Network Delineation
 Exercise 4. Watershed and Stream Network Delineation GIS in Water Resources, Fall 2015 Prepared by David G Tarboton and David R. Maidment Purpose The purpose of this exercise is to illustrate watershed
ENGRG Introduction to GIS
 ENGRG 59910 Introduction to GIS Michael Piasecki March 17, 2014 Lecture 08: Terrain Analysis Outline: Terrain Analysis Earth Surface Representation Contour TIN Mass Points Digital Elevation Models Slope
NEW YORK STATE WATER RESOURCES INSTITUTE Department of Biological and Environmental Engineering
 NEW YORK STATE WATER RESOURCES INSTITUTE Department of Biological and Environmental Engineering 230 Riley-Robb Hall, Cornell University Tel: (607) 254-7163 Ithaca, NY 14853-5701 Fax: (607) 255-4080 http://wri.cals.cornell.edu
GIS Geographic Information System
 GIS Geographic Information System Andrea Petroselli Tuscia University, Italy petro@unitus.it SUMMARY Part 1: Part 2: Part 3: Part 4: What is a GIS? Why do we need a GIS? Which are the possibilities of
Geo-spatial Analysis for Prediction of River Floods
 Geo-spatial Analysis for Prediction of River Floods Abstract. Due to the serious climate change, severe weather conditions constantly change the environment s phenomena. Floods turned out to be one of
SPATIAL AND TEMPORAL ANALYSIS OF THE DEGRADATION OF NATURAL RESOURCES IN RIVER LIKODRA WATERSHED
 Soil Erosion Modelling JRC Ispra 20-21-22 March 2017 University of Belgrade, Faculty of Forestry Department for Ecological Engineering in Protection of Soil and Water Resources SPATIAL AND TEMPORAL ANALYSIS
Lidar data in water resources applications
 Lidar data in water resources applications Paola Passalacqua CE 394K 3 Guest Lecture, November 15 th, 2012 Airborne Lidar Airborne laser altimetry technology (lidar, Light Detection And Ranging) provides