Key Processes
|
|
|
- Gregory Lee
- 6 years ago
- Views:
Transcription
1 Data Manipulation and Extraction
2 Key Processes
3 Key Processes Re-Projecting Data Selecting by Attributes Exporting Data Hillshade Reclassification Conversion of Raster to Vector
4 Re-Projecting Data Purpose To convert a particular piece of data from one coordinate system to another Very basic and essential step in any analysis using GIS If this step is not taken any analysis preformed will be inaccurate


5 Projecting Data Example
6 Selecting By Attributes Purpose To extract desired data for analysis
7 Selecting By Attributes How the process works All that is really being done is manipulating data sets in 3 dimensions In 2 dimensions all that exist is (x, y) describing a particular piece of data In ArcGIS one has to think in three dimensions because even though it s a 2 dimensional map the user also had elevation data (the Z-value) So the result is (x,y,z)
8 Selecting By Attributes Example Future Module Work... You are trying to find the total affected population The parameters Populations residing at less than zero feet (Reclassification) Total Population (selection from a Shape File)
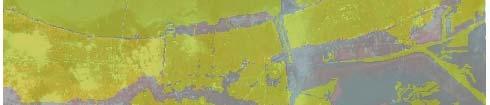
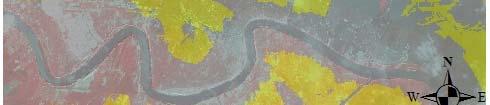
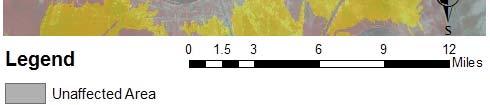
9 Selecting By Attributes (Reclassification) New Orleans Affected Area Y Y Z X
10 Selecting By Attributes When selecting by attributes in an Attribute table the data typically only has (x, y) values associated with them unless elevation data is used as a parameter

 +")

11 Example Selecting By Attributes Total population affected by the Hurricane with flood waters at zero meters (Shape File) + 783,845 People Affected 298,353 People Unaffected 1,082,198 Total Population
12 Exporting Data Purpose To make a temporary layer permanent in a current map If this process is not done then the file may be lost when ArcMap is closed and re-opened
13 Hillshade Purpose Even a DEM that has been converted to a raster is still hard to interpret. By performing a hillshade on a converted DEM, the elevation changes are more visually apparent. In short, this process is mostly for aesthetics of the data.


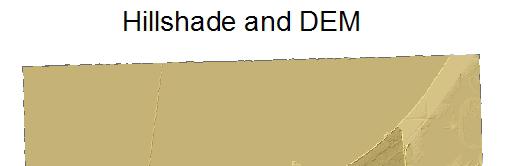
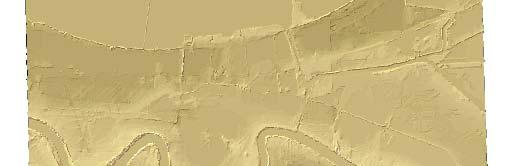
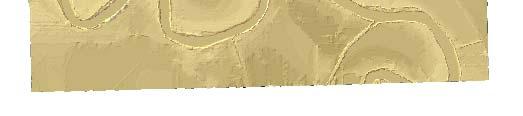
14 Hillshade Notice in the hillshade that the topographic relief is easily evident
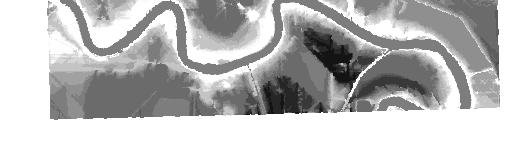
15 Reclassification Purpose Reclassification of a raster, in general, is used to extract specific data (i. e. specific elevation data)


16 Reclassification Example Everything below 0 Meters is under water
17 Conversion of Raster to Vector Purpose Converting a Raster to a Vector (Shape File) enables the user to intersect other data with the raster data (i. e. Census Data)


18 Conversion of Raster to Vector Example Intersection of the affected area (New Orleans) and the pertinent Census Data
19 Delineating the Project Area
20 The Problem Determine the affected area that has occurred as a result of Hurricane Katrina
21 How to Solve the problem 1. 1 Frame the problem 2. Identify data needs 3. Identify decision i support tools 4. Locate and assemble data 5. Process and analyze data 6. 6 Generate information and report
22 Frame The Problem What determines the location of the problem? Water level associated with the hurricane s land fall What information is needed? The current water level in the area of New Orleans, LA
23 Identify Data Needs Elevation data is needed to delineate the affected area More specifically DEM Data
24 Identify Decision Support Tools Possible support tools for this particular situation include: Up to date field data ( (i. e. water level) An outline providing the methodology of how the data will be processed
25 Identify Decision Support Tools Outline of the mechanical process Each Parameter will be set by the user based on the information at hand
26 Locate and Assemble Data DEM data can be found at:
27 Process and Analyze Data Part I: Acquisition, importing and processing DEMs Part t II: Creating Hill shades Part III: Reclassification of the Data

28 Generate Information and Report
Creating Watersheds from a DEM
 Creating Watersheds from a DEM These instructions enable you to create watersheds of specified area using a good quality Digital Elevation Model (DEM) in ArcGIS 8.1. The modeling is performed in ArcMap
The Looming Threat of Rising Sea Levels to the Florida Keys
 The Looming Threat of Rising Sea Levels to the Florida Keys 1. Introduction Sea levels are rising, and possibly faster than we thought before. In a recent report in 2017 by the National Oceanic and Atmospheric
Intro to GIS In Review
 Intro to GIS In Review GIS Analysis Winter 2016 GIS A quarter in review Geographic data types Acquiring GIS data Projections / Coordinate systems Working with attribute tables Data classification Map design
GeoWEPP Tutorial Appendix
 GeoWEPP Tutorial Appendix Chris S. Renschler University at Buffalo - The State University of New York Department of Geography, 116 Wilkeson Quad Buffalo, New York 14261, USA Prepared for use at the WEPP/GeoWEPP
Lab 1: Landuse and Hydrology, learning ArcGIS II. MANIPULATING DATA
 Lab 1: Landuse and Hydrology, learning ArcGIS II. MANIPULATING DATA As you experienced in the first lab session when you created a hillshade, high resolution data can be unwieldy if you are trying to perform
Working with Digital Elevation Models in ArcGIS 8.3
 Working with Digital Elevation Models in ArcGIS 8.3 The homework that you need to turn in is found at the end of this document. This lab continues your introduction to using the Spatial Analyst Extension
The Geodatabase Working with Spatial Analyst. Calculating Elevation and Slope Values for Forested Roads, Streams, and Stands.
 GIS LAB 7 The Geodatabase Working with Spatial Analyst. Calculating Elevation and Slope Values for Forested Roads, Streams, and Stands. This lab will ask you to work with the Spatial Analyst extension.
Data Structures & Database Queries in GIS
 Data Structures & Database Queries in GIS Objective In this lab we will show you how to use ArcGIS for analysis of digital elevation models (DEM s), in relationship to Rocky Mountain bighorn sheep (Ovis
Volcanic Hazards of Mt Shasta
 Volcanic Hazards of Mt Shasta Introduction Mt Shasta is a volcano in the northern part of California. Although it has been recently inactive for over 10,000 years. However, its eruption would cause damage
Calhoun County, Texas Under 5 Meter Sea Level Rise
 Kyle Kacal GEO 327G Calhoun County, Texas Under 5 Meter Sea Level Rise PROBLEM AND PURPOSE: Sea level rise is threat to all coastal areas. Although natural sea level rise happens at a very slow rate, hurricanes
Determine the flooded area based on elevation information and the current water level
 Identifying Data Needs Identifying Data Needs Purpose Before looking for data, the methodology needs to be analyzed to establish what data is needed The most important question that needs to be answered
Spatial Analyst: Multiple Criteria Evaluation Material adapted from FOR 4114 developed by Forestry Associate Professor Steve Prisley
 Spatial Analyst: Multiple Criteria Evaluation Material adapted from FOR 4114 developed by Forestry Associate Professor Steve Prisley Section 1: Data In this exercise we will be working with several types
Welcome to NR502 GIS Applications in Natural Resources. You can take this course for 1 or 2 credits. There is also an option for 3 credits.
 Welcome to NR502 GIS Applications in Natural Resources. You can take this course for 1 or 2 credits. There is also an option for 3 credits. The 1st credit consists of a series of readings, demonstration,
Geo 327G Semester Project. Landslide Suitability Assessment of Olympic National Park, WA. Fall Shane Lewis
 Geo 327G Semester Project Landslide Suitability Assessment of Olympic National Park, WA Fall 2011 Shane Lewis 1 I. Problem Landslides cause millions of dollars of damage nationally every year, and are
Determining the Location of the Simav Fault
 Lindsey German May 3, 2012 Determining the Location of the Simav Fault 1. Introduction and Problem Formulation: The issue I will be focusing on involves interpreting the location of the Simav fault in
Advanced Image Analysis in Disaster Response
 Advanced Image Analysis in Disaster Response Creating Geographic Knowledge Thomas Harris ITT The information contained in this document pertains to software products and services that are subject to the
GIS Semester Project Working With Water Well Data in Irion County, Texas
 GIS Semester Project Working With Water Well Data in Irion County, Texas Grant Hawkins Question for the Project Upon picking a random point in Irion county, Texas, to what depth would I have to drill a
Hydrologic Engineering Applications of Geographic Information Systems
 Hydrologic Engineering Applications of Geographic Information Systems Davis, California Objectives: The participant will acquire practical knowledge and skills in the application of GIS technologies for
Watershed Delineation
 Watershed Delineation Jessica L. Watkins, University of Georgia 2 April 2009 Updated by KC Love February 25, 2011 PURPOSE For this project, I delineated watersheds for the Coweeta synoptic sampling area
Delineation of Watersheds
 Delineation of Watersheds Adirondack Park, New York by Introduction Problem Watershed boundaries are increasingly being used in land and water management, separating the direction of water flow such that
Acknowledgments xiii Preface xv. GIS Tutorial 1 Introducing GIS and health applications 1. What is GIS? 2
 Acknowledgments xiii Preface xv GIS Tutorial 1 Introducing GIS and health applications 1 What is GIS? 2 Spatial data 2 Digital map infrastructure 4 Unique capabilities of GIS 5 Installing ArcView and the
FLOOD HAZARD MAPPING OF DHAKA-NARAYANGANJ-DEMRA (DND) PROJECT USING GEO-INFORMATICS TOOLS
 PROJECT USING GEO-INFORMATICS TOOLS") FLOOD HAZARD MAPPING OF DHAKA-NARAYANGANJ-DEMRA (DND) PROJECT USING GEO-INFORMATICS TOOLS Md. Aminul Islam MEE07178 Supervisor: Prof. Kuniyoshi TAKEUCHI ABSTRACT Dhaka-Narayanganj-Demra (DND) Project is
FLOOD HAZARD MAPPING OF DHAKA-NARAYANGANJ-DEMRA (DND) PROJECT USING GEO-INFORMATICS TOOLS Md. Aminul Islam MEE07178 Supervisor: Prof. Kuniyoshi TAKEUCHI ABSTRACT Dhaka-Narayanganj-Demra (DND) Project is
Alaska, USA. Sam Robbins
 Using ArcGIS to determine erosion susceptibility within Denali National Park, Alaska, USA Sam Robbins Introduction Denali National Park is six million acres of wild land with only one road and one road
Visualization of Commuter Flow Using CTPP Data and GIS
 Visualization of Commuter Flow Using CTPP Data and GIS Research & Analysis Department Southern California Association of Governments 2015 ESRI User Conference l July 23, 2015 l San Diego, CA Jung Seo,
Semester Project Final Report. Logan River Flood Plain Analysis Using ArcGIS, HEC-GeoRAS, and HEC-RAS
 Semester Project Final Report Logan River Flood Plain Analysis Using ArcGIS, HEC-GeoRAS, and HEC-RAS Kedric Curtis, Josh Hogge, Jordan Jarrett, Jared Justensen May 6, 2016 CEE 6190 GIS for Civil Engineers
Creating Watersheds from a DEM in ArcGIS 9.x
 Creating Watersheds from a DEM in ArcGIS 9.x These instructions enable you to create watersheds (a.k.a. catchments or basins) using a good quality Digital Elevation Model (DEM) in ArcGIS 9.1. The modeling
Using the Stock Hydrology Tools in ArcGIS
 Using the Stock Hydrology Tools in ArcGIS This lab exercise contains a homework assignment, detailed at the bottom, which is due Wednesday, October 6th. Several hydrology tools are part of the basic ArcGIS
Geo-spatial Analysis for Prediction of River Floods
 Geo-spatial Analysis for Prediction of River Floods Abstract. Due to the serious climate change, severe weather conditions constantly change the environment s phenomena. Floods turned out to be one of
Classification of Erosion Susceptibility
 GEO327G: GIS & GPS Applications in Earth Sciences Classification of Erosion Susceptibility Denali National Park, Alaska Zehao Xue 12 3 2015 2 TABLE OF CONTENTS 1 Abstract... 3 2 Introduction... 3 2.1 Universal
Week 8 Cookbook: Review and Reflection
 : Review and Reflection Week 8 Overview 8.1) Review and Reflection 8.2) Making Intelligent Maps: The map sheet as a blank canvas 8.3) Making Intelligent Maps: Base layers and analysis layers 8.4) ArcGIS
IMPERIAL COUNTY PLANNING AND DEVELOPMENT
 IMPERIAL COUNTY PLANNING AND DEVELOPMENT GEODATABASE USER MANUAL FOR COUNTY BUSINESS DEVELOPMENT GIS June 2010 Prepared for: Prepared by: County of Imperial Planning and Development 801 Main Street El
GIS Geographic Information System
 GIS Geographic Information System Andrea Petroselli Tuscia University, Italy petro@unitus.it SUMMARY Part 1: Part 2: Part 3: Part 4: What is a GIS? Why do we need a GIS? Which are the possibilities of
Hydrologic and Hydraulic Analyses Using ArcGIS
 Hydrologic and Hydraulic Analyses Using ArcGIS Two day training class Overview ArcGIS and Arc Hydro provide strong foundation for support of hydrologic and hydraulic (H&H) analyses. This two-day course
Management and Use of LiDAR-derived Information. Elizabeth Cook, GIS Specialist
 Management and Use of LiDAR-derived Information Elizabeth Cook, GIS Specialist Advanced LiDAR Workshop March 15, 2012 50-100 gb/county Now What? Project Deliverables LAS mass point files, classification
Abstract: Contents. Literature review. 2 Methodology.. 2 Applications, results and discussion.. 2 Conclusions 12. Introduction
 Abstract: Landfill is one of the primary methods for municipal solid waste disposal. In order to reduce the environmental damage and to protect the public health and welfare, choosing the site for landfill
GIS IN ECOLOGY: ANALYZING RASTER DATA
 GIS IN ECOLOGY: ANALYZING RASTER DATA Contents Introduction... 2 Tools and Functionality for Raster Data... 2 Data Sources... 3 Tasks... 4 Getting Started... 4 Creating Raster Data... 5 Summary Statistics...
Fire Susceptibility Analysis Carson National Forest New Mexico. Can a geographic information system (GIS) be used to analyze the susceptibility of
 be used to analyze the susceptibility of") 1 David Werth Fire Susceptibility Analysis Carson National Forest New Mexico Can a geographic information system (GIS) be used to analyze the susceptibility of Carson National Forest, New Mexico to forest
1 David Werth Fire Susceptibility Analysis Carson National Forest New Mexico Can a geographic information system (GIS) be used to analyze the susceptibility of Carson National Forest, New Mexico to forest
Outline. ArcGIS? ArcMap? I Understanding ArcMap. ArcMap GIS & GWR GEOGRAPHICALLY WEIGHTED REGRESSION. (Brief) Overview of ArcMap
 Overview of ArcMap") GEOGRAPHICALLY WEIGHTED REGRESSION Outline GWR 3.0 Software for GWR (Brief) Overview of ArcMap Displaying GWR results in ArcMap stewart.fotheringham@nuim.ie http://ncg.nuim.ie ncg.nuim.ie/gwr/ ArcGIS?
GEOGRAPHICALLY WEIGHTED REGRESSION Outline GWR 3.0 Software for GWR (Brief) Overview of ArcMap Displaying GWR results in ArcMap stewart.fotheringham@nuim.ie http://ncg.nuim.ie ncg.nuim.ie/gwr/ ArcGIS?
Popular Mechanics, 1954
 Introduction to GIS Popular Mechanics, 1954 1986 $2,599 1 MB of RAM 2017, $750, 128 GB memory, 2 GB of RAM Computing power has increased exponentially over the past 30 years, Allowing the existence of
Tutorial 8 Raster Data Analysis
 Objectives Tutorial 8 Raster Data Analysis This tutorial is designed to introduce you to a basic set of raster-based analyses including: 1. Displaying Digital Elevation Model (DEM) 2. Slope calculations
Exercise 6: Working with Raster Data in ArcGIS 9.3
 Exercise 6: Working with Raster Data in ArcGIS 9.3 Why Spatial Analyst? Grid query Grid algebra Grid statistics Summary by zone Proximity mapping Reclassification Histograms Surface analysis Slope, aspect,
Week 7 Last week: This week s topics. GIS and Forest Engineering Applications. FE 257. GIS and Forest Engineering Applications.
 FE 257. GIS and Forest Engineering Applications Week 7 Week 7 Last week: Spatial Projections Questions? Next week- read: Chapter 10: Updating GIS Databases Chapter 12: Synthesis of Techniques Applied to
Using ArcGIS for Hydrology and Watershed Analysis:
 Using ArcGIS 10.2.2 for Hydrology and Watershed Analysis: A guide for running hydrologic analysis using elevation and a suite of ArcGIS tools Anna Nakae Feb. 10, 2015 Introduction Hydrology and watershed
Copyright The McGraw-Hill Companies, Inc. Permission required for reproduction or display.
 CHAPTER 5 GIS DATA Acquisition 5.1 Existing GIS Data 5.1.1 Federal Geographic Data Committee 5.1.2 Geospatial One-Stop Box 5.1 Clearinghouse and Portal 5.1.3 U.S. Geological Survey 5.1.4 U.S. Census Bureau
How to Create Stream Networks using DEM and TauDEM
 How to Create Stream Networks using DEM and TauDEM Take note: These procedures do not describe all steps. Knowledge of ArcGIS, DEMs, and TauDEM is required. TauDEM software ( http://hydrology.neng.usu.edu/taudem/
GIS IN ECOLOGY: ANALYZING RASTER DATA
 GIS IN ECOLOGY: ANALYZING RASTER DATA Contents Introduction... 2 Raster Tools and Functionality... 2 Data Sources... 3 Tasks... 4 Getting Started... 4 Creating Raster Data... 5 Statistics... 8 Surface
Displaying Latitude & Longitude Data (XY Data) in ArcGIS
 in ArcGIS") Displaying Latitude & Longitude Data (XY Data) in ArcGIS Created by Barbara Parmenter and updated on 2/15/2018 If you have a table of data that has longitude and latitude, or XY coordinates, you can view
Displaying Latitude & Longitude Data (XY Data) in ArcGIS Created by Barbara Parmenter and updated on 2/15/2018 If you have a table of data that has longitude and latitude, or XY coordinates, you can view
Sea Level Scare in South Carolina. by William Witmer GEO 327G 5 December 2016
 Sea Level Scare in South Carolina by William Witmer GEO 327G 5 December 2016 Problem Hilton Head Island in South Carolina attracts 2.5 million tourists every year. This popular locale features endangered
Praveen Subramani December 7, 2008 Athena: praveens Final Project: Placing a New Upscale Restaurant in Suffolk County, MA
 11.188 Final Project: Placing a New Upscale Restaurant in Suffolk County, MA Abstract According to an August 2008 New York Times article, over 60% of new restaurants, delis, and food shops close within
Conservation Applications of LiDAR Data
 Program: Funding: Conservation Applications of LiDAR Data http://tsp.umn.edu/lidar Environment and Natural Resources Trust Fund Module: Instructor: Exercise: Hydrologic Applications Sean Vaughn, DNR GIS
ArcGIS Tools for Professional Cartography
 ArcGIS Tools for Professional Cartography By Makram Murad-al-shaikh M.S. Cartography Senior instructor ESRI Educational Services ICC - A Coruña - Spain, 9-16 July, 2005 Overview Overview of the ArcGIS
Basics of GIS. by Basudeb Bhatta. Computer Aided Design Centre Department of Computer Science and Engineering Jadavpur University
 Basics of GIS by Basudeb Bhatta Computer Aided Design Centre Department of Computer Science and Engineering Jadavpur University e-governance Training Programme Conducted by National Institute of Electronics
THE 3D SIMULATION INFORMATION SYSTEM FOR ASSESSING THE FLOODING LOST IN KEELUNG RIVER BASIN
 THE 3D SIMULATION INFORMATION SYSTEM FOR ASSESSING THE FLOODING LOST IN KEELUNG RIVER BASIN Kuo-Chung Wen *, Tsung-Hsing Huang ** * Associate Professor, Chinese Culture University, Taipei **Master, Chinese
GIS Lecture 5: Spatial Data
 GIS Lecture 5: Spatial Data GIS 1 Outline Vector Data Formats Raster Data Formats Map Projections Coordinate Systems US Census geographic files US Census data files GIS Data Sources GIS 2 Vector Data Formats
NR402 GIS Applications in Natural Resources
 NR402 GIS Applications in Natural Resources Lesson 1 Introduction to GIS Eva Strand, University of Idaho Map of the Pacific Northwest from http://www.or.blm.gov/gis/ Welcome to NR402 GIS Applications in
Model Integration - How WEPP inputs are calculated from GIS data. ( ArcGIS,TOPAZ, Topwepp)
") Model Integration - How WEPP inputs are calculated from GIS data. ( ArcGIS,TOPAZ, Topwepp) ArcGIS 9.1-9.3 Allows user to locate area of interest, assemble grids, visualize outputs. TOPAZ Performs DEM
Model Integration - How WEPP inputs are calculated from GIS data. ( ArcGIS,TOPAZ, Topwepp) ArcGIS 9.1-9.3 Allows user to locate area of interest, assemble grids, visualize outputs. TOPAZ Performs DEM
Outcrop suitability analysis of blueschists within the Dry Lakes region of the Condrey Mountain Window, North-central Klamaths, Northern California
 Outcrop suitability analysis of blueschists within the Dry Lakes region of the Condrey Mountain Window, North-central Klamaths, Northern California (1) Introduction: This project proposes to assess the
GIS AS A TOOL FOR MINERAL EXPLORATION
 GIS AS A TOOL FOR MINERAL EXPLORATION By Njagi Dennis Muriithi I13/3169/2008 SGL 413: PROJECT IN GEOLOGY Course coordinators: Dr. C. M. Gichaba Dr. E. Dindi Supervisor: Dr. C. M. Gichaba OUTLINE Introduction
Understanding Geographic Information System GIS
 Understanding Geographic Information System GIS What do we know about GIS? G eographic I nformation Maps Data S ystem Computerized What do we know about maps? Types of Maps (Familiar Examples) Street Maps
Determination of Urban Runoff Using ILLUDAS and GIS
 Texas A&M University Department of Civil Engineering Instructor: Dr. Francisco Olivera CVEN689 Applications of GIS to Civil Engineering Determination of Urban Runoff Using ILLUDAS and GIS Tae Jin Kim 03.
EnvSci 360 Computer and Analytical Cartography
 EnvSci 360 Computer and Analytical Cartography Lecture 7 Mapping Images, Surfaces, and 3-D Data Brief Overview of Imagery What is Imagery? A spatial data model that defines space as an array of equally
CE 394K/CEE6440 GIS in Water Resources Fall 2018 Final Exam Solution
 CE 394K/CEE6440 GIS in Water Resources Fall 2018 Final Exam Solution 3. Austin Population The figure below shows two feature classes, one being the extent of the 1:24,000 Austin East topographic map and
GIS CONCEPTS ARCGIS METHODS AND. 2 nd Edition, July David M. Theobald, Ph.D. Natural Resource Ecology Laboratory Colorado State University
 GIS CONCEPTS AND ARCGIS METHODS 2 nd Edition, July 2005 David M. Theobald, Ph.D. Natural Resource Ecology Laboratory Colorado State University Copyright Copyright 2005 by David M. Theobald. All rights
Outline. Chapter 1. A history of products. What is ArcGIS? What is GIS? Some GIS applications Introducing the ArcGIS products How does GIS work?
 Outline Chapter 1 Introducing ArcGIS What is GIS? Some GIS applications Introducing the ArcGIS products How does GIS work? Basic data formats The ArcCatalog interface 1-1 1-2 A history of products Arc/Info
EMERGENCY PLANNING IN NORTHERN ALGERIA BASED ON REMOTE SENSING DATA IN RESPECT TO TSUNAMI HAZARD PREPAREDNESS
 EMERGENCY PLANNING IN NORTHERN ALGERIA BASED ON REMOTE SENSING DATA IN RESPECT TO TSUNAMI HAZARD PREPAREDNESS Barbara Theilen-Willige Technical University of Berlin, Institute of Applied Geosciences Department
Chapter 6. Fundamentals of GIS-Based Data Analysis for Decision Support. Table 6.1. Spatial Data Transformations by Geospatial Data Types
 Chapter 6 Fundamentals of GIS-Based Data Analysis for Decision Support FROM: Points Lines Polygons Fields Table 6.1. Spatial Data Transformations by Geospatial Data Types TO: Points Lines Polygons Fields
Automatic Watershed Delineation using ArcSWAT/Arc GIS
 Automatic Watershed Delineation using ArcSWAT/Arc GIS By: - Endager G. and Yalelet.F 1. Watershed Delineation This tool allows the user to delineate sub watersheds based on an automatic procedure using
Exercise 5e: Estimating the impact of sea level rise in coastal areas of the United States and comparing to the impact in coastal Asia
 Exercise 5e: Estimating the impact of sea level rise in coastal areas of the United States and comparing to the impact in coastal Asia Data sets (downloaded in previous homework from the National Geophysical
Integrating LiDAR data into the workflow of cartographic representation.
 Integrating LiDAR data into the workflow of cartographic representation. Cartographic Workflow I. 1 2 3 4 5 Surveying Vector (Nat. GDB) GPS, Laser Range Finder Yes/ No Scanning old maps LiDARflights Capture
GIS in Water Resources Midterm Exam Fall 2016 There are four questions on this exam. Please do all four. They are not all of equal weight.
 Page 1 of 7 Name: GIS in Water Resources Midterm Exam Fall 2016 There are four questions on this exam. Please do all four. They are not all of equal weight. Question 1. (20%) (a) Three key functions of
Display data in a map-like format so that geographic patterns and interrelationships are visible
 Vilmaliz Rodríguez Guzmán M.S. Student, Department of Geology University of Puerto Rico at Mayagüez Remote Sensing and Geographic Information Systems (GIS) Reference: James B. Campbell. Introduction to
Use of ArcGIS Applications for Analysis and Representation of the Terrains: The Case Study of Alakır River Sub-basin
 Use of ArcGIS Applications for Analysis and Representation of the Terrains: The Case Study of Alakır River Sub-basin Ahmet BENLİAY, Tahsin YILMAZ and H. Ekin OKTAY 1 Introduction 3D visualizations have
GIS 2010: Coastal Erosion in Mississippi Delta
 1) Introduction Problem overview To what extent do large storm events play in coastal erosion rates, and what is the rate at which coastal erosion is occurring in sediment starved portions of the Mississippi
SRJC Applied Technology 54A Introduction to GIS
 SRJC Applied Technology 54A Introduction to GIS Overview Lecture of Geographic Information Systems Fall 2004 Santa Rosa Junior College Presented By: Tim Pudoff, GIS Coordinator, County of Sonoma, Information
WORKING WITH DMTI DIGITAL ELEVATION MODELS (DEM)
") WORKING WITH DMTI DIGITAL ELEVATION MODELS (DEM) Contents (Ctrl-Click to jump to a specific page) Manipulating the DEM Step 1: Finding the DEM Tiles You Need... 2 Step 2: Importing the DEM Tiles into ArcMap...
WORKING WITH DMTI DIGITAL ELEVATION MODELS (DEM) Contents (Ctrl-Click to jump to a specific page) Manipulating the DEM Step 1: Finding the DEM Tiles You Need... 2 Step 2: Importing the DEM Tiles into ArcMap...
ArcGIS & Extensions - Synergy of GIS tools. Synergy. Analyze & Visualize
 Using ArcGIS Extensions to Analyze and Visualize data Colin Childs 1 Topics Objectives Synergy Analysis & Visualization ArcGIS Analysis environments Geoprocessing tools Extensions ArcMap The analysis Process
Delineation of high landslide risk areas as a result of land cover, slope, and geology in San Mateo County, California
 Delineation of high landslide risk areas as a result of land cover, slope, and geology in San Mateo County, California Introduction Problem Overview This project attempts to delineate the high-risk areas
Hydrology and Floodplain Analysis, Chapter 10
 Hydrology and Floodplain Analysis, Chapter 10 Hydrology and Floodplain Analysis, Chapter 10.1 Introduction to GIS GIS Geographical Information System Spatial Data Data linked with geographical location
DATA APPLIANCE FOR ARCGIS
 DATA APPLIANCE FOR ARCGIS Data Appliance for ArcGIS Provides Access to Multi-Scale Basemaps Down to Medium Scale Levels Worldwide And Large Scale for Most of the World The Data Appliance includes Several
We are IntechOpen, the world s leading publisher of Open Access books Built by scientists, for scientists. International authors and editors
 We are IntechOpen, the world s leading publisher of Open Access books Built by scientists, for scientists 3,500 108,000 1.7 M Open access books available International authors and editors Downloads Our
Extreme Phenomena in Dobrogea - Floods and Droughts
 Extreme Phenomena in Dobrogea - Floods and Droughts PhD eng. Carmen Maftei Ovidius University of Constanta (Partner no 4) OUTLINES Introduction Study area Drought Floods Conclusion What is the problem?
WHAT MAKES A GOOD GIS LAB EXERCISE? Robert N. Martin
 WHAT MAKES A GOOD GIS LAB EXERCISE? Robert N. Martin ABSTRACT Having taught GIS for over fifteen years in a lecture/laboratory format, I have developed a series of laboratory exercise that provide a good
USGS Community Engagement and its Role in Improving The National Map
 USGS Community Engagement and its Role in Improving The National Map ESRI User Conference, 2014 Bob Davis Carol Ostergren Drew Decker USGS Strategic Direction Provides a sharpened focus on our topographic
Aileen Buckley, Ph.D. and Charlie Frye
 An Information Model for Maps: Towards Production from GIS Databases Aileen Buckley, Ph.D. and Charlie Frye Researchers, ESRI GIS vs. cart GIS Outline of the presentation Introduction Differences between
Effects of Rising Sea Levels on Coral Reef and Mangrove Distributions along the Great Barrier Reef in Australia
 Effects of Rising Sea Levels on Coral Reef and Mangrove Distributions along the Great Barrier Reef in Australia Sarah Barfield Graduate Student Department of Integrative Biology University of Texas, Austin
Effects of sea level rise on shallow atolls in the South Pacific
 Tuvalu 2100 Effects of sea level rise on shallow atolls in the South Pacific Kristin Vollmann GEO 327GG December 3, 20100 INTRODUCTION Residents of the tiny island nation of Tuvalu, withh a maximumm elevation
Watershed Modeling With DEMs
 Watershed Modeling With DEMs Lesson 6 6-1 Objectives Use DEMs for watershed delineation. Explain the relationship between DEMs and feature objects. Use WMS to compute geometric basin data from a delineated
Introduction To Raster Based GIS Dr. Zhang GISC 1421 Fall 2016, 10/19
 Introduction To Raster Based GIS Dr. Zhang GISC 1421 Fall 2016, 10/19 Model of the course Using and making maps Navigating GIS maps Map design Working with spatial data Geoprocessing Spatial data infrastructure
Gravity and Magnetic Anomalies Compared to Moho Depth throughout the State of Texas
 Gravity and Magnetic Anomalies Compared to Moho Depth throughout the State of Texas Taylor Borgfeldt Introduction My Master s thesis is to improve and create additional crustal seismic velocity models
Learning Unit Student Guide. Title: Estimating Areas of Suitable Grazing Land Using GPS, GIS, and Remote Sensing
 Learning Unit Student Guide Name of Creator: Jeff Sun Institution: Casper College Email: jsun@caspercollege.edu Phone: Office (307) 268-3560 Cell (307) 277-9766 Title: Estimating Areas of Suitable Grazing
5/3/2018 Susceptibility analysis of landslide due to earthquake due in Gorkha (25th April 2015) Animesh Bahadur Pradhan GIS IN WATER RESOURCES CE 547
 Animesh Bahadur Pradhan GIS IN WATER RESOURCES CE 547") Susceptibility 5/3/2018 analysis of landslide due to earthquake due in Gorkha (25th April 2015) Animesh Bahadur Pradhan GIS IN WATER RESOURCES CE 547 Contents 1. Acknowledgement:... 2 2. Motivation and
Susceptibility 5/3/2018 analysis of landslide due to earthquake due in Gorkha (25th April 2015) Animesh Bahadur Pradhan GIS IN WATER RESOURCES CE 547 Contents 1. Acknowledgement:... 2 2. Motivation and
Submitted to. Prepared by
 Prepared by Tim Webster, PhD Candace MacDonald Applied Geomatics Research Group NSCC, Middleton Tel. 902 825 5475 email: tim.webster@nscc.ca Submitted to Harold MacNeil Engineering Manager Halifax Water
Applying GIS to Hydraulic Analysis
 Texas A&M University Department of Civil Engineering CVEN689 Applications of GIS to Civil Engineering Instructor: Francisco Olivera, Ph.D., P.E. Applying GIS to Hydraulic Analysis Lim, Chae Kwan April
Mapping Undersea Feature Names in S-100. UFNPT at SCUFN 31 Wellington, New Zealand October, 2018
 Mapping Undersea Feature Names in S-100 UFNPT at SCUFN 31 Wellington, New Zealand October, 2018 Content - Update about UFNPT - Discovery of Undersea Features - excercise Work Plan of the UFNPT November
Understanding Projections for GIS
 Presented by John Schaeffer Juniper GIS Services, Inc. This PowerPoint is available at JuniperGIS.com Presentation Objectives To understand basic concepts on projections and coordinate systems for the
Measuring earthquake-generated surface offsets from high-resolution digital topography
 Measuring earthquake-generated surface offsets from high-resolution digital topography July 19, 2011 David E. Haddad david.e.haddad@asu.edu Active Tectonics, Quantitative Structural Geology, and Geomorphology
Sea Level Rise and Hurricane Florence storm surge research methodology
 Sea Level Rise and Hurricane Florence storm surge research methodology Hurricane Florence storm surge analysis was conducted using a variety of input sources. In order to determine the maximum storm surge
Module 2, Investigation 1: Briefing Where do we choose to live and why?
 Module 2, Investigation 1: Briefing Background Why do you live where you live? Where do people choose to live? Why do they choose those places? People have lived on Earth for thousands of years. Throughout
Summary Description Municipality of Anchorage. Anchorage Coastal Resource Atlas Project
 Summary Description Municipality of Anchorage Anchorage Coastal Resource Atlas Project By: Thede Tobish, MOA Planner; and Charlie Barnwell, MOA GIS Manager Introduction Local governments often struggle
An Introduction to Geographic Information System
 An Introduction to Geographic Information System PROF. Dr. Yuji MURAYAMA Khun Kyaw Aung Hein 1 July 21,2010 GIS: A Formal Definition A system for capturing, storing, checking, Integrating, manipulating,