ProMass Deconvolution User Training. Novatia LLC January, 2013
|
|
|
- Rosa Sharp
- 5 years ago
- Views:
Transcription

1 ProMass Deconvolution User Training Novatia LLC January, 2013
2 Overview General info about ProMass Features Basics of how ProMass Deconvolution works Example Spectra Manual Deconvolution with ProMass Deconvolution Parameters Automated Deconvolution with ProMass Questions and User Examples? 2
3 ProMass General Info OPTON for ProMass Deconvolution 2.8 OPTON for ProMass Deconvolution Upgrade from BIOMASS Deconvolution. Those who purchased ProMass 2.0 can upgrade to ProMass 2.8 at no charge, download from Your existing license key is valid. ProMass is compatible with Xcalibur ProMass is compatible with Xcalibur ProMass license model: 1 license per CPU 3
4 ProMass Features Xcalibur layered application Uses Novatia s proprietary ZNova algorithm for artifact-free charge deconvolution of biomolecule ESI mass spectra Allows for automated deconvolution of spectra in LC/MS data from the Xcalibur sample list Produces web-based results format including chromatograms, spectra, color-coded summary, and tabular results Works with proteins, peptides, and oligonucleotides, etc. Applications include: Detailed intact protein characterization impurities, degs, PTM s HT oligonucleotide synthesis QC HT intact protein expression and bioprocess monitoring Peptide mapping works with data-dependent files 4
5 Why we need charge deconvolution Unfortunately mass spectrometers measure m/z NOT Mass: But: Where: Mass (M) m/z m/z = (M + za)/ z A = mass of adduct providing charge z = number of charges Given 2 adjacent m/z peaks (mz 1 and mz 2 ) in a charge series of unknown charges (z 1 and z 2 ), you can use Algebra: z 1 = z z 2 = (mz 1 A)/(mz 2 mz 1 ) You would go insane if you had to do this for every spectrum! 5
6 ZNova Deconvolution Algorithm ZNova is the algorithm used by the ProMass software ZNova uses a component deconvolution approach which tests and determines the charge of every peak in the raw mass spectrum (Zhang & Marshall, JASMS 1998) ZNova uses a simple intensity-based scoring algorithm ZNova has built-in signal processing techniques to improve reliability of deconvolution even on noisy data Automatic baseline removal Decentroiding of centroid input data Smoothing prior to decon Normalization of scoring based on observed/predicted peaks ZNova exhibits low incidence of deconvolution artifacts - unlike Mann algorithm Clean deconvolutions allow reliable confirmation of target components 6
7 ProMass Deconvolution of Yeast Enolase (MW ) Example of Artifact-free Deconvolution m/z Mass(Da) 7
8 Comparison of Deconvolution Algorithms heavy / light chain IgG mixture Mann deconvolution as in Bioworks without known component removal Mass ProMass deconvolution Light chain Heavy chain 8
9 How ZNova Deconvolution Works Example: Test all z values for m/z 751 in the spectrum below Assume +2 (MW 1500) : +1 = 1501, score = 2 Assume +3 (MW 2250) : +4 = 563.5, +2 = 1126, +1 = 2251, score = 1 Assume +4 (MW 3000) : +5 = 601, +3 = 1001, +2 = 1500, score = 4 Assume +5 (MW 3750) : +6 = 626, +4 = 938.5, +3 = 1251, score = 1? zero-charge transform M m/z 3000 Mass Scoring based on accumulated S/N of all peaks in a charge series. Highest scoring test charge state represents the correct charge state. Once correct charges are determined, only those signals are transformed to the zerocharge (deconvoluted) spectrum. 9
")
10 ProMass Deconvolution of Low S/N ESI Data Raw ESI mass spectrum from crude protein purification baseline calculated for removal m/z ProMass deconvoluted spectrum Mass(Da) 10
11 ProMass Deconvolution of Peptide Mixtures ProMass works on low charge state spectra too Raw ESI mass spectrum of tryptic peptide from betalactoglobulin LC/MS analysis m/z ProMass deconvolution Mass(Da) 11
12 ProMass Deconvolution of Hemoglobin Mixture Example of overlapping, closely-related mixture components alpha & beta chains, bovine & porcine proteins ProMass deconvolution ESI mass spectrum m/z Mass(Da) 12
13 ProMass Deconvolution of Coeluting Components Example of overlapping mixture components over wide MW range mixture is from supernatant from precipitated human serum 6 13 kd HSA, 66 kd ESI mass spectrum RT = 11.5 min m/z ProMass Deconvolution RT = 11.5 min Mass 13

14 ProMass Documentation A full set of on-line help is available for ProMass Getting Help! Main help menu from ProMass HomePage Drag? at upper right window to any control to get help about that particular control OR hit F1. Hit the button to get contextsensitive help about the current tab or screen. Documentation ProMass User s Guide PDF is available from the Windows Start Menu at Start Programs ProMass for Xcalibur ProMass User s Guide. However, User Guide is not being updated as frequently as on-line help. 14
15 ProMass Example Data Files Example data files automatically installed with ProMass application: See: C:\Program Files\ProMassXcali\TestData All examples include pre-configured sample lists and processing methods to allow testing of automated features. Examples include: myolcmsdata.raw: Myoglobin LC/MS run useful for demonstrating manual or automatic processing. This is a simple example with a single chromatographic peak. This is the file used in Getting Started with Automated Processing topic in the on-line Help. protein lcms folder: LC/MS run of Michrom 5 protein test mix, useful for demonstrating automatic processing of multiple chromatographic peaks. oligos folder: Example of oligonucleotide MW confirmation using ProMass. Includes 5 data files. Demonstrates target mass summary and Excel reporting features. Described in Application Example: Confirming Masses of Oligonucleotides using ProMass on-line help topic. 15

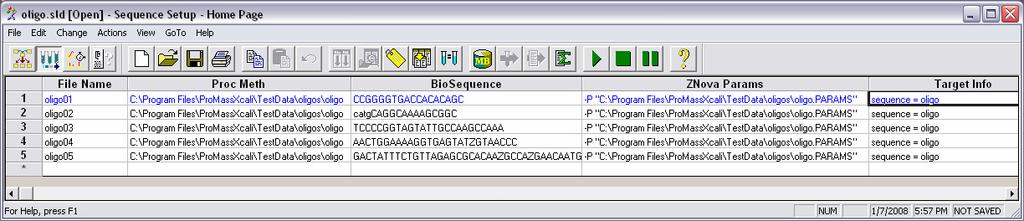
16 ProMass HomePage ZNova Parameter Setup And Manual Processing Add ZNova Parameters to Xcalibur Sequence Browse the latest automated processing event Validate Xcalibur Processing Method to ensure proper format 16


17 Basic ProMass Manual Operation Mode Export Xcalibur spectrum to clipboard from Qual Browser Right click spectrum and select Export Clipboard (Exact Mass) Launch ProMass and click Build Params Set or restore a default set of parameters Click the paste/process spectrum button 17

18 ProMass Basic Deconvolution Settings A new user can easily process spectra by restoring a set of default parameters and setting input and output mass ranges. 18


19 19 Basic Deconvolution Live Demo Myoglobin LC/MS example data
20 ProMass Advanced Decon Settings Parameters Guide: Set input/output mass ranges Use 0.1 Da step size for < 5000 MW Adduct Ion Mass for pos ions, for neg ions Adjust Baseline Removal to get a flat baseline (look at raw ESI spectrum in ProMass report) Set Peak Width to match m/z peak width (at base) in original mass spectrum Merge Width ~10% of Peak Width Use Comprehensive decon for most applications where there could be mixture overlap Centroid Output not generally recommended Explore settings! Take advantage of the context-sensitive on-line help. 20

21 ProMass Results Settings What the settings do: Determine where results are stored Customize the graphics output Allow user to set the width of the zoomed spectrum, or to set an explicit zoom range Specify report template for web-based output Set labeling parameters use data points labeling mode if components labeling does not give you enough detail, especially when a wide peak width setting is used. 21
22 Deconvoluting Difficult Spectra Most (>80%) spectra can be deconvoluted successfully with default settings Try default settings first, then modify as needed Noisy spectra, complicated mixtures, or spectra with a high baseline may require some parameter adjustment Adequately remove the baseline noise Choose the correct peak width For very noisy spectra, narrow your deconvolution range to focus the algorithm to where you expect masses to be present. Noisy spectra may require manually setting the noise threshold A blob spectrum with a peak at every mass may be impossible to deconvolute with any algorithm Use ProMass viewer to validate charge series Demonstrated Examples: Intact IgG s setting a wide peak width Crude 40 kd protein removing baseline, setting a reasonable noise level Hemoglobins, etc 22


23 Interactive Viewing with the ProMass Viewer Double click spectrum or use [View Data] link to call up viewer Use the ProMass viewer to validate charge series and export high quality graphics to Word, Powerpoint, etc. 23


24 ProMass Automated Processing Xcalibur Sample Sequence defines samples to be analyzed optional amino acid or nucleotide sequence Parameter Setup defines parameters for deconvolution Xcalibur Processing Method defines how peaks are selected Peak picking, auto deconvolution, and report generation HTML Results Report including plate view, spectra, chromatograms, tables, etc. 24
25 ProMass Automated Processing The easiest way to learn is by trying the examples in the ProMass program TestData folder Help topics include a Getting Started section and detailed instructions for setting up automated runs Basic Requirements: Xcalibur sequence with data file(s) Valid Qual Processing Method ProMass program is attached to Proc Method Proc Method scan type must be set to match data file Proc Method must be able to detect chromatographic peaks Optional ZNova parameters, target masses, or biomolecule sequence Process data using Batch Reprocess function or launch automatically after acquistion is completed 25
26 Configuring Xcalibur Sample List Required Fields: File Name, Proc Meth ZNova Params (optional): for entering parameter strings if not specified, default parameter set is used (znova.params in znova program directory) Parameter file specified with P option, many other options available BioSequence (optional): amino acid or nucleotide sequence Masses automatically calculated and treated as target masses Sequence type must be specified in Target Info field Can specify a path to a sequence text file Target Info (optional): information about target masses Specify BioSequence string type Enter explicit comma-separated target masses 26

27 Configuring a Qual Processing Method Select Qual Open Raw file Set Scan Filter Set Chrom. Time range Set integration options Limit peaks if necessary Greyed area of peaks indicates what scans will be averaged for ProMass decon 27

28 Configuring a Proc Method, Programs Section ProMass program is attached to Proc Method Must be configured as shown Use Check Proc Method tool on ProMass Home Page to add these parameters 28

29 Configuring a Proc Method for Background Subtraction Select Spectrum Enhancement Tab Select Enable Only Combine option is supported for bkgnd subtract Set regions for peak top and before and after peak 29
")
30 Batch Reprocessing with ProMass Acquire data Configure sample list Hit the Batch Reprocess button Check the options shown at the left Spectrum Enhancement option may also be checked to allow for background subtraction (must also be configured in Proc Method) 30

31 Automatic Post-Acquisition Processing ProMass can also be run automatically following acquisition through the Run Sequence dialog. Select the Qual and Programs options in the Run Sequence dialog. Ensure that the sample list is fully configured to run ProMass if you select these options at run time. 31
 Allows")
32 ProMass Reporting Settings What the settings do: Reporting Tab ONLY affects automated processing report does nothing to manual processing report Determines Target Mass behavior Enables Sample Plate View or Excel Summary Set labeling behavior of chromatogram traces Allows for setting of thresholds for chromatographic peaks selected for deconvolution (overriding proc method settings) Allows explicit background subtraction regions to be set (overriding proc method settings) 32
33 Automated Processing Demo Examples are included with ProMass installation Myoglobin LC/MS simple example with single chromatographic peak Oligonucleotide mass confirmation target mass features, plate view, Excel summary Protein LC/MS mixture deconvoluting multiple chromatographic peaks, multiple target masses 33
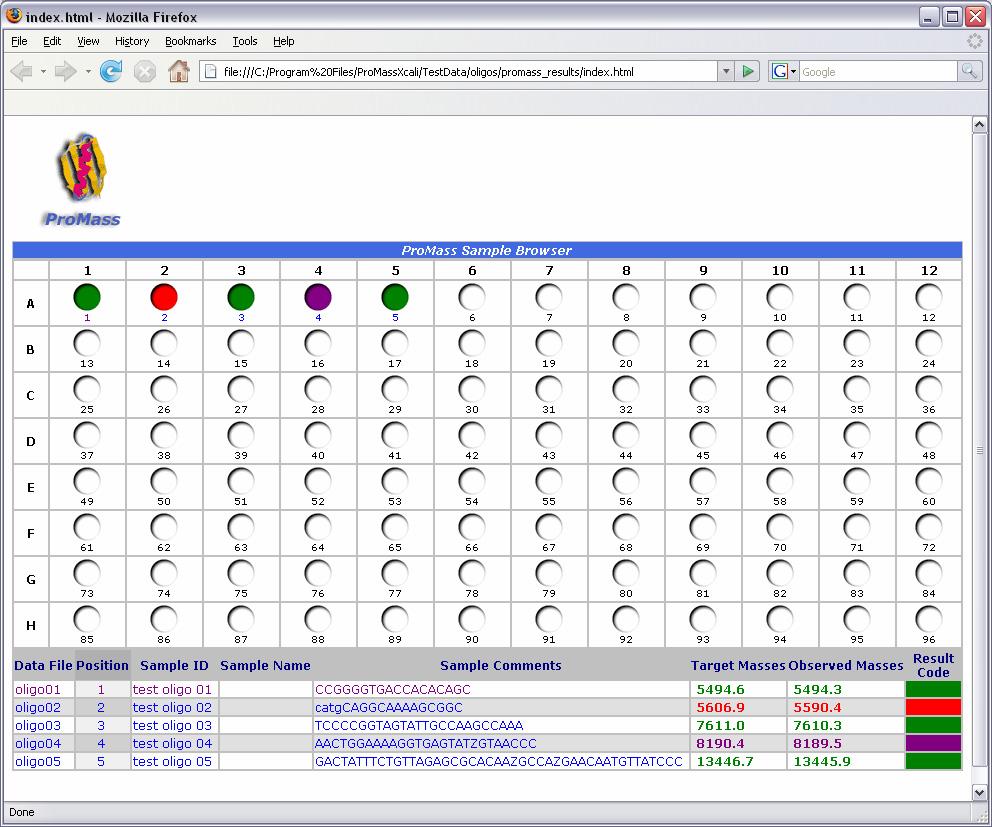
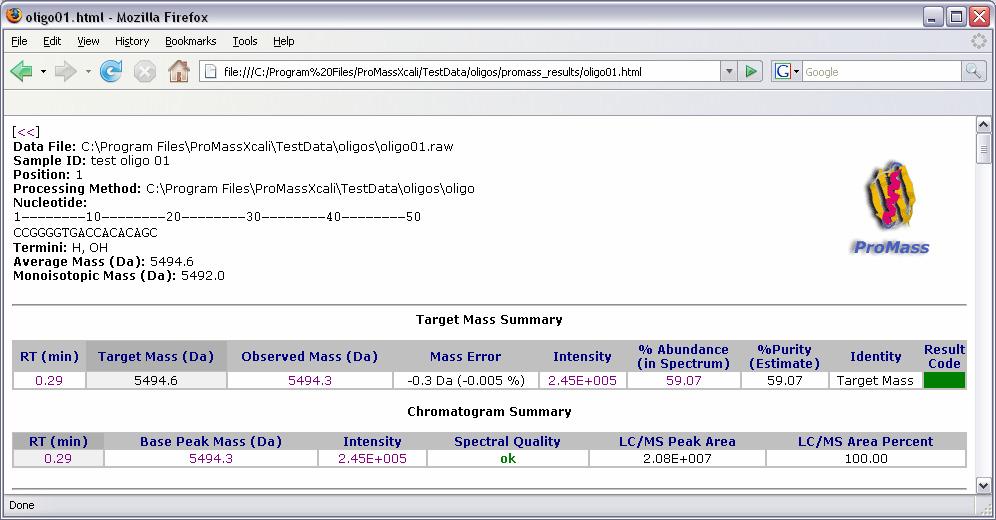
34 34 Oligo Application Example
35 Additional Tools and Tips for Using ProMass Tools: The ZNova-ize Sequence utility will add ProMass processing parameters to an Xcalibur sequence Check Processing Method utility will add the ProMass program to a Proc Method Deconvoluted spectrum viewer Settings Minimizing the console, setting task priority, suppressing error messages Browsing previously processed files ProMass directory structure Where to find results ZNova mass configuration file Sharing ProMass results with colleagues 35
36 Resources and Feedback ProMass website: Includes the latest ProMass news Downloads and updates FAQ Support information and links Application examples Novatia is continually working to improve ProMass and wants to be aware of any problems or suggestions to enhance the product. Please forward any feature requests and suspected software problems to Novatia. Contact Novatia at or (732)
Protein Deconvolution Version 2.0
 Thermo Protein Deconvolution Version 2.0 User Guide XCALI-97414 Revision A August 2012 2012 Thermo Fisher Scientific Inc. All rights reserved. ReSpect is a trademark of Positive Probability Ltd. Xcalibur
MassHunter Software Overview
 MassHunter Software Overview 1 Qualitative Analysis Workflows Workflows in Qualitative Analysis allow the user to only see and work with the areas and dialog boxes they need for their specific tasks A
MassHunter TOF/QTOF Users Meeting
 MassHunter TOF/QTOF Users Meeting 1 Qualitative Analysis Workflows Workflows in Qualitative Analysis allow the user to only see and work with the areas and dialog boxes they need for their specific tasks
Agilent MassHunter Quantitative Data Analysis
 Agilent MassHunter Quantitative Data Analysis Presenters: Howard Sanford Stephen Harnos MassHunter Quantitation: Batch and Method Setup Outliers, Data Review, Reporting 1 MassHunter Quantitative Analysis
Last updated: Copyright
 Last updated: 2012-08-20 Copyright 2004-2012 plabel (v2.4) User s Manual by Bioinformatics Group, Institute of Computing Technology, Chinese Academy of Sciences Tel: 86-10-62601016 Email: zhangkun01@ict.ac.cn,
Agilent MassHunter Quantitative Data Analysis
 Agilent MassHunter Quantitative Data Analysis Presenters: Howard Sanford Stephen Harnos MassHunter Quantitation: Batch Table, Compound Information Setup, Calibration Curve and Globals Settings 1 MassHunter
SIERRA ANALYTICS, INC. Version Polymerix Software User Manual
 SIERRA ANALYTICS, INC. Version 3.0.0 Polymerix Software User Manual V E R S I O N 3.0.0 M A R C H 2013 Polymerix Software User Manual Copyright 2010 to 2013 Sierra Analytics, Inc. 5815 Stoddard Road, Suite
1. Prepare the MALDI sample plate by spotting an angiotensin standard and the test sample(s).
.") Analysis of a Peptide Sequence from a Proteolytic Digest by MALDI-TOF Post-Source Decay (PSD) and Collision-Induced Dissociation (CID) Standard Operating Procedure Purpose: The following procedure may
Analysis of a Peptide Sequence from a Proteolytic Digest by MALDI-TOF Post-Source Decay (PSD) and Collision-Induced Dissociation (CID) Standard Operating Procedure Purpose: The following procedure may
Agilent All Ions MS/MS
 Agilent All Ions MS/MS Workflow Overview A Determine fragment ions for LC/MS Quant method B Develop final Quant method Develop LC/MS Qualitative Analysis method Process data with Find by Formula Build
Tutorial 1: Setting up your Skyline document
 Tutorial 1: Setting up your Skyline document Caution! For using Skyline the number formats of your computer have to be set to English (United States). Open the Control Panel Clock, Language, and Region
Mnova Software Tools for Fragment-Based Drug Discovery
 Mnova Software Tools for Fragment-Based Drug Discovery Chen Peng, PhD, VP of Business Development, US & China Mestrelab Research SL San Diego, CA chen.peng@mestrelab.com 858.736.4563 Agenda Brief intro
Miniature Fiber Optic Spectrometry StellarNet Tutorial
 StellarNet Tutorial Using SpectraWiz VBA-NIST-CRI/CQS for MS Excel Contents This tutorial describes the basic measurement procedure for using a StellarNet SpectroRadiometer system with the free SpectraWiz
Mnova Software for Analyzing Reaction Monitoring NMR Spectra
 Mnova Software for Analyzing Reaction Monitoring NMR Spectra Version 10 Chen Peng, PhD, VP of Business Development, US & China Mestrelab Research SL San Diego, CA, USA chen.peng@mestrelab.com 858.736.4563
Measuring ph with Smart Cuvettes
 1 Measuring ph with Smart Cuvettes Hardware Setup for ph Measurements ph is measured in Absorbance mode. Configure your spectroscopy components for Absorbance measurements. Sample Absorbance setups for
ncounter PlexSet Data Analysis Guidelines
 ncounter PlexSet Data Analysis Guidelines NanoString Technologies, Inc. 530 airview Ave North Seattle, Washington 98109 USA Telephone: 206.378.6266 888.358.6266 E-mail: info@nanostring.com Molecules That
NMR Predictor. Introduction
 NMR Predictor This manual gives a walk-through on how to use the NMR Predictor: Introduction NMR Predictor QuickHelp NMR Predictor Overview Chemical features GUI features Usage Menu system File menu Edit
SRM assay generation and data analysis in Skyline
 in Skyline Preparation 1. Download the example data from www.srmcourse.ch/eupa.html (3 raw files, 1 csv file, 1 sptxt file). 2. The number formats of your computer have to be set to English (United States).
Making Sense of Differences in LCMS Data: Integrated Tools
 Making Sense of Differences in LCMS Data: Integrated Tools David A. Weil Agilent Technologies MassHunter Overview Page 1 March 2008 How Clean is our Water?... Page 2 Chemical Residue Analysis.... From
HOWTO, example workflow and data files. (Version )
") HOWTO, example workflow and data files. (Version 20 09 2017) 1 Introduction: SugarQb is a collection of software tools (Nodes) which enable the automated identification of intact glycopeptides from HCD
HOWTO, example workflow and data files. (Version 20 09 2017) 1 Introduction: SugarQb is a collection of software tools (Nodes) which enable the automated identification of intact glycopeptides from HCD
Task 1: Open ArcMap and activate the Spatial Analyst extension.
 Exercise 10 Spatial Analyst The following steps describe the general process that you will follow to complete the exercise. Specific steps will be provided later in the step-by-step instructions component
Tutorial. Getting started. Sample to Insight. March 31, 2016
 Getting started March 31, 2016 Sample to Insight CLC bio, a QIAGEN Company Silkeborgvej 2 Prismet 8000 Aarhus C Denmark Telephone: +45 70 22 32 44 www.clcbio.com support-clcbio@qiagen.com Getting started
Ocean Optics Red Tide UV-VIS Spectrometer (Order Code: SPRT-UV-VIS)
") Ocean Optics Red Tide UV-VIS Spectrometer (Order Code: SPRT-UV-VIS) The UV-VIS spectrometer is a portable ultraviolet light and visible light spectrophotometer, combining a spectrometer and a light source/cuvette
Ocean Optics Red Tide UV-VIS Spectrometer (Order Code: SPRT-UV-VIS) The UV-VIS spectrometer is a portable ultraviolet light and visible light spectrophotometer, combining a spectrometer and a light source/cuvette
Comparing whole genomes
 BioNumerics Tutorial: Comparing whole genomes 1 Aim The Chromosome Comparison window in BioNumerics has been designed for large-scale comparison of sequences of unlimited length. In this tutorial you will
ST-Links. SpatialKit. Version 3.0.x. For ArcMap. ArcMap Extension for Directly Connecting to Spatial Databases. ST-Links Corporation.
 ST-Links SpatialKit For ArcMap Version 3.0.x ArcMap Extension for Directly Connecting to Spatial Databases ST-Links Corporation www.st-links.com 2012 Contents Introduction... 3 Installation... 3 Database
MERGING (MERGE / MOSAIC) GEOSPATIAL DATA
 GEOSPATIAL DATA") This help guide describes how to merge two or more feature classes (vector) or rasters into one single feature class or raster dataset. The Merge Tool The Merge Tool combines input features from input
This help guide describes how to merge two or more feature classes (vector) or rasters into one single feature class or raster dataset. The Merge Tool The Merge Tool combines input features from input
Tutorial 2: Analysis of DIA data in Skyline
 Tutorial 2: Analysis of DIA data in Skyline In this tutorial we will learn how to use Skyline to perform targeted post-acquisition analysis for peptide and inferred protein detection and quantitation using
New Approaches to the Development of GC/MS Selected Ion Monitoring Acquisition and Quantitation Methods Technique/Technology
 New Approaches to the Development of GC/MS Selected Ion Monitoring Acquisition and Quantitation Methods Technique/Technology Gas Chromatography/Mass Spectrometry Author Harry Prest 1601 California Avenue
Jasco V-670 absorption spectrometer
 Laser Spectroscopy Labs Jasco V-670 absorption spectrometer Operation instructions 1. Turn ON the power switch on the right side of the spectrophotometer. It takes about 5 minutes for the light source
You w i ll f ol l ow these st eps : Before opening files, the S c e n e panel is active.
 You w i ll f ol l ow these st eps : A. O pen a n i m a g e s t a c k. B. Tr a c e t h e d e n d r i t e w i t h t h e user-guided m ode. C. D e t e c t t h e s p i n e s a u t o m a t i c a l l y. D. C
All Ions MS/MS: Targeted Screening and Quantitation Using Agilent TOF and Q-TOF LC/MS Systems
 All Ions MS/MS: Targeted Screening and Quantitation Using Agilent TOF and Q-TOF LC/MS Systems Technical Overview Introduction All Ions MS/MS is a technique that is available for Agilent high resolution
TOP MARKET SURVEY INSTRUCTION SHEET. Requirements. Overview
 INSTRUCTION SHEET TOP SURVEY TOP SURVEY INSTRUCTION SHEET Overview For nearly 40 years, the ACA has surveyed member agencies and conducted the Top Collection Market Survey. This survey provides critical
Analyst Software. Peptide and Protein Quantitation Tutorial
 This document is provided to customers who have purchased AB Sciex equipment to use in the operation of such AB Sciex equipment. This document is copyright protected and any reproduction of this document
Comprehensive support for quantitation
 Comprehensive support for quantitation One of the major new features in the current release of Mascot is support for quantitation. This is still work in progress. Our goal is to support all of the popular
 NanoDrop One Viewer software NanoDrop One Website. NanoDrop One Website NanoDrop One Viewer software NanoDrop One Website Software System Update Update Update Software, Update Note OK Language Measure
This tutorial is intended to familiarize you with the Geomatica Toolbar and describe the basics of viewing data using Geomatica Focus.
 PCI GEOMATICS GEOMATICA QUICKSTART 1. Introduction This tutorial is intended to familiarize you with the Geomatica Toolbar and describe the basics of viewing data using Geomatica Focus. All data used in
WeatherHawk Weather Station Protocol
 WeatherHawk Weather Station Protocol Purpose To log atmosphere data using a WeatherHawk TM weather station Overview A weather station is setup to measure and record atmospheric measurements at 15 minute
Agilent TOF Screening & Impurity Profiling Julie Cichelli, PhD LC/MS Small Molecule Workshop Dec 6, 2012
 1 Agilent TOF Screening & Impurity Profiling Julie Cichelli, PhD LC/MS Small Molecule Workshop Dec 6, 2012 Review: Technology for Accurate Mass Analysis: TOF LC/MS Mass measurements accurate to several
The CSC Interface to Sky in Google Earth
 The CSC Interface to Sky in Google Earth CSC Threads The CSC Interface to Sky in Google Earth 1 Table of Contents The CSC Interface to Sky in Google Earth - CSC Introduction How to access CSC data with
Spectrometer User s Guide
 Spectrometer User s Guide (Order Codes: V-SPEC, SPRT-VIS, SP-VIS, SP-UV-VIS, ESRT-VIS) The spectrometer is a portable light spectrophotometer, combining a spectrometer and a light source/cuvette holder.
TECDIS and TELchart ECS Weather Overlay Guide
 1 of 24 TECDIS and TELchart ECS provides a very advanced weather overlay feature, using top quality commercial maritime weather forecast data available as a subscription service from Jeppesen Marine. The
Searching Substances in Reaxys
 Searching Substances in Reaxys Learning Objectives Understand that substances in Reaxys have different sources (e.g., Reaxys, PubChem) and can be found in Document, Reaction and Substance Records Recognize
TOF/QTOF Users Meeting. Jim Lau, Agilent Technologies.
 TOF/QTOF Users Meeting Jim Lau, Agilent Technologies. Agenda Goal Share Best Practices, Develop Network of Agilent Users Today s Topics: Care and Feeding Agilent LCMS Systems Data Acquisition: Optimize
M E R C E R W I N WA L K T H R O U G H
 H E A L T H W E A L T H C A R E E R WA L K T H R O U G H C L I E N T S O L U T I O N S T E A M T A B L E O F C O N T E N T 1. Login to the Tool 2 2. Published reports... 7 3. Select Results Criteria...
CRL MASS SPECTROMETRY FACILITY USER MANUAL LCT CLASSIC A & B
 Mass Spectrometry Instrument Training Guide Page 1 of 18 24/10/2012 CRL MASS SPECTROMETRY FACILITY USER MANUAL LCT CLASSIC A & B 1st Floor Mass Spec Lab: 00.097 This is a guide to using the LCT classic
QuantumMCA QuantumNaI QuantumGe QuantumGold
 QuantumMCA QuantumNaI QuantumGe QuantumGold Berkeley Nucleonics Corporation (San Rafael, CA) and Princeton Gamma Tech (Princeton, NJ) have partnered to offer gamma spectroscopy with either germanium or
The Select Command and Boolean Operators
 The Select Command and Boolean Operators Part of the Jmol Training Guide from the MSOE Center for BioMolecular Modeling Interactive version available at http://cbm.msoe.edu/teachingresources/jmol/jmoltraining/boolean.html
GIS Workshop UCLS_Fall Forum 2014 Sowmya Selvarajan, PhD TABLE OF CONTENTS
 TABLE OF CONTENTS TITLE PAGE NO. 1. ArcGIS Basics I 2 a. Open and Save a Map Document 2 b. Work with Map Layers 2 c. Navigate in a Map Document 4 d. Measure Distances 4 2. ArcGIS Basics II 5 a. Work with
Analyst Software. Automatic Optimization Tutorial
 This document is provided to customers who have purchased AB Sciex equipment to use in the operation of such AB Sciex equipment. This document is copyright protected and any reproduction of this document
Software BioScout-Calibrator June 2013
 SARAD GmbH BioScout -Calibrator 1 Manual Software BioScout-Calibrator June 2013 SARAD GmbH Tel.: ++49 (0)351 / 6580712 Wiesbadener Straße 10 FAX: ++49 (0)351 / 6580718 D-01159 Dresden email: support@sarad.de
MassHunter METLIN Metabolite PCD/PCDL Quick Start Guide
 MassHunter METLIN Metabolite PCD/PCDL Quick Start Guide What is the MassHunter METLIN Metabolite PCD/PCDL? 2 Where to find more information 2 Kit Content 3 Installation 5 Before you start 5 Install MassHunter
Notifications and Accretions: Facility Role
 Notifications and Accretions: Facility Role Goal: Learn to view and resolve notification and accretion discrepancies in CROWNWeb. Estimated Time: 25 to 30 minutes PDF: Download a screen reader compatible
Using SkyTools to log Texas 45 list objects
 Houston Astronomical Society Using SkyTools to log Texas 45 list objects You can use SkyTools to keep track of objects observed in Columbus and copy the output into the Texas 45 observation log. Preliminary
(THIS IS AN OPTIONAL BUT WORTHWHILE EXERCISE)
") PART 2: Analysis in ArcGIS (THIS IS AN OPTIONAL BUT WORTHWHILE EXERCISE) Step 1: Start ArcCatalog and open a geodatabase If you have a shortcut icon for ArcCatalog on your desktop, double-click it to start
PART 2: Analysis in ArcGIS (THIS IS AN OPTIONAL BUT WORTHWHILE EXERCISE) Step 1: Start ArcCatalog and open a geodatabase If you have a shortcut icon for ArcCatalog on your desktop, double-click it to start
Appendix 4 Weather. Weather Providers
 Appendix 4 Weather Using weather data in your automation solution can have many benefits. Without weather data, your home automation happens regardless of environmental conditions. Some things you can
Quick Start Guide New Mountain Visit our Website to Register Your Copy (weatherview32.com)
") Quick Start Guide New Mountain Visit our Website to Register Your Copy (weatherview32.com) Page 1 For the best results follow all of the instructions on the following pages to quickly access real-time
Quick Start Guide New Mountain Visit our Website to Register Your Copy (weatherview32.com) Page 1 For the best results follow all of the instructions on the following pages to quickly access real-time
v Prerequisite Tutorials GSSHA WMS Basics Watershed Delineation using DEMs and 2D Grid Generation Time minutes
 v. 10.1 WMS 10.1 Tutorial GSSHA WMS Basics Creating Feature Objects and Mapping Attributes to the 2D Grid Populate hydrologic parameters in a GSSHA model using land use and soil data Objectives This tutorial
Part 4 The Select Command and Boolean Operators
 Part 4 The Select Command and Boolean Operators http://cbm.msoe.edu/newwebsite/learntomodel Introduction By default, every command you enter into the Console affects the entire molecular structure. However,
Designing a Quilt with GIMP 2011
 Planning your quilt and want to see what it will look like in the fabric you just got from your LQS? You don t need to purchase a super expensive program. Try this and the best part it s FREE!!! *** Please
An Effective Workflow for Impurity Analysis Incorporating High Quality HRAM LCMS & MSMS with Intelligent Automated Data Mining
 An Effective Workflow for Impurity Analysis Incorporating High Quality HRAM LCMS & MSMS with Intelligent Automated Data Mining Dave Weil, Ph.D. and Jim Lau, Ph.D. Typical Method Conditions: 1260 UHPLC
mzmatch Excel Template Tutorial
 mzmatch Excel Template Tutorial Installation & Requirements Installation The template may be used to process mzmatch output text files without additional installations or add-ins. Microsoft Excel 2007
pmod An Advanced Protein Deconvolution Algorithm with Automated Peak Modeling for Charge Deconvolution of Mass Spectrometry Data
 pmod An Advanced Protein Deconvolution Algorithm with Automated Peak Modeling for Charge Deconvolution of Mass Spectrometry Data Application Note Authors Ning Tang, Xiaoling Wu, and Stephen Madden Agilent
Search for the Gulf of Carpentaria in the remap search bar:
 This tutorial is aimed at getting you started with making maps in Remap (). In this tutorial we are going to develop a simple classification of mangroves in northern Australia. Before getting started with
Location Intelligence Infrastructure Asset Management. Confirm. Confirm Mapping Link to ArcMap Version v18.00b.am
 Location Intelligence Infrastructure Asset Management Confirm Confirm Mapping Link to ArcMap Version v18.00b.am Information in this document is subject to change without notice and does not represent a
February 7, Jay Krafthefer, L.S.
 February 7, 2013 Jay Krafthefer, L.S. Introduction Background Web applications References Maps released on the Internet self-service not filed for record referenced by Commissioner s orders (Minn. Statute
Skyline Small Molecule Targets
 Skyline Small Molecule Targets The Skyline Targeted Proteomics Environment provides informative visual displays of the raw mass spectrometer data you import into your Skyline documents. Originally developed
Application Note LCMS-112 A Fully Automated Two-Step Procedure for Quality Control of Synthetic Peptides
 Application Note LCMS-112 A Fully Automated Two-Step Procedure for Quality Control of Synthetic Peptides Abstract Here we describe a two-step QC procedure for synthetic peptides. In the first step, the
Watershed Modeling With DEMs
 Watershed Modeling With DEMs Lesson 6 6-1 Objectives Use DEMs for watershed delineation. Explain the relationship between DEMs and feature objects. Use WMS to compute geometric basin data from a delineated
PeptideProphet: Validation of Peptide Assignments to MS/MS Spectra
 PeptideProphet: Validation of Peptide Assignments to MS/MS Spectra Andrew Keller Day 2 October 17, 2006 Andrew Keller Rosetta Bioinformatics, Seattle Outline Need to validate peptide assignments to MS/MS
SEAMLESS INTEGRATION OF MASS DETECTION INTO THE UV CHROMATOGRAPHIC WORKFLOW
 SEAMLESS INTEGRATION OF MASS DETECTION INTO THE UV CHROMATOGRAPHIC WORKFLOW Paula Hong, John Van Antwerp, and Patricia McConville Waters Corporation, Milford, MA, USA Historically UV detection has been
Graphical User Interfaces for Emittance and Correlation Plot. Henrik Loos
 Graphical User Interfaces for Emittance and Correlation Plot Common GUI Features Overview Files Configs Measure Data Point Export Common GUI Features Save Saves the present data. Auto-generated file name
HOW TO ANALYZE SYNCHROTRON DATA
 HOW TO ANALYZE SYNCHROTRON DATA 1 SYNCHROTRON APPLICATIONS - WHAT Diffraction data are collected on diffractometer lines at the world s synchrotron sources. Most synchrotrons have one or more user facilities
Chem Page IX - 1 LAB MANUAL Differential Scanning Calorimetry 09_dsc131.docx EXPERIMENT IX
 Chem 366-3 Page IX - 1 LAB MANUAL Differential Scanning Calorimetry 09_dsc131.docx EXPERIMENT IX KINETICS OF DECOMPOSITION OF SODIUM BICARBONATE; A DIFFERENTIAL SCANNING CALORIMETRY EXPERIMENT 1. Purpose
Protein Bioinformatics Computer lab #1 Friday, April 11, 2008 Sean Prigge and Ingo Ruczinski
 Protein Bioinformatics 260.655 Computer lab #1 Friday, April 11, 2008 Sean Prigge and Ingo Ruczinski Goals: Approx. Time [1] Use the Protein Data Bank PDB website. 10 minutes [2] Use the WebMol Viewer.
BIOLIGHT STUDIO IN ROUTINE UV/VIS SPECTROSCOPY
 BIOLIGHT STUDIO IN ROUTINE UV/VIS SPECTROSCOPY UV/Vis Spectroscopy is a technique that is widely used to characterize, identify and quantify chemical compounds in all fields of analytical chemistry. The
Creating Empirical Calibrations
 030.0023.01.0 Spreadsheet Manual Save Date: December 1, 2010 Table of Contents 1. Overview... 3 2. Enable S1 Calibration Macro... 4 3. Getting Ready... 4 4. Measuring the New Sample... 5 5. Adding New
Agilent MassHunter Profinder: Solving the Challenge of Isotopologue Extraction for Qualitative Flux Analysis
 Agilent MassHunter Profinder: Solving the Challenge of Isotopologue Extraction for Qualitative Flux Analysis Technical Overview Introduction Metabolomics studies measure the relative abundance of metabolites
ArcGIS 9 ArcGIS StreetMap Tutorial
 ArcGIS 9 ArcGIS StreetMap Tutorial Copyright 2001 2008 ESRI All Rights Reserved. Printed in the United States of America. The information contained in this document is the exclusive property of ESRI. This
Simulating Future Climate Change Using A Global Climate Model
 Simulating Future Climate Change Using A Global Climate Model Introduction: (EzGCM: Web-based Version) The objective of this abridged EzGCM exercise is for you to become familiar with the steps involved
Moving into the information age: From records to Google Earth
 Moving into the information age: From records to Google Earth David R. R. Smith Psychology, School of Life Sciences, University of Hull e-mail: davidsmith.butterflies@gmail.com Introduction Many of us
Agilent 6400 Series Triple Quadrupole LC/MS/MS Users Session
 Agilent 6400 Series Triple Quadrupole LC/MS/MS Users Session QQQ Method Development and Optimization MassHunter Quant: Method setup Peak detection optimization Quant troubleshooting David Presser Application
T R A I N I N G M A N U A L 1. 9 G H Z C D M A P C S 80 0 M H Z C D M A /A M P S ( T R I - M O D E ) PM325
 PM325") T R A I N I N G M A N U A L 1. 9 G H Z C D M A P C S 80 0 M H Z C D M A /A M P S ( T R I - M O D E ) PM325 Slide. Click. Send the pic O P E R AT I N G I N S T RU C T I O N S H e a d s e t Ja c k S e l
T R A I N I N G M A N U A L 1. 9 G H Z C D M A P C S 80 0 M H Z C D M A /A M P S ( T R I - M O D E ) PM325 Slide. Click. Send the pic O P E R AT I N G I N S T RU C T I O N S H e a d s e t Ja c k S e l
SuperCELL Data Programmer and ACTiSys IR Programmer User s Guide
 SuperCELL Data Programmer and ACTiSys IR Programmer User s Guide This page is intentionally left blank. SuperCELL Data Programmer and ACTiSys IR Programmer User s Guide The ACTiSys IR Programmer and SuperCELL
Learning ArcGIS: Introduction to ArcCatalog 10.1
 Learning ArcGIS: Introduction to ArcCatalog 10.1 Estimated Time: 1 Hour Information systems help us to manage what we know by making it easier to organize, access, manipulate, and apply knowledge to the
Understanding Your Spectra Module. Agilent OpenLAB CDS ChemStation Edition
 Understanding Your Spectra Module Agilent OpenLAB CDS ChemStation Edition Notices Agilent Technologies, Inc. 1994-2012, 2013 No part of this manual may be reproduced in any form or by any means (including
AAG TPoint Mapper (Version 1.40)
") AAG TPoint Mapper (Version 1.40) AAG_TPointMapper works together with Maxim DL, Pinpoint, TheSky6 and TPoint to automate the process of building a TPoint model for a GOTO telescope connected to TheSky6.
AAG TPoint Mapper (Version 1.40) AAG_TPointMapper works together with Maxim DL, Pinpoint, TheSky6 and TPoint to automate the process of building a TPoint model for a GOTO telescope connected to TheSky6.
NMR Data workup using NUTS
 omework 1 Chem 636, Fall 2008 due at the beginning of the 2 nd week lab (week of Sept 9) NMR Data workup using NUTS This laboratory and homework introduces the basic processing of one dimensional NMR data
CityGML XFM Application Template Documentation. Bentley Map V8i (SELECTseries 2)
") CityGML XFM Application Template Documentation Bentley Map V8i (SELECTseries 2) Table of Contents Introduction to CityGML 1 CityGML XFM Application Template 2 Requirements 2 Finding Documentation 2 To
CityGML XFM Application Template Documentation Bentley Map V8i (SELECTseries 2) Table of Contents Introduction to CityGML 1 CityGML XFM Application Template 2 Requirements 2 Finding Documentation 2 To
Building Inflation Tables and CER Libraries
 Building Inflation Tables and CER Libraries January 2007 Presented by James K. Johnson Tecolote Research, Inc. Copyright Tecolote Research, Inc. September 2006 Abstract Building Inflation Tables and CER
The Development of a Quality Control and Analysis Application for the ThermoFluor High Throughput Screening Assay
 The Development of a Quality Control and Analysis Application for the ThermoFluor High Throughput Screening Assay Robert B. Nachbar 1 Delphine Collin 2 Jonathan Robinson 1 Thomas J. Mildorf 3 Eugen Buehler
Sample Alignment Part
 Sample Alignment Part Contents Contents 1. How to set Part conditions...1 1.1 Setting conditions... 1 1.2 Customizing scan conditions and slit conditions... 6 2. Sample alignment sequence...13 2.1 Direct
WALKUP LC/MS FOR PHARMACEUTICAL R&D
 Pharmaceutical Workflow Solutions WALKUP LC/MS FOR PHARMACEUTICAL R&D Chemists, Peptide/Protein Chemists, Biologists, and Beyond MASSHUNTER WALKUP A Single User Interface for Robust and Reliable LC/MS
The next generation in weather radar software.
 The next generation in weather radar software. PUBLISHED BY Vaisala Oyj Phone (int.): +358 9 8949 1 P.O. Box 26 Fax: +358 9 8949 2227 FI-00421 Helsinki Finland Try IRIS Focus at iris.vaisala.com. Vaisala
BOUNDARY MAP USER GUIDE
 BOUNDARY MAP USER GUIDE Get Exploring. Boundaries. The Northern Ontario Boundary Map provides users with the ability to explore the many community, administrative and service provider boundaries in the
Welcome! Course 7: Concepts for LC-MS
 Welcome! Mass Spectrometry meets Cheminformatics Tobias Kind and Julie Leary UC Davis Course 7: Concepts for LC-MS Class website: CHE 241 - Spring 28 - CRN 16583 Slides: http://fiehnlab.ucdavis.edu/staff/kind/teaching/
Quantification of JEOL XPS Spectra from SpecSurf
 Quantification of JEOL XPS Spectra from SpecSurf The quantification procedure used by the JEOL SpecSurf software involves modifying the Scofield cross-sections to account for both an energy dependency
WindNinja Tutorial 3: Point Initialization
 WindNinja Tutorial 3: Point Initialization 6/27/2018 Introduction Welcome to WindNinja Tutorial 3: Point Initialization. This tutorial will step you through the process of downloading weather station data
Project IV Fourier Series
 Project IV Fourier Series Robert Jerrard Goal of the project To develop understanding of how many terms of a Fourier series are required in order to well-approximate the original function, and of the differences
Ionization Efficiency Calibration Tutorial for the ToF-AMS
 Ionization Efficiency Calibration Tutorial for the ToF-AMS AMS Users Meeting September 17, 2006 Edward Dunlea, University of Colorado Thanks to: Roya, Ann, Pete, Ken, Ingrid, Dara, Qi, Shane, John, Jose,
UPLC Intact MASS Analysis Application Kit
 (Part Number: 176001519) CONTENTS I. INTACT MASS ANALYSIS APPLICATION KIT COMPONENTS II. INSTALLING THE PRE-COLUMN TUBING INTO MASSPREP MICRO DESALTING COLUMN III. CONNECTING THE COLUMN TO LCT PREMIER
How to Make or Plot a Graph or Chart in Excel
 This is a complete video tutorial on How to Make or Plot a Graph or Chart in Excel. To make complex chart like Gantt Chart, you have know the basic principles of making a chart. Though I have used Excel