Mnova Software Tools for Fragment-Based Drug Discovery
|
|
|
- Silvia Shields
- 5 years ago
- Views:
Transcription
1 Mnova Software Tools for Fragment-Based Drug Discovery Chen Peng, PhD, VP of Business Development, US & China Mestrelab Research SL San Diego, CA

2 Agenda Brief intro on fragment-based drug discovery (FBDD) The relevant Mnova software tools for Demo Questions QC and solubility test of library compounds and building the reference spectra database. Pooling of compounds with least peak overlap. Batch analysis of 1D ligand-observed screening spectra. Analysis of 2D chemical shift perturbation spectra.
3 3 Introduction: Fragment-based lead discovery using NMR NMR has been widely used for high-throughput or detailed hit finding and hit validation since mid-1990s Ideally suited for detecting ligand-protein bindings with K d in µmol-mmol range. In-built quality control: structure consistency check, concentration measurement, and binding assessment all from the same sample. Ligand-observed NMR binding spectra: commonly used for primary fragment screening, no labeling needed, no size restriction by receptor, 1 H or 19 F STD (Saturation transfer difference exp.) T1ρ (Relaxation-edited exp.) CPMG (Relaxation-edited exp.) WaterLOGSY (Water-ligand observed via gradient spectroscopy) Protein-observed chemical shift perturbation spectra: Residue-specific info, mapping to binding site on protein, K d measurement, SAR-by-NMR etc. 15 N or 13 C labeled HSQC spectra of protein.
4 4 Large amount of NMR data to process A typical mid-size compound library: compounds 1 H detected experiments: Primary screening: 6-12 fragments with min. peak overlap per sample => samples per library => primary hits in a few days. Confirmation of hits: single compound samples. 19 F detected experiments: high sensitivity (low-µm concen.), simple spectra, large δ 19 F range Mixtures of cmpds per sample => samples per library. 1 H- 15 N or 1 H- 13 C HSQC of target protein One spectrum for each ligand to compare with the reference spectrum. Or 6-10 titration points per ligand for titration analysis. Hundreds or thousands of spectra to process and analyze: a bottleneck.


5 5 Mnova tools for FBDD Library Cmpds & ref spectra Pooling compounds Structures & spectra of fragments MixDesign script STD/T1ρ/wL/ CPMG spectra Batch Verify & qnmr DB Screen Batch processing, QC and solubility tests CSP Titration spec Screening results for all fragments and targets Chemical shift perturbation and K D analysis
6 Quality control and databasing of library compounds 6
, HSQC (21), and a molecule file.mol Each H-1 has the typical Bruker files.")
7 7 NMR and molecular data The example here has a dataset organized shown below. Note your data does not have to be exactly like this. Multiple datasets located under a parent directory spec+mols Each dataset has a H-1 (20), HSQC (21), and a molecule file.mol Each H-1 has the typical Bruker files. We will reprocess using the fid files


8 8 Setup Batch Verify Once you are ready, start Batch Verify by choosing Analysis Verification Batch Verify. The sample data mentioned previously is used as an example here. In the Main tab, setup the NMR and structure files to use and the Results folder etc.

9 9 Setup Batch Verify In the Pre&Post Tab, specify the processing template to use for all the H-1 NMR processing:

10 10 Setup Batch qnmr In the Options Tab, choose to do quantitation (determination of molar concentration using external reference info in this case).

11 11 Setup Batch qnmr In the Options Tab, click qnmr Settings button to define the details for molar concentration determination.

12 12 Run Batch Verify Once the settings are done, click OK to start the batch processing. It process all the spectra, does structure verification and quantitation.
13 13 View results from batch processing Upon completion, the verification results are written to under the specified Results directory. Choose Analysis Verification Verify Viewer, and click the Load button to open the results.dat file. All the results are loaded for visualization: Table View Plate View
14 14 View results In the Verify Viewer, click on any items in the Table or Well-plate View to see the details of the spectrum/molecule. Pay attention to the ones with red/yellow flags. You can re-analyze the results (peak picking, multiplet analysis) and apply Verify or qnmr to revise the results for the current spectrum. Verify results qnmr results

15 15 Build a Ref DB Once you are ready, create a new database to save the spectra and molecules. Choose Database Connect to connect to the DB Server.

16 16 Build Ref Database Typically we add a custom field to hold the compound IDs of each spectrum. Usually a short script is necessary to extract the compound IDs from the NMR filename, Title, or Comment fields and save them to the relevant field(s) in the database.

17 17 Build Ref Database Click the Save to DB button. This will save all the spectra/molecules to the database.

18 18 Build Ref Database Record view of a record in the database:

19 19 Build Ref Database Table view of multiple records in the database:
20 20 Our experience We have done this for several libraries of 1-3K compounds. After some trial and error in setup, each run usually takes 3-4 hours to complete. The tools make it very convenient to browse through the results, focus on the ones with possible problems and make changes as necessary. There are typically ~10-20% of compounds with red flags and the problems are mostly real problems with the compound itself, low solubility, or low-quality spectra. Sometimes Mnova makes mistakes too. The database tools makes much more efficient to manage the data.
21 MixDesign for pooling compounds 21
22 Pool compounds Goal: To optimize the combinations of 6-10 compounds per mixture, so that peaks within region of interest don t overlap, or at least one non-overlapping peak for each spectrum Why? More reliable for subsequent analysis to deconvolute the compounds in the mixtures. Mixture #3 Mixture #2 Mixture #1


23 23 Pool compounds The MixDesign.qs script can pool compounds using the ref spec either saved in a DB or using the raw data. Choose Scripts Run Script to run it.

24 24 Pool compounds If to start with the raw data, a processing template is used to process all the spectra:
25 25 Our experience Example: H spectra/compounds. 6 compounds per mixture. ROI: 9-6 ppm ppm as minimum distance for non-overlapping spectra. Got 263 mixtures in ~40 minutes. 13 of them have one spectrum completely overlapping. The output spreadsheets can be used by Mnova Screen for associating mixture spectra and reference spectra. We continue to improve the script based on users feedback
26 Mnova Screen for ligand binding spectral analysis 26


27 27 Screen: From data to hits Processing template STD/T1ρ/wL spectra Ref. spectra Batch process and group spectra Detect peak intensity change User inspects selected experiments Stack spectra and generate reports Mnova file for each sample Overall results in a spreadsheet
28 28 Data it handles H-1 or F-19 Single compounds or mixtures With or without reference spectra Single or multiple types of spectra (STD, T1rho, WaterLogsy, CPMG) Use of Blank, w/ Protein, & w/ Protein+ Inhibitors Mnova Screen can handle all of them

29 29 Example: Run Screen using a Ref DB 263 STD on/off resonance spectra for a total of 1,578 compounds. Each mixture has 6 compounds. A lookup table for Screen to find the reference spectra for each sample. Database related information. Enter info about your database server, login account, database name, item and field (where to find the compound IDs). IDs of the fragments for each sample/mixture.
30 30 Setup Screen The Processing and Analysis tab: setup for Reference spectra.

31 31 Setup Screen The Processing and Analysis tab: setup for STD spectra.


32 32 Results of Screen Batch processing finished in about 2 hours.


33 Verify the screening results 33
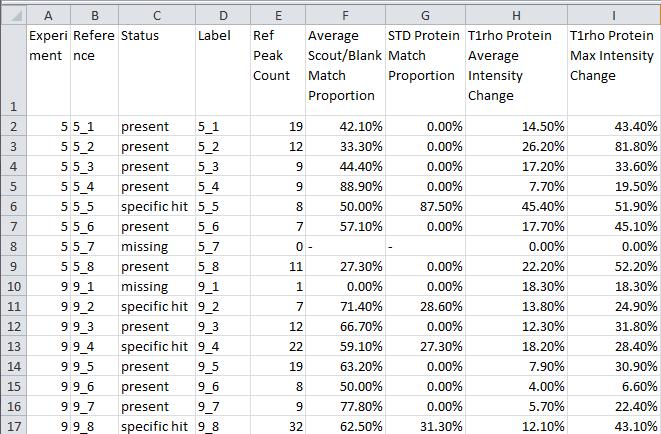
34 34 Determining specific hits from competition experiments Two thresholds are defined by the user: T 1 : minimum intensity decrease for a hit. T 2 : minimum intensity recovery rate for a specific hit. If I 1 > T 1 and R > T 2 : specific hit (see Ex.1 below) If I 1 > T 1 and R T 2 : non-specific hit (see Ex.1 below) Example 1 T 2 = 5% Example 2 I 1 ~ 60% I 2 ~ 25%, R ~ 35% I 1 ~ 60% I 2 ~ 58% R ~ 2% I 1 I 2 I 1 I 2 R R
35 35 Demo of Mnova Screen Two mixtures with 8 compounds each. Using STD difference spectra, and T1rho (short/long-spin lock).
36 36 Our experience Typically it takes about 3-4 hours to complete a screening batch of mixtures. Using database of reference spectra is usually faster. The automated results are comparable with careful manual analysis results but much faster. See results comparison and discussion at C. Peng, A. Frommlet, M. Perez, C. Cobas, A. Blechschmidt, S. Dominguez, and A. Lingel., J. Med. Chem. 2016, 59, The tools that allow you to easily browse through the results, and verify and correct them manually is very convenient. Mnova Screen has been used routinely by > 10 companies.
37 Mnova CSP Chemical shift perturbation analysis 37
38 General workflows Mnova CSP allows you to process and analyze a series CSP spectra fully automatically, or interactively, or both Full automatic processing and analysis starting from 2D raw data to K D s Prepare 3 information files: Titration file, Ligand file, Peaks file; and enter them to CSP. CSP processes all HSQC spectra, stacks them, tracks the peak movements, calculates the CSPs and K D for each peak, and does statistics of all the K D s. Manual analysis You open and stack multiple HSQC spectra interactive. You pick the peaks and let CSP monitor automatically track their shift path across all the spectra. You manually correct the peak tracking as needed. CSP calculates the CSPs and K D for each peak, and does statistics of all the K D s in real time.

39 Chemical shift perturbation (CSP) A reference peak, usually assigned to an amino acid residual in a protein, shifts its location in 1 H/ 15 N (or 1 H/ 13 C) HSQC spectra as the ligand is added. [P]: concentration of protein [L]: concentration of ligand [L]/[P]: ratio of ligand/protein Column Lt/Pt in CSP Panel Ref. peak CSP path Target peak
40 Chemical shift perturbation (CSP) The chemical shift changes along the path from the ref. peak to target peak is measured and normalized: CSP (ppm) = F(H) δ H ) 2 + (F(N) δ N ) 2 or CSP (ppm) = F(H) δ H ) 2 + (F(C) δ C ) 2 By default: F(H) = 1; F(N) = 0.156; F(C) = You can change the values in Settings. δ N δ H CSP

41 Chemical shift perturbation (CSP) The CPS values are plotted against the ratios of ligand/protein concentrations and fit to a titration curve to determine the dissociation constant, K d and the fitting error (σ) according to


42 Statistics of multiple K d Multiple reference peaks can be tracked and K d calculated for each of them. The average K d and standard deviation are automatically computed for them. Tip: Un-check the peaks that you don t want to be used for the statistics analysis. The results will be automatically updated.

. Click OK to start the auto processing.")
43 Fully automatic processing and analysis Choose Advanced > Chemical Shift Perturbation to open the CSP Panel. Click Open and enter the relevant info files and Base directory (where the 2D HSQC spectra are located). Click OK to start the auto processing. Titration file Ligand file Peaks file There are 17 2D 1 H/ 15 N HSQC spectra in the Base directory. They are used based on the info in the Titration file

44 Batch processing for multiple ligands If you put multiple ligands in the Titration file, then they will be processed and saved as multiple Mnova documents. Use the Document Menu to switch between the documents for details. Titration file Spectra and concentrations for Ligand #1 Spectra and concentrations for Ligand #2 Ligand file Labels for all ligands
45 Manual editing a peak path From the Peaks Tab in CSP Panel, double click on a row to switch to display its details and zoom to that peak path in the spectra. Click on any peak top and drag to change the peak path. The CSP and Kd results are updated automatically. Click and drag a peak top to change the peak path

46 Which reference peaks to track? You can enter the peaks in 3 ways: Select peak: click to select reference peaks in the stacked plot. Import spectrum peaks: do auto or manual peak picking in the reference spectrum first, and use those as the reference peaks. Import peak list: Use peaks in a peak assignment table as reference peaks. Mnova CSP automatically track peaks across the titration spectra, and you can manual correct the peak paths if necessary.

47 More complex binding models? We collaborate with AffiniMeter Inc. for ligand-protein binding studies. The CSP results can be sent to the AffiniMeter for further analysis. See for more details.
48 48 Demo of Mnova CSP H-N HSQC titration spectra, 8 points for each ligand. Two ligands.
49 Conclusions 49
50 50 Powerful software tools seamlessly integrated by Mnova DB Structures & spectra of fragments Library Cmpds & ref spectra Pooling compounds MixDesign script STD/T1ρ/wL/ CPMG spectra Efficient software tools for processing, analysis and management of NMR data from almost every stage of FBDD: Batch Verify & qnmr Batch processing, QC and solubility tests DB CSP Screen Titration spec library compounds QC, solubility test, and database management. Pooling fragments. Data processing for and screening results. Titration spectra analysis. Screening results for all fragments and targets Chemical shift perturbation and K D analysis Datamining of screening results in progress.
51 51 They can also work independently & without a database Structures & spectra of fragments Batch Verify & Batch qnmr Identity verification and solubility test results Flexible: use tools when you need. MixDesign script list of mixtures with least peak overlap Processing and peak picking reference spectra at each run - Not an efficient way to manage and reuse your reference spectra. STD/T1ρ/wL/ CPMG spectra Screen Primary hits Results saved as flat files - not efficient for info management and data mining. HSQC Titration spectra CSP K D of monitored peaks
52 Acknowledgement Our collaborators Pfizer (La Jolla): Jiangli Yan and Wei Wang Novartis (Cambridge): Xiaolu Zhang and Jasna Fejzo Novartis (Emeryville): Andreas Lingel and Alexandra Frommlet Abbvie: Andrew Petros and Andrew Namanja Developers and product managers at Mestrelab Research Chen Peng, Manuel Perez, and Silvia Mari Agustin Barba and Jose Garcia Carlos Cobas, Stan Sykora, Santi Dominguez Thank you for attending the webinar! Questions?
Using MnovaScreen to Process, Analyze and Report Ligand-Protein Binding Spectra for Fragment-based Lead Design
 September 2014 Using MnovaScreen to Process, Analyze and Report Ligand-Protein Binding Spectra for Fragment-based Lead Design Dr Manuel Perez Senior VP - Mestrelab 1996: A research project in University
Implementation of novel tools to facilitate fragment-based drug discovery by NMR:
 Implementation of novel tools to facilitate fragment-based drug discovery by NMR: Automated analysis of large sets of ligand-observed NMR binding data and 19 F methods Andreas Lingel Global Discovery Chemistry
Mnova Software for Analyzing Reaction Monitoring NMR Spectra
 Mnova Software for Analyzing Reaction Monitoring NMR Spectra Version 10 Chen Peng, PhD, VP of Business Development, US & China Mestrelab Research SL San Diego, CA, USA chen.peng@mestrelab.com 858.736.4563
NMR Solutions for drug discovery
 NMR Solutions for drug discovery Dr. Matteo Pennestri London, UK Bruker Users Meeting Innovation with Integrity The principle of Fragment Based Screening from efficient fragments to Drug candidates Fragment
Application Note 12: Fully Automated Compound Screening and Verification Using Spinsolve and MestReNova
 Application Note : Fully Automated Compound Screening and Verification Using Spinsolve and MestReNova Paul Bowyer, Magritek, Inc. and Mark Dixon, Mestrelab Sample screening to verify the identity or integrity
Fragment-based drug discovery
 Fragment-based drug discovery Dr. Till Kühn VP Applications Development MRS, Bruker BioSpion User s meeting, Brussels, November 2016 Innovation with Integrity The principle of Fragment Based Screening
ProMass Deconvolution User Training. Novatia LLC January, 2013
 ProMass Deconvolution User Training Novatia LLC January, 2013 Overview General info about ProMass Features Basics of how ProMass Deconvolution works Example Spectra Manual Deconvolution with ProMass Deconvolution
Tutorial. Getting started. Sample to Insight. March 31, 2016
 Getting started March 31, 2016 Sample to Insight CLC bio, a QIAGEN Company Silkeborgvej 2 Prismet 8000 Aarhus C Denmark Telephone: +45 70 22 32 44 www.clcbio.com support-clcbio@qiagen.com Getting started
Login -the operator screen should be in view when you first sit down at the spectrometer console:
 Lab #2 1D 1 H Double Resonance (Selective Decoupling) operation of the 400 MHz instrument using automated sample insertion (robot) and automated locking and shimming collection of 1D 1 H spectra retrieving
Dock Ligands from a 2D Molecule Sketch
 Dock Ligands from a 2D Molecule Sketch March 31, 2016 Sample to Insight CLC bio, a QIAGEN Company Silkeborgvej 2 Prismet 8000 Aarhus C Denmark Telephone: +45 70 22 32 44 www.clcbio.com support-clcbio@qiagen.com
Agilent MassHunter Quantitative Data Analysis
 Agilent MassHunter Quantitative Data Analysis Presenters: Howard Sanford Stephen Harnos MassHunter Quantitation: Batch and Method Setup Outliers, Data Review, Reporting 1 MassHunter Quantitative Analysis
MassHunter Software Overview
 MassHunter Software Overview 1 Qualitative Analysis Workflows Workflows in Qualitative Analysis allow the user to only see and work with the areas and dialog boxes they need for their specific tasks A
ICM-Chemist-Pro How-To Guide. Version 3.6-1h Last Updated 12/29/2009
 ICM-Chemist-Pro How-To Guide Version 3.6-1h Last Updated 12/29/2009 ICM-Chemist-Pro ICM 3D LIGAND EDITOR: SETUP 1. Read in a ligand molecule or PDB file. How to setup the ligand in the ICM 3D Ligand Editor.
Using a GIS to Calculate Area of Occupancy. Part 1: Creating a Shapefile Grid
 Using a GIS to Calculate Area of Occupancy Part 1: Creating a Shapefile Grid By Ryan Elliott California Natural Diversity Database, A NatureServe network program December 2008 This document describes the
Intelligent NMR productivity tools
 Intelligent NMR productivity tools Till Kühn VP Applications Development Pittsburgh April 2016 Innovation with Integrity A week in the life of Brian Brian Works in a hypothetical pharma company / university
This tutorial is intended to familiarize you with the Geomatica Toolbar and describe the basics of viewing data using Geomatica Focus.
 PCI GEOMATICS GEOMATICA QUICKSTART 1. Introduction This tutorial is intended to familiarize you with the Geomatica Toolbar and describe the basics of viewing data using Geomatica Focus. All data used in
La RMN quantitative appliquée aux petites molécules
 La RMN quantitative appliquée aux petites molécules Fabrice Moriaud - Applications Development - Fällanden 30ème Réunion d Utilisateurs RMN Bruker December 9, 2016 1 Covered in this presentation Quantification
protein interaction analysis bulletin 6300
 protein interaction analysis bulletin 6300 Guide to SPR Data Analysis on the ProteOn XPR36 System Ruben Luo, Bio-Rad Laboratories, Inc., 2000 Alfred Nobel Drive, Hercules, CA 94547 Kinetic Analysis To
Preparing a PDB File
 Figure 1: Schematic view of the ligand-binding domain from the vitamin D receptor (PDB file 1IE9). The crystallographic waters are shown as small spheres and the bound ligand is shown as a CPK model. HO
Introduction to Structure Preparation and Visualization
 Introduction to Structure Preparation and Visualization Created with: Release 2018-4 Prerequisites: Release 2018-2 or higher Access to the internet Categories: Molecular Visualization, Structure-Based
MassHunter TOF/QTOF Users Meeting
 MassHunter TOF/QTOF Users Meeting 1 Qualitative Analysis Workflows Workflows in Qualitative Analysis allow the user to only see and work with the areas and dialog boxes they need for their specific tasks
Technical Procedure for Glass Refractive Index Measurement System 3 (GRIM 3)
") Technical Procedure for Glass Refractive Index Measurement System 3 (GRIM 3) 1.0 Purpose - This technical procedure shall be followed for the operation of the GRIM 3. 2.0 Scope - This procedure applies
Technical Procedure for Glass Refractive Index Measurement System 3 (GRIM 3) 1.0 Purpose - This technical procedure shall be followed for the operation of the GRIM 3. 2.0 Scope - This procedure applies
You w i ll f ol l ow these st eps : Before opening files, the S c e n e panel is active.
 You w i ll f ol l ow these st eps : A. O pen a n i m a g e s t a c k. B. Tr a c e t h e d e n d r i t e w i t h t h e user-guided m ode. C. D e t e c t t h e s p i n e s a u t o m a t i c a l l y. D. C
Handling Human Interpreted Analytical Data. Workflows for Pharmaceutical R&D. Presented by Peter Russell
 Handling Human Interpreted Analytical Data Workflows for Pharmaceutical R&D Presented by Peter Russell 2011 Survey 88% of R&D organizations lack adequate systems to automatically collect data for reporting,
Chemistry Department
 Chemistry Department NMR/Instrumentation Facility Users Guide - VNMRJ Prepared by Leila Maurmann The following procedures should be used to acquire one-dimensional proton and carbon NMR data on the 400MHz
Introduction to Spark
 1 As you become familiar or continue to explore the Cresset technology and software applications, we encourage you to look through the user manual. This is accessible from the Help menu. However, don t
for XPS surface analysis
 Thermo Scientific Avantage XPS Software Powerful instrument operation and data processing for XPS surface analysis Avantage Software Atomic Concentration (%) 100 The premier software for surface analysis
2D NMR: HMBC Assignments and Publishing NMR Data Using MNova
 Homework 10 Chem 636, Fall 2014 due at the beginning of lab Nov 18-20 updated 10 Nov 2014 (cgf) 2D NMR: HMBC Assignments and Publishing NMR Data Using MNova Use Artemis (Av-400) or Callisto (Av-500) for
Ligand Scout Tutorials
 Ligand Scout Tutorials Step : Creating a pharmacophore from a protein-ligand complex. Type ke6 in the upper right area of the screen and press the button Download *+. The protein will be downloaded and
OECD QSAR Toolbox v.4.1. Tutorial illustrating new options for grouping with metabolism
 OECD QSAR Toolbox v.4.1 Tutorial illustrating new options for grouping with metabolism Outlook Background Objectives Specific Aims The exercise Workflow 2 Background Grouping with metabolism is a procedure
Agilent MassHunter Quantitative Data Analysis
 Agilent MassHunter Quantitative Data Analysis Presenters: Howard Sanford Stephen Harnos MassHunter Quantitation: Batch Table, Compound Information Setup, Calibration Curve and Globals Settings 1 MassHunter
Athena Visual Software, Inc. 1
 Athena Visual Studio Visual Kinetics Tutorial VisualKinetics is an integrated tool within the Athena Visual Studio software environment, which allows scientists and engineers to simulate the dynamic behavior
Building Inflation Tables and CER Libraries
 Building Inflation Tables and CER Libraries January 2007 Presented by James K. Johnson Tecolote Research, Inc. Copyright Tecolote Research, Inc. September 2006 Abstract Building Inflation Tables and CER
Creating Empirical Calibrations
 030.0023.01.0 Spreadsheet Manual Save Date: December 1, 2010 Table of Contents 1. Overview... 3 2. Enable S1 Calibration Macro... 4 3. Getting Ready... 4 4. Measuring the New Sample... 5 5. Adding New
FRAGMENT SCREENING IN LEAD DISCOVERY BY WEAK AFFINITY CHROMATOGRAPHY (WAC )
") FRAGMENT SCREENING IN LEAD DISCOVERY BY WEAK AFFINITY CHROMATOGRAPHY (WAC ) SARomics Biostructures AB & Red Glead Discovery AB Medicon Village, Lund, Sweden Fragment-based lead discovery The basic idea:
FRAGMENT SCREENING IN LEAD DISCOVERY BY WEAK AFFINITY CHROMATOGRAPHY (WAC ) SARomics Biostructures AB & Red Glead Discovery AB Medicon Village, Lund, Sweden Fragment-based lead discovery The basic idea:
NMR Data workup using NUTS
 omework 1 Chem 636, Fall 2008 due at the beginning of the 2 nd week lab (week of Sept 9) NMR Data workup using NUTS This laboratory and homework introduces the basic processing of one dimensional NMR data
MAGNETITE OXIDATION EXAMPLE
 HSC Chemistry 7.0 1 MAGNETITE OXIDATION EXAMPLE Pelletized magnetite (Fe 3 O 4 ) ore may be oxidized to hematite (Fe 2 O 3 ) in shaft furnace. Typical magnetite content in ore is some 95%. Oxidation is
v Prerequisite Tutorials GSSHA WMS Basics Watershed Delineation using DEMs and 2D Grid Generation Time minutes
 v. 10.1 WMS 10.1 Tutorial GSSHA WMS Basics Creating Feature Objects and Mapping Attributes to the 2D Grid Populate hydrologic parameters in a GSSHA model using land use and soil data Objectives This tutorial
 NanoDrop One Viewer software NanoDrop One Website. NanoDrop One Website NanoDrop One Viewer software NanoDrop One Website Software System Update Update Update Software, Update Note OK Language Measure
The OptiSage module. Use the OptiSage module for the assessment of Gibbs energy data. Table of contents
 The module Use the module for the assessment of Gibbs energy data. Various types of experimental data can be utilized in order to generate optimized parameters for the Gibbs energies of stoichiometric
NMR Predictor. Introduction
 NMR Predictor This manual gives a walk-through on how to use the NMR Predictor: Introduction NMR Predictor QuickHelp NMR Predictor Overview Chemical features GUI features Usage Menu system File menu Edit
TOP MARKET SURVEY INSTRUCTION SHEET. Requirements. Overview
 INSTRUCTION SHEET TOP SURVEY TOP SURVEY INSTRUCTION SHEET Overview For nearly 40 years, the ACA has surveyed member agencies and conducted the Top Collection Market Survey. This survey provides critical
Cerno Application Note Extending the Limits of Mass Spectrometry
 Creation of Accurate Mass Library for NIST Database Search Novel MS calibration has been shown to enable accurate mass and elemental composition determination on quadrupole GC/MS systems for either molecular
Performing Map Cartography. using Esri Production Mapping
 AGENDA Performing Map Cartography Presentation Title using Esri Production Mapping Name of Speaker Company Name Kannan Jayaraman Agenda Introduction What s New in ArcGIS 10.1 ESRI Production Mapping Mapping
Implementing ACD/Automation Server Processing with Micro Flow-Injection and Open-Access NMR
 Implementing ACD/Automation Server Processing with Micro Flow-Injection and Open-Access NMR Steve Hollis Amgen Inc. Cambridge, MA March 23, 2014 1 Overview Amgen has been using ACD/Labs software as the
Application Note LCMS-112 A Fully Automated Two-Step Procedure for Quality Control of Synthetic Peptides
 Application Note LCMS-112 A Fully Automated Two-Step Procedure for Quality Control of Synthetic Peptides Abstract Here we describe a two-step QC procedure for synthetic peptides. In the first step, the
Determining C-H Connectivity: ghmqc and ghmbc (VnmrJ-2.2D Version: For use with the new Software)
") Determining C-H Connectivity: ghmqc and ghmbc (VnmrJ-2.2D Version: For use with the new Software) Heteronuclear Multiple Quantum Coherence (HMQC) and Heteronuclear Multiple Bond Coherence (HMBC) are 2-dimensional
Determining C-H Connectivity: ghmqc and ghmbc (VnmrJ-2.2D Version: For use with the new Software) Heteronuclear Multiple Quantum Coherence (HMQC) and Heteronuclear Multiple Bond Coherence (HMBC) are 2-dimensional
Produktivitätswerkzeuge für die NMR
 Produktivitätswerkzeuge für die NMR Till Kühn VP Applications Development Benutzertagung Karlsruhe November 2016 Innovation with Integrity A week in the life of Brian Brian Works in a hypothetical pharma
Tutorials on Library Design E. Lounkine and J. Bajorath (University of Bonn) C. Muller and A. Varnek (University of Strasbourg)
 C. Muller and A. Varnek (University of Strasbourg)") Tutorials on Library Design E. Lounkine and J. Bajorath (University of Bonn) C. Muller and A. Varnek (University of Strasbourg) The purpose of this tutorial is to generate a library of potential inhibitors
Tutorials on Library Design E. Lounkine and J. Bajorath (University of Bonn) C. Muller and A. Varnek (University of Strasbourg) The purpose of this tutorial is to generate a library of potential inhibitors
LineShapeKin NMR Line Shape Analysis Software for Studies of Protein-Ligand Interaction Kinetics
 LineShapeKin NMR Line Shape Analysis Software for Studies of Protein-Ligand Interaction Kinetics http://lineshapekin.net Spectral intensity Evgenii L. Kovrigin Department of Biochemistry, Medical College
Skyline Small Molecule Targets
 Skyline Small Molecule Targets The Skyline Targeted Proteomics Environment provides informative visual displays of the raw mass spectrometer data you import into your Skyline documents. Originally developed
North Carolina State University Department of Chemistry Varian NMR Training Manual
 North Carolina State University Department of Chemistry Varian NMR Training Manual by J.B. Clark IV & Dr. S. Sankar 1 st Edition 05/15/2009 Section 3: Glide Program Operations for Advanced 1D & 2D Spectra
Advanced Forecast. For MAX TM. Users Manual
 Advanced Forecast For MAX TM Users Manual www.maxtoolkit.com Revised: June 24, 2014 Contents Purpose:... 3 Installation... 3 Requirements:... 3 Installer:... 3 Setup: spreadsheet... 4 Setup: External Forecast
Tutorial 2: Analysis of DIA data in Skyline
 Tutorial 2: Analysis of DIA data in Skyline In this tutorial we will learn how to use Skyline to perform targeted post-acquisition analysis for peptide and inferred protein detection and quantitation using
ICM-Chemist How-To Guide. Version 3.6-1g Last Updated 12/01/2009
 ICM-Chemist How-To Guide Version 3.6-1g Last Updated 12/01/2009 ICM-Chemist HOW TO IMPORT, SKETCH AND EDIT CHEMICALS How to access the ICM Molecular Editor. 1. Click here 2. Start sketching How to sketch
SeeSAR 7.1 Beginners Guide. June 2017
 SeeSAR 7.1 Beginners Guide June 2017 Part 1: Basics 1 Type a pdb code and press return or Load your own protein or already existing project, or Just load molecules To begin, let s type 2zff and download
Automated, High- Throughput Data Processing & Quantification: Illustrated by a series of Non-Steroidal Anti-Inflammatory Drugs (NSAIDs)
") Automated, High- Throughput Data Processing & Quantification: Illustrated by a series of Non-Steroidal Anti-Inflammatory Drugs (NSAIDs) Automatic Data Processing Mnova offers a number of listeners that
Automated, High- Throughput Data Processing & Quantification: Illustrated by a series of Non-Steroidal Anti-Inflammatory Drugs (NSAIDs) Automatic Data Processing Mnova offers a number of listeners that
Automatic Watershed Delineation using ArcSWAT/Arc GIS
 Automatic Watershed Delineation using ArcSWAT/Arc GIS By: - Endager G. and Yalelet.F 1. Watershed Delineation This tool allows the user to delineate sub watersheds based on an automatic procedure using
OECD QSAR Toolbox v.4.1. Tutorial of how to use Automated workflow for ecotoxicological prediction
 OECD QSAR Toolbox v.4.1 Tutorial of how to use Automated workflow for ecotoxicological prediction Outlook Aim Automated workflow The exercise Report The OECD QSAR Toolbox for Grouping Chemicals into Categories
Supporting Information. Labeled Ligand Displacement: Extending NMR-based Screening of Protein Targets
 Supporting Information Labeled Ligand Displacement: Extending NMR-based Screening of Protein Targets Steven L. Swann, Danying Song, Chaohong Sun, Philip J. Hajduk, and Andrew M. Petros Global Pharmaceutical
Operation of the Bruker 400 JB Stothers NMR Facility Department of Chemistry Western University
 Operation of the Bruker 400 JB Stothers NMR Facility Department of Chemistry Western University 1. INTRODUCTION...3 1.1. Overview of the Bruker 400 NMR Spectrometer...3 1.2. Overview of Software... 3 1.2.1.
Docking with Water in the Binding Site using GOLD
 Docking with Water in the Binding Site using GOLD Version 2.0 November 2017 GOLD v5.6 Table of Contents Docking with Water in the Binding Site... 2 Case Study... 3 Introduction... 3 Provided Input Files...
OECD QSAR Toolbox v.4.1. Step-by-step example for building QSAR model
 OECD QSAR Toolbox v.4.1 Step-by-step example for building QSAR model Background Objectives The exercise Workflow of the exercise Outlook 2 Background This is a step-by-step presentation designed to take
ST-Links. SpatialKit. Version 3.0.x. For ArcMap. ArcMap Extension for Directly Connecting to Spatial Databases. ST-Links Corporation.
 ST-Links SpatialKit For ArcMap Version 3.0.x ArcMap Extension for Directly Connecting to Spatial Databases ST-Links Corporation www.st-links.com 2012 Contents Introduction... 3 Installation... 3 Database
Molecular Modeling and Conformational Analysis with PC Spartan
 Molecular Modeling and Conformational Analysis with PC Spartan Introduction Molecular modeling can be done in a variety of ways, from using simple hand-held models to doing sophisticated calculations on
Become a Microprobe Power User Part 2: Qualitative & Quantitative Analysis
 Become a Microprobe Power User Part 2: Qualitative & Quantitative Analysis Mike Spilde Spring IOM Seminar February 5, 2008 Qualitative Analysis Why use qualitative scans? Elemental ID (especially trace
Pulsar. Delivering NMR to your benchtop
 Pulsar NMR Delivering NMR to your benchtop Pulsar TM NMR for your laboratory The Pulsar TM NMR spectrometer from Oxford Instruments delivers affordable, high performance NMR spectroscopy into the laboratory
Agilent s new solution for obtaining routinely quantitative results from NMR measurements. Magnetic Resonance Systems
 Agilent s new solution for obtaining routinely quantitative results from NMR measurements. 1 Magnetic Resonance Systems The Scope of Analytical Chemistry Analytical Chemistry is the study of the separation,
Quantification of JEOL XPS Spectra from SpecSurf
 Quantification of JEOL XPS Spectra from SpecSurf The quantification procedure used by the JEOL SpecSurf software involves modifying the Scofield cross-sections to account for both an energy dependency
WindNinja Tutorial 3: Point Initialization
 WindNinja Tutorial 3: Point Initialization 6/27/2018 Introduction Welcome to WindNinja Tutorial 3: Point Initialization. This tutorial will step you through the process of downloading weather station data
Last updated: Copyright
 Last updated: 2012-08-20 Copyright 2004-2012 plabel (v2.4) User s Manual by Bioinformatics Group, Institute of Computing Technology, Chinese Academy of Sciences Tel: 86-10-62601016 Email: zhangkun01@ict.ac.cn,
GAS CHROMATOGRAPHY MASS SPECTROMETRY. Pre-Lab Questions
 GAS CHROMATOGRAPHY MASS SPECTROMETRY Pre-Lab Questions Questions to be answered before doing the experiment. The answers are due at the beginning of each experiment without exception (the questions are
OECD QSAR Toolbox v.3.3. Step-by-step example of how to build a userdefined
 OECD QSAR Toolbox v.3.3 Step-by-step example of how to build a userdefined QSAR Background Objectives The exercise Workflow of the exercise Outlook 2 Background This is a step-by-step presentation designed
Building small molecules
 Building small molecules Use the Builder (right panel) to build up molecules. Start building clicking a fragment/atom in the builder and it will appear to the workspace. Continue modifying the molecule
ON SITE SYSTEMS Chemical Safety Assistant
 ON SITE SYSTEMS Chemical Safety Assistant CS ASSISTANT WEB USERS MANUAL On Site Systems 23 N. Gore Ave. Suite 200 St. Louis, MO 63119 Phone 314-963-9934 Fax 314-963-9281 Table of Contents INTRODUCTION
Searching Substances in Reaxys
 Searching Substances in Reaxys Learning Objectives Understand that substances in Reaxys have different sources (e.g., Reaxys, PubChem) and can be found in Document, Reaction and Substance Records Recognize
Downloading GPS Waypoints
 Downloading Data with DNR- GPS & Importing to ArcMap and Google Earth Written by Patrick Florance & Carolyn Talmadge, updated on 4/10/17 DOWNLOADING GPS WAYPOINTS... 1 VIEWING YOUR POINTS IN GOOGLE EARTH...
Standards-Based Quantification in DTSA-II Part II
 Standards-Based Quantification in DTSA-II Part II Nicholas W.M. Ritchie National Institute of Standards and Technology, Gaithersburg, MD 20899-8371 nicholas.ritchie@nist.gov Introduction This article is
QuantumMCA QuantumNaI QuantumGe QuantumGold
 QuantumMCA QuantumNaI QuantumGe QuantumGold Berkeley Nucleonics Corporation (San Rafael, CA) and Princeton Gamma Tech (Princeton, NJ) have partnered to offer gamma spectroscopy with either germanium or
M E R C E R W I N WA L K T H R O U G H
 H E A L T H W E A L T H C A R E E R WA L K T H R O U G H C L I E N T S O L U T I O N S T E A M T A B L E O F C O N T E N T 1. Login to the Tool 2 2. Published reports... 7 3. Select Results Criteria...
How to Make or Plot a Graph or Chart in Excel
 This is a complete video tutorial on How to Make or Plot a Graph or Chart in Excel. To make complex chart like Gantt Chart, you have know the basic principles of making a chart. Though I have used Excel
Simulating Future Climate Change Using A Global Climate Model
 Simulating Future Climate Change Using A Global Climate Model Introduction: (EzGCM: Web-based Version) The objective of this abridged EzGCM exercise is for you to become familiar with the steps involved
WALKUP LC/MS FOR PHARMACEUTICAL R&D
 Pharmaceutical Workflow Solutions WALKUP LC/MS FOR PHARMACEUTICAL R&D Chemists, Peptide/Protein Chemists, Biologists, and Beyond MASSHUNTER WALKUP A Single User Interface for Robust and Reliable LC/MS
Watershed Modeling Orange County Hydrology Using GIS Data
 v. 10.0 WMS 10.0 Tutorial Watershed Modeling Orange County Hydrology Using GIS Data Learn how to delineate sub-basins and compute soil losses for Orange County (California) hydrologic modeling Objectives
WMS 9.0 Tutorial GSSHA Modeling Basics Infiltration Learn how to add infiltration to your GSSHA model
 v. 9.0 WMS 9.0 Tutorial GSSHA Modeling Basics Infiltration Learn how to add infiltration to your GSSHA model Objectives This workshop builds on the model developed in the previous workshop and shows you
Predictor Assay Setup Guide on the BMG LABTECH CLARIOstar Microplate Readers
 Page 1 of 18 Predictor Assay Setup Guide on the BMG LABTECH CLARIOstar Microplate Readers The BMG LABTECH CLARIOstar Microplate Readers were tested for compatibility with Life Technologies' Predictor herg
AlphaVision-5.3. Integrated, Ethernetconnected. spectrometers. 32-bit software for Windows 2000 and XP Professional ORTEC
 AlphaVision-5.3 Integrated, Ethernetconnected alpha spectrometers 32-bit software for Windows 2000 and XP Professional Alpha Vision 5.3 What makes us the best???? We are the cutting edge!!!! Introduction
ITC Expert User s Manual
 ITC Expert User s Manual 1 Section 1: ITC Expert Background... 3 Minimal Heats and Injections... 3 C Parameter... 3 C Limitations... 4 High C... 4 Low C... 6 Concentrations Ratio... 6 Section 2: ITC Expert
Using SkyTools to log Texas 45 list objects
 Houston Astronomical Society Using SkyTools to log Texas 45 list objects You can use SkyTools to keep track of objects observed in Columbus and copy the output into the Texas 45 observation log. Preliminary
BIOLIGHT STUDIO IN ROUTINE UV/VIS SPECTROSCOPY
 BIOLIGHT STUDIO IN ROUTINE UV/VIS SPECTROSCOPY UV/Vis Spectroscopy is a technique that is widely used to characterize, identify and quantify chemical compounds in all fields of analytical chemistry. The
ACD/Labs Software Impurity Resolution Management. Presented by Peter Russell
 ACD/Labs Software Impurity Resolution Management Presented by Peter Russell Impurity Resolution Process Chemists Method Development Specialists Toxicology Groups Stability Groups Analytical Chemists 7/8/2016
1. Prepare the MALDI sample plate by spotting an angiotensin standard and the test sample(s).
.") Analysis of a Peptide Sequence from a Proteolytic Digest by MALDI-TOF Post-Source Decay (PSD) and Collision-Induced Dissociation (CID) Standard Operating Procedure Purpose: The following procedure may
Analysis of a Peptide Sequence from a Proteolytic Digest by MALDI-TOF Post-Source Decay (PSD) and Collision-Induced Dissociation (CID) Standard Operating Procedure Purpose: The following procedure may
Calculating Bond Enthalpies of the Hydrides
 Proposed Exercise for the General Chemistry Section of the Teaching with Cache Workbook: Calculating Bond Enthalpies of the Hydrides Contributed by James Foresman, Rachel Fogle, and Jeremy Beck, York College
Tutorial 1: Setting up your Skyline document
 Tutorial 1: Setting up your Skyline document Caution! For using Skyline the number formats of your computer have to be set to English (United States). Open the Control Panel Clock, Language, and Region
Lightcloud Application
 Controlling Your Lightcloud System Lightcloud Application Lightcloud Application Navigating the Application Devices Device Settings Organize Control Energy Scenes Schedules Demand Response Power Up State
Fragment-Based Drug Discovery (FBDD) Using the dispr Technique on Pioneer Systems with OneStep and NeXtStep Injection Methodologies
 Using the dispr Technique on Pioneer Systems with OneStep and NeXtStep Injection Methodologies") APPLICATION NOTE 21 Fragment-Based Drug Discovery (FBDD) Using the dispr Technique on Pioneer Systems with OneStep and NeXtStep Injection Methodologies Eric L. Reese, Ph.D, SensiQ Technologies, Aaron Martin
APPLICATION NOTE 21 Fragment-Based Drug Discovery (FBDD) Using the dispr Technique on Pioneer Systems with OneStep and NeXtStep Injection Methodologies Eric L. Reese, Ph.D, SensiQ Technologies, Aaron Martin
SRM assay generation and data analysis in Skyline
 in Skyline Preparation 1. Download the example data from www.srmcourse.ch/eupa.html (3 raw files, 1 csv file, 1 sptxt file). 2. The number formats of your computer have to be set to English (United States).
Quick Reference Manual. Ver. 1.3
 Quick Reference Manual Ver. 1.3 1 EXASITE Voyage EXSITE Voyage is a web-based communication tool designed to support the following users; Ship operators who utilize Optimum Ship Routing (OSR) service in
All Ions MS/MS: Targeted Screening and Quantitation Using Agilent TOF and Q-TOF LC/MS Systems
 All Ions MS/MS: Targeted Screening and Quantitation Using Agilent TOF and Q-TOF LC/MS Systems Technical Overview Introduction All Ions MS/MS is a technique that is available for Agilent high resolution
Chem 1 Kinetics. Objectives. Concepts
 Chem 1 Kinetics Objectives 1. Learn some basic ideas in chemical kinetics. 2. Understand how the computer visualizations can be used to benefit the learning process. 3. Understand how the computer models