Building Inflation Tables and CER Libraries
|
|
|
- Joseph Barton
- 5 years ago
- Views:
Transcription


1 Building Inflation Tables and CER Libraries January 2007 Presented by James K. Johnson Tecolote Research, Inc. Copyright Tecolote Research, Inc. September 2006
2 Abstract Building Inflation Tables and CER Libraries Presenter: James K. Johnson The ACEIT Librarian is a new tool in ACEIT 7.0 that combines the Automated Information Manager (AIM) which is used to create CERs, and the Inflation Editor which is used to build custom inflation indices. Now users can easily work with Cost Estimating Relationship (CER) libraries and Inflation Tables inside a single utility. The Librarian makes it possible for users to have CER libraries and Inflation Tables customized for their particular use. All CER libraries and Inflation Tables can then be easily distributed to other users. This session will demonstrate how to Create a Custom Inflation Table, Create a Custom Appropriation, Create a New CER Library, Create a New CER, and Use/Share Custom Libraries.

3 Outline Introduction to Librarian Creating Custom Inflation Table Creating Custom Appropriation Creating a new CER Library Adding a CER to the Library Using and Sharing Custom Libraries
4 Introduction to Librarian

5 Introducing ACEIT Librarian Combination of: ACEIT Information Manager (AIM) Create CERs ACEIT Inflation Editor Create Inflation Indices Efficient: Single utility to manipulate Inflation and Methodology Libraries Productive: Allows for sharing of custom libraries between users Versatile: Provides for customization of all types of libraries

6 Launching the Librarian Start > Programs > ACEIT 7.0 > ACEIT Tools > Librarian Opens to a main screen for viewing System and Custom libraries Methodology (CER) Libraries Inflation Libraries
7 Explorer View Navigating the Librarian Left hand pane, similar to MS Outlook Navigate to desired library Library View Center pane, displays data in the selected library Displays information associated with the selected library (Methodology or Inflation) Task View Right pane, quick access to common tasks
8 Creating Custom Inflation Table
9 Glossary/Definitions Inflation Measures the change in price from one year to another Indices Two Types: Compound and Composite (also called Raw and Weighted) Allow for normalization of costs to a constant year Raw Inflation Rate - % change in value of money from year 1 to year 2, etc. Outlay Rates (also called Expenditure Profiles) represent the proportion of program dollars that will be spent in each year Compound (Raw) Indices Calculated using the Raw inflation rate. Used to normalize costs from a particular base year to another year Composite (Weighted) Indices Calculated using Compound (Raw) indices and outlay rates (expenditure profile). Used to convert base year dollars to then-year (budget) dollars, or to compute funding requirements
10 Creating an Inflation Index Five Steps to Create an Inflation Index Step 1: Define the set of goods and services, or overall collection of items (Table). For example, US Consumer Electronics Step 2: Define the specific elements (appropriations) within the collection. For example, TV, Stereo, Computer Step 3: Collect historical and/or projection pricing data for the identified elements Step 4: Calculate the yearly overall inflation rate for the entire collection Weighted average of the elements Step 5: Assign a base year, value = 1.0 Results: Compound (Raw) Inflation Indices
 and its associated indices You can add new appropriations and their associated indices to the existing table or create a new table to store this data Custom Tables may")
11 Creating a Custom Inflation Table Custom Inflation Tables and/or Appropriations can be added into the Custom Library By default, the Librarian contains one custom inflation table (Sample Table) with one appropriation (1234) and its associated indices You can add new appropriations and their associated indices to the existing table or create a new table to store this data Custom Tables may contain multiple appropriations Step 1: Navigate to the Inflation Library Step 2: Click on New Table icon ( ) or select Edit > New Inflation Table Step 3: Enter table information in the resulting dialog

12 Creating a New Appropriation Step 1: Navigate to the desired custom Inflation Table Step 2: Click on the New Appropriation icon ( ), or select Edit > New Appropriation from the menu Step 3: Enter information about the indices Raw/Weighted Yearly Escalation and Outlay rates (Librarian calculates resulting raw/weighted indices)

13 Enter Inflation Indices Directly Step 4: Enter indices manually or paste indices from Excel or another spreadsheet White area indicates data input. Grey area indicates calculated fields Step 5: Close the dialog with File > Close or red X The new index is now available for use within ACE
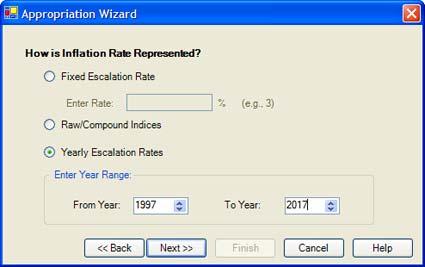
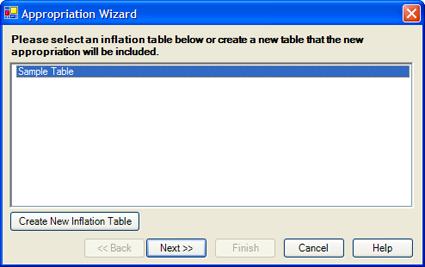
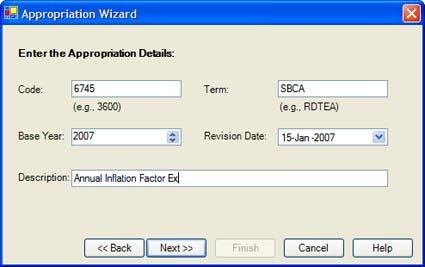
14 Using the Appropriation Wizard Step 1 Step 2 Step 3 Step 4

15 Step 5 Input Specify % for each year Compound (Raw) and Composite (Weighted) are calculated for you by Librarian based on the specified Escalation % In this example, No weighting factors/outlay rates therefore Raw = Weighted Inflation Rate: Inputs and Outputs Fixed Escalation Increase Librarian will auto-calculate the Compound and Composite values Can provide Outlay Rates/Expenditure profile if needed Compound (Raw) Indices No Outlay Rates/Expenditure Profile Librarian will ask for Compound Yes Outlay Rates/Expenditure Profile Librarian will ask for Compound and Composite Yearly Escalation Rates No Outlay Rates/Expenditure Profile Librarian will ask for Escalation % Yes Outlay Rates/Expenditure Profile Librarian will ask for Escalation % and Composite Specifying Annual Inflation Factors
 Expenditure profiles represent")

16 Funds obligated in one year will be spent over several subsequent years (expended) Expenditure profiles represent the percent of Total Obligation Authority (TOA) expended in any particular year Specifying Expenditure Profiles Alternate Step 4
17 Exporting Inflation Indices To facilitate sharing, Inflation Libraries can easily be imported or exported Export Step 1: Navigate to the custom library Export Step 2: Select File > Export Export Step 3: Provide a name for the table. Custom tables are XML files that are put together in a.zip file Export Step 4: Click Save. By default, the exported library is saved in the Libraries directory under ACEIT Data, but the file can be located anywhere The ZIP file can be ed or placed on a network drive to allow other users access
18 Importing Inflation Indices You can quickly import ACEIT 6.1 custom indices or another user s custom indices Import Step 1: Select File > Import Import Step 2: Select which table to import. By default it shows all databases that are in ACEIT 7.0 format (i.e. ZIP files). Navigate to a different directory and/or change the Files of Type drop down box to look for ACEIT 6.1 databases. (.DB files) Import Step 3: Select the file to import and click Open Librarian imports all tables and appropriations from the selected database into your custom library If you have an appropriation that matches one in the import file, you ll be prompted to overwrite or ignore it
19 Creating Custom CER Libraries
 Step")

20 Creating a New Methodology Library User can add new CERs to an existing custom library or create a new library By default, the Librarian contains one custom CER Library (Sample CER Library) Step 1: Navigate to the Methodology (CER) Library Step 2: Select File > New > Methodology Library or click Add New Methodology Library in tasks section Step 3: Enter information about the custom library
 or Insert CER( ) icon on the Methodology toolbar Select Edit > Add CER, Edit > Insert CER, Edit > Insert Child CER from the menu Select Add CER from the Tasks area Step 3: This moves")
21 Adding a Methodology Step 1: Navigate to the Methodology (CER) Library and choose the correct CER library for the new CER Step 2: Choose to add or insert a CER using one of these methods: Click on the Add CER( ) or Insert CER( ) icon on the Methodology toolbar Select Edit > Add CER, Edit > Insert CER, Edit > Insert Child CER from the menu Select Add CER from the Tasks area Step 3: This moves you to the Library View description column to enter the information for the CER Step 4: After entering CER information, enter a CER definition by clicking on Edit Definition from the Tasks or by Right-Clicking on the CER in the Library View

22 Specifying Standard Methodology Variables CERs often contain variables used to estimate a cost, Ex: Antenna cost based on aperture These variables can be placed in the methodology library so users have specifics on the variable if they wish to use the CER Step 1: Navigate to the Methodology Library Step 2: Select File > Edit Variables Step 3: Add, edit, or delete variables in the custom library Note: For users to see the variable information in ACE when they use the CER, they must change their ACE Session Properties so ACE searches parameter libraries for definitions of undefined variables encountered. This check box is found on the Calculation tab inside Session Properties (In ACE, Select File > Properties)


23 Keywords and Custom CERs Quickly search for a Custom CER with Keywords Step 1: Add the Keyword to the CER using the Methodology Keyword List column available in Librarian Step 2: Select the Keyword from the list available, or create a new keyword with description Step 3: In Librarian, select File > Save Step 4: Open ACE 7.0 Step 5: Select Tools > CER Library Step 6: Search by Subject and select the correct description from the drop down list Step 8: Select the correct CER from the list at the bottom of the window Alternately you can change the Destination drop down box to place the methodology in another cell on the active row
24 Exporting the CER Library To facilitate exchange and sharing, CER Libraries can easily be imported or exported Export Step 1: Navigate to the custom library Export Step 2: Select File > Export Export Step 3: Provide a name for the table. Custom tables are XML files that are put together in a.zip file Export Step 4: Click Save. By default, the exported library is saved in the Libraries directory under ACEIT Data, but the file can be located anywhere The ZIP file can be ed or placed on a network drive to allow other users access

25 Importing a CER Library Import allows user to bring in ACEIT 6.1 custom methodologies or some other user s custom methodology tables Import Step 1: Select File > Import Import Step 2: Select which table to import. By default it shows all databases that are in ACEIT 7.0 format (i.e. ZIP files). Navigate to a different directory and/or change the Files of Type drop down box to look for ACEIT 6.1 databases. (.DB files) Import Step 3: Select the file to import and click Open Librarian imports all tables and methodologies from the selected database into your custom library If you have a methodology that matches one in the import file, you ll be prompted to overwrite or ignore it
26 Using Custom Tables

27 Once you have created a custom Inflation Table with appropriations, you can use them in ACE Step 1: Open ACE 7.0, Start > Programs > ACEIT 7.0 > ACE Step 2: Select File > Properties and switch to Inflation Tab Step 3: Using the drop down box under Custom Inflation Table, select your custom table name The custom inflation indices are now available for use in your session. Using either codes or terms in the appropriation column you can easily use your custom inflation table in an ACE session The inflation indices used in your session are shown in the Session Rates section of the page To transfer all indices used in your session to your custom database, select Transfer to Custom DB Using Custom Inflation

28 Using Custom CERs Once you have created a custom CER (methodology) you can easily use it in ACE 7.0 Step 1: Open ACE 7.0, Start > Programs > ACEIT 7.0 > ACE Step 2: Switch to the Methodology window to view the Equation/Throughput column Step 3: Place the cursor on the row you wish to use the custom CER Step 4: Select Tools > CER Library, the CER Library dialog opens Step 5: Make sure the checkbox for Custom is selected to view the non-system libraries Step 6: Specify search information to look up the specific CER you to wish to use, or simply press Search to find all CERs in the selected library Step 7: Select the desired CER from the list at bottom Step 8: Optional Click the Definition button (if active) to view detailed information about the CER Step 9: Choose Select and the Methodology will automatically be pasted in the active cell you selected earlier (Step 3) Alternately you can change the Destination drop down box to place the methodology in another cell on the active row
29 Summary Building Inflation Table Creating Appropriation Building CER Library Creating CER Using and Sharing Custom Libraries
30 Thank You
 from base year b to year n is I n = (1+R b+1 )*(1+R b+2 )*.")
*(1+R 2007 )*(1+R 2008 ) From market basket data we know that R 2006 =")
31 Backup One Illustrate an example of data collection, calculation of overall inflation rate for collection, calculation of raw indices In general, the equation to calculate the index (I n ) from base year b to year n is I n = (1+R b+1 )*(1+R b+2 )*.*(1+R n-1 )*(1+R n ) Where R n is the decimal rate of overall inflation for year n. So to calculate the index for 2008 from a base year of 2005 we would have I 2008 = (1+R 2006 )*(1+R 2007 )*(1+R 2008 ) From market basket data we know that R 2006 = 2.925% or.02925, R 2007 =.03, and R 2008 =.0325 So I 2008 = ( ) * (1+.03) * ( )= Can be simplified to I 2008 = I 2007 * ( )=
32 Backup Two Funding considerations particular to government Full funding The total cost of major procurement and construction projects is funded in the fiscal year in which they will be initiated Incremental funding The total cost of major development programs or projects is funded over two or more fiscal years based upon levels and timing of obligation requirements for the funds Major issue with this policy: actual expenditures occur for several years past the initial obligation This requires the government to develop a composite index which weights the expected expenditures with the anticipated inflation Out years will have inflation that decreases the purchasing power of money To maintain purchasing power of money, you must have more money to begin with Weighted index is ratio of Money Needed / Purchasing Power The index represents a composite of the out year inflation factors Weighted by the amount of money spent in each out year according to the expenditure profile (outlay rates) DoD services use two different basic formulas to develop weighted indices Army uses simple weighting formula Navy, USMC, Air Force, and Defense Agency use a more complex formula Librarian can use both, use the drop down box to select
M E R C E R W I N WA L K T H R O U G H
 H E A L T H W E A L T H C A R E E R WA L K T H R O U G H C L I E N T S O L U T I O N S T E A M T A B L E O F C O N T E N T 1. Login to the Tool 2 2. Published reports... 7 3. Select Results Criteria...
Cerno Application Note Extending the Limits of Mass Spectrometry
 Creation of Accurate Mass Library for NIST Database Search Novel MS calibration has been shown to enable accurate mass and elemental composition determination on quadrupole GC/MS systems for either molecular
TOP MARKET SURVEY INSTRUCTION SHEET. Requirements. Overview
 INSTRUCTION SHEET TOP SURVEY TOP SURVEY INSTRUCTION SHEET Overview For nearly 40 years, the ACA has surveyed member agencies and conducted the Top Collection Market Survey. This survey provides critical
From BASIS DD to Barista Application in Five Easy Steps
 Y The steps are: From BASIS DD to Barista Application in Five Easy Steps By Jim Douglas our current BASIS Data Dictionary is perfect raw material for your first Barista-brewed application. Barista facilitates
From BASIS DD to Barista Application in Five Easy Steps
 Y The steps are: From BASIS DD to Barista Application in Five Easy Steps By Jim Douglas our current BASIS Data Dictionary is perfect raw material for your first Barista-brewed application. Barista facilitates
Watershed Modeling Orange County Hydrology Using GIS Data
 v. 10.0 WMS 10.0 Tutorial Watershed Modeling Orange County Hydrology Using GIS Data Learn how to delineate sub-basins and compute soil losses for Orange County (California) hydrologic modeling Objectives
The Geodatabase Working with Spatial Analyst. Calculating Elevation and Slope Values for Forested Roads, Streams, and Stands.
 GIS LAB 7 The Geodatabase Working with Spatial Analyst. Calculating Elevation and Slope Values for Forested Roads, Streams, and Stands. This lab will ask you to work with the Spatial Analyst extension.
41. Sim Reactions Example
 HSC Chemistry 7.0 41-1(6) 41. Sim Reactions Example Figure 1: Sim Reactions Example, Run mode view after calculations. General This example contains instruction how to create a simple model. The example
Using the Budget Features in Quicken 2008
 Using the Budget Features in Quicken 2008 Quicken budgets can be used to summarize expected income and expenses for planning purposes. The budget can later be used in comparisons to actual income and expenses
ON SITE SYSTEMS Chemical Safety Assistant
 ON SITE SYSTEMS Chemical Safety Assistant CS ASSISTANT WEB USERS MANUAL On Site Systems 23 N. Gore Ave. Suite 200 St. Louis, MO 63119 Phone 314-963-9934 Fax 314-963-9281 Table of Contents INTRODUCTION
Task 1: Open ArcMap and activate the Spatial Analyst extension.
 Exercise 10 Spatial Analyst The following steps describe the general process that you will follow to complete the exercise. Specific steps will be provided later in the step-by-step instructions component
Frequently Asked Questions
 Frequently Asked Questions Can I still get paid via direct deposit? Can I use e- wallet to pay for USANA auto ship orders? Can I use e- wallet to pay for USANA products? Can I use e- wallet to pay for
ISIS/Draw "Quick Start"
 ISIS/Draw "Quick Start" Click to print, or click Drawing Molecules * Basic Strategy 5.1 * Drawing Structures with Template tools and template pages 5.2 * Drawing bonds and chains 5.3 * Drawing atoms 5.4
Location Intelligence Infrastructure Asset Management. Confirm. Confirm Mapping Link to ArcMap Version v18.00b.am
 Location Intelligence Infrastructure Asset Management Confirm Confirm Mapping Link to ArcMap Version v18.00b.am Information in this document is subject to change without notice and does not represent a
SteelSmart System Cold Formed Steel Design Software Download & Installation Instructions
 Step 1 - Login or Create an Account at the ASI Portal: Login: https://portal.appliedscienceint.com/account/login Create Account: https://portal.appliedscienceint.com/account/register 2 0 1 7 A p p l i
User Manuel. EurotaxForecast. Version Latest changes ( )
") User Manuel EurotaxForecast Version 1.23.0771- Latest changes (19.07.2003) Contents Preface 5 Welcome to Eurotax Forecast...5 Using this manual 6 How to use this manual?...6 Program overview 7 General
User Manuel EurotaxForecast Version 1.23.0771- Latest changes (19.07.2003) Contents Preface 5 Welcome to Eurotax Forecast...5 Using this manual 6 How to use this manual?...6 Program overview 7 General
This tutorial is intended to familiarize you with the Geomatica Toolbar and describe the basics of viewing data using Geomatica Focus.
 PCI GEOMATICS GEOMATICA QUICKSTART 1. Introduction This tutorial is intended to familiarize you with the Geomatica Toolbar and describe the basics of viewing data using Geomatica Focus. All data used in
Space Objects. Section. When you finish this section, you should understand the following:
 GOLDMC02_132283433X 8/24/06 2:21 PM Page 97 Section 2 Space Objects When you finish this section, you should understand the following: How to create a 2D Space Object and label it with a Space Tag. How
MassHunter Software Overview
 MassHunter Software Overview 1 Qualitative Analysis Workflows Workflows in Qualitative Analysis allow the user to only see and work with the areas and dialog boxes they need for their specific tasks A
An area chart emphasizes the trend of each value over time. An area chart also shows the relationship of parts to a whole.
 Excel 2003 Creating a Chart Introduction Page 1 By the end of this lesson, learners should be able to: Identify the parts of a chart Identify different types of charts Create an Embedded Chart Create a
ST-Links. SpatialKit. Version 3.0.x. For ArcMap. ArcMap Extension for Directly Connecting to Spatial Databases. ST-Links Corporation.
 ST-Links SpatialKit For ArcMap Version 3.0.x ArcMap Extension for Directly Connecting to Spatial Databases ST-Links Corporation www.st-links.com 2012 Contents Introduction... 3 Installation... 3 Database
Calculating Bond Enthalpies of the Hydrides
 Proposed Exercise for the General Chemistry Section of the Teaching with Cache Workbook: Calculating Bond Enthalpies of the Hydrides Contributed by James Foresman, Rachel Fogle, and Jeremy Beck, York College
11. Kriging. ACE 492 SA - Spatial Analysis Fall 2003
 11. Kriging ACE 492 SA - Spatial Analysis Fall 2003 c 2003 by Luc Anselin, All Rights Reserved 1 Objectives The goal of this lab is to further familiarize yourself with ESRI s Geostatistical Analyst, extending
Tutorial 23 Back Analysis of Material Properties
 Tutorial 23 Back Analysis of Material Properties slope with known failure surface sensitivity analysis probabilistic analysis back analysis of material strength Introduction Model This tutorial will demonstrate
Ligand Scout Tutorials
 Ligand Scout Tutorials Step : Creating a pharmacophore from a protein-ligand complex. Type ke6 in the upper right area of the screen and press the button Download *+. The protein will be downloaded and
Displaying Latitude & Longitude Data (XY Data) in ArcGIS
 in ArcGIS") Displaying Latitude & Longitude Data (XY Data) in ArcGIS Created by Barbara Parmenter and updated on 2/15/2018 If you have a table of data that has longitude and latitude, or XY coordinates, you can view
Displaying Latitude & Longitude Data (XY Data) in ArcGIS Created by Barbara Parmenter and updated on 2/15/2018 If you have a table of data that has longitude and latitude, or XY coordinates, you can view
PDF-4+ Tools and Searches
 PDF-4+ Tools and Searches PDF-4+ 2018 The PDF-4+ 2018 database is powered by our integrated search display software. PDF-4+ 2018 boasts 72 search selections coupled with 125 display fields resulting in
v Prerequisite Tutorials GSSHA WMS Basics Watershed Delineation using DEMs and 2D Grid Generation Time minutes
 v. 10.1 WMS 10.1 Tutorial GSSHA WMS Basics Creating Feature Objects and Mapping Attributes to the 2D Grid Populate hydrologic parameters in a GSSHA model using land use and soil data Objectives This tutorial
The OptiSage module. Use the OptiSage module for the assessment of Gibbs energy data. Table of contents
 The module Use the module for the assessment of Gibbs energy data. Various types of experimental data can be utilized in order to generate optimized parameters for the Gibbs energies of stoichiometric
MAGNETITE OXIDATION EXAMPLE
 HSC Chemistry 7.0 1 MAGNETITE OXIDATION EXAMPLE Pelletized magnetite (Fe 3 O 4 ) ore may be oxidized to hematite (Fe 2 O 3 ) in shaft furnace. Typical magnetite content in ore is some 95%. Oxidation is
SuperCELL Data Programmer and ACTiSys IR Programmer User s Guide
 SuperCELL Data Programmer and ACTiSys IR Programmer User s Guide This page is intentionally left blank. SuperCELL Data Programmer and ACTiSys IR Programmer User s Guide The ACTiSys IR Programmer and SuperCELL
Quick Start Guide New Mountain Visit our Website to Register Your Copy (weatherview32.com)
") Quick Start Guide New Mountain Visit our Website to Register Your Copy (weatherview32.com) Page 1 For the best results follow all of the instructions on the following pages to quickly access real-time
Quick Start Guide New Mountain Visit our Website to Register Your Copy (weatherview32.com) Page 1 For the best results follow all of the instructions on the following pages to quickly access real-time
Agilent MassHunter Quantitative Data Analysis
 Agilent MassHunter Quantitative Data Analysis Presenters: Howard Sanford Stephen Harnos MassHunter Quantitation: Batch and Method Setup Outliers, Data Review, Reporting 1 MassHunter Quantitative Analysis
Preparing Spatial Data
 13 CHAPTER 2 Preparing Spatial Data Assessing Your Spatial Data Needs 13 Assessing Your Attribute Data 13 Determining Your Spatial Data Requirements 14 Locating a Source of Spatial Data 14 Performing Common
Data Structures & Database Queries in GIS
 Data Structures & Database Queries in GIS Objective In this lab we will show you how to use ArcGIS for analysis of digital elevation models (DEM s), in relationship to Rocky Mountain bighorn sheep (Ovis
This paper outlines the steps we took to process the repository file into a Geodatabase Utility Data Model for Bloomfield Township s analysis.
 Title of Paper Importing CAD Drawings into a Utility Data Model Authors Names Kevin G. Broecker & James R. Miller Abstract This presentation covers the process needed to integrate data from a CAD drawing
Computer simulation of radioactive decay
 Computer simulation of radioactive decay y now you should have worked your way through the introduction to Maple, as well as the introduction to data analysis using Excel Now we will explore radioactive
Copy the rules into MathLook for a better view. Close MathLook after observing the equations.
 Sample : Torsion on a Sha The Sha Design example is found the Sample Applications, Engeerg and Science section of the TK Solver Library. When it loads, the Variable and Rule Sheets appear as shown below.
PDF-4+ Tools and Searches
 PDF-4+ Tools and Searches PDF-4+ 2019 The PDF-4+ 2019 database is powered by our integrated search display software. PDF-4+ 2019 boasts 74 search selections coupled with 126 display fields resulting in
Introduction to Google Drive Objectives:
 Introduction to Google Drive Objectives: Learn how to access your Google Drive account Learn to create new documents using Google Drive Upload files to store on Google Drive Share files and folders with
NINE CHOICE SERIAL REACTION TIME TASK
 instrumentation and software for research NINE CHOICE SERIAL REACTION TIME TASK MED-STATE NOTATION PROCEDURE SOF-700RA-8 USER S MANUAL DOC-025 Rev. 1.3 Copyright 2013 All Rights Reserved MED Associates
DISCRETE RANDOM VARIABLES EXCEL LAB #3
 DISCRETE RANDOM VARIABLES EXCEL LAB #3 ECON/BUSN 180: Quantitative Methods for Economics and Business Department of Economics and Business Lake Forest College Lake Forest, IL 60045 Copyright, 2011 Overview
Athena Visual Software, Inc. 1
 Athena Visual Studio Visual Kinetics Tutorial VisualKinetics is an integrated tool within the Athena Visual Studio software environment, which allows scientists and engineers to simulate the dynamic behavior
Notifications and Accretions: Facility Role
 Notifications and Accretions: Facility Role Goal: Learn to view and resolve notification and accretion discrepancies in CROWNWeb. Estimated Time: 25 to 30 minutes PDF: Download a screen reader compatible
You w i ll f ol l ow these st eps : Before opening files, the S c e n e panel is active.
 You w i ll f ol l ow these st eps : A. O pen a n i m a g e s t a c k. B. Tr a c e t h e d e n d r i t e w i t h t h e user-guided m ode. C. D e t e c t t h e s p i n e s a u t o m a t i c a l l y. D. C
Standards-Based Quantification in DTSA-II Part II
 Standards-Based Quantification in DTSA-II Part II Nicholas W.M. Ritchie National Institute of Standards and Technology, Gaithersburg, MD 20899-8371 nicholas.ritchie@nist.gov Introduction This article is
Spatial Data Analysis in Archaeology Anthropology 589b. Kriging Artifact Density Surfaces in ArcGIS
 Spatial Data Analysis in Archaeology Anthropology 589b Fraser D. Neiman University of Virginia 2.19.07 Spring 2007 Kriging Artifact Density Surfaces in ArcGIS 1. The ingredients. -A data file -- in.dbf
Collaborative Forecasts Implementation Guide
 Collaborative Forecasts Implementation Guide Version 1, Spring 16 @salesforcedocs Last updated: February 11, 2016 Copyright 2000 2016 salesforce.com, inc. All rights reserved. Salesforce is a registered
Downloading GPS Waypoints
 Downloading Data with DNR- GPS & Importing to ArcMap and Google Earth Written by Patrick Florance & Carolyn Talmadge, updated on 4/10/17 DOWNLOADING GPS WAYPOINTS... 1 VIEWING YOUR POINTS IN GOOGLE EARTH...
Exercises for Windows
 Exercises for Windows CAChe User Interface for Windows Select tool Application window Document window (workspace) Style bar Tool palette Select entire molecule Select Similar Group Select Atom tool Rotate
Geodatabases and ArcCatalog
 Geodatabases and ArcCatalog Prepared by Francisco Olivera, Ph.D. and Srikanth Koka Department of Civil Engineering Texas A&M University February 2004 Contents Brief Overview of Geodatabases Goals of the
Esterification in a PFR with Aspen Plus V8.0
 Esterification in a PFR with Aspen Plus V8.0 1. Lesson Objectives Use Aspen Plus to determine whether a given reaction is technically feasible using a plug flow reactor. 2. Prerequisites Aspen Plus V8.0
Dose-Response Analysis Report
 Contents Introduction... 1 Step 1 - Treatment Selection... 2 Step 2 - Data Column Selection... 2 Step 3 - Chemical Selection... 2 Step 4 - Rate Verification... 3 Step 5 - Sample Verification... 4 Step
Please click the link below to view the YouTube video offering guidance to purchasers:
 Guide Contents: Video Guide What is Quick Quote? Quick Quote Access Levels Your Quick Quote Control Panel How do I create a Quick Quote? How do I Distribute a Quick Quote? How do I Add Suppliers to a Quick
Collaborative Forecasts Implementation Guide
 Collaborative Forecasts Implementation Guide Version 1, Spring 17 @salesforcedocs Last updated: March 10, 2017 Copyright 2000 2017 salesforce.com, inc. All rights reserved. Salesforce is a registered trademark
REPLACE DAMAGED OR MISSING TEXTBOOK BARCODE LABEL
 Destiny Textbook Manager allows users to create and print replacement barcode labels for textbooks. In this tutorial you will learn how to: Replace damaged textbook barcode label(s) Replace missing textbook
Automatic Watershed Delineation using ArcSWAT/Arc GIS
 Automatic Watershed Delineation using ArcSWAT/Arc GIS By: - Endager G. and Yalelet.F 1. Watershed Delineation This tool allows the user to delineate sub watersheds based on an automatic procedure using
Esterification in CSTRs in Series with Aspen Plus V8.0
 Esterification in CSTRs in Series with Aspen Plus V8.0 1. Lesson Objectives Use Aspen Plus to determine whether a given reaction is technically feasible using three continuous stirred tank reactors in
-ASTR 204 Application of Astroimaging Techniques
 Lab 5 - JPL Ephemeris, Binary Maker 3 In Lab 5 we ll look at another ephemeris generating tool; Horizons Web-Interface from JPL, and Binary Maker 3 program for generating radial velocity curves and 3-D
Workshop: Build a Basic HEC-HMS Model from Scratch
 Workshop: Build a Basic HEC-HMS Model from Scratch This workshop is designed to help new users of HEC-HMS learn how to apply the software. Not all the capabilities in HEC-HMS are demonstrated in the workshop
Ocean Optics Educational Spectrometers. Getting Started Manual
 Ocean Optics Educational Spectrometers Getting Started Manual We here at Ocean Optics want you to know that we appreciate your business. To speak to a Technical Support representative or an Ocean Optics
LED Lighting Facts: Manufacturer Guide
 LED Lighting Facts: Manufacturer Guide 2018 1 P a g e L E D L i g h t i n g F a c t s : M a n u f a c t u r e r G u i d e TABLE OF CONTENTS Section 1) Accessing your account and managing your products...
NMR Predictor. Introduction
 NMR Predictor This manual gives a walk-through on how to use the NMR Predictor: Introduction NMR Predictor QuickHelp NMR Predictor Overview Chemical features GUI features Usage Menu system File menu Edit
NEW HOLLAND IH AUSTRALIA. Machinery Market Information and Forecasting Portal *** Dealer User Guide Released August 2013 ***
 NEW HOLLAND IH AUSTRALIA Machinery Market Information and Forecasting Portal *** Dealer User Guide Released August 2013 *** www.cnhportal.agriview.com.au Contents INTRODUCTION... 5 REQUIREMENTS... 6 NAVIGATION...
Information Dependent Acquisition (IDA) 1
 1") Information Dependent Acquisition (IDA) Information Dependent Acquisition (IDA) enables on the fly acquisition of MS/MS spectra during a chromatographic run. Analyst Software IDA is optimized to generate
Information Dependent Acquisition (IDA) Information Dependent Acquisition (IDA) enables on the fly acquisition of MS/MS spectra during a chromatographic run. Analyst Software IDA is optimized to generate
OECD QSAR Toolbox v.4.1. Tutorial illustrating new options for grouping with metabolism
 OECD QSAR Toolbox v.4.1 Tutorial illustrating new options for grouping with metabolism Outlook Background Objectives Specific Aims The exercise Workflow 2 Background Grouping with metabolism is a procedure
MassHunter TOF/QTOF Users Meeting
 MassHunter TOF/QTOF Users Meeting 1 Qualitative Analysis Workflows Workflows in Qualitative Analysis allow the user to only see and work with the areas and dialog boxes they need for their specific tasks
ArcGIS 9 ArcGIS StreetMap Tutorial
 ArcGIS 9 ArcGIS StreetMap Tutorial Copyright 2001 2008 ESRI All Rights Reserved. Printed in the United States of America. The information contained in this document is the exclusive property of ESRI. This
Sediment Budget Analysis System-A: SBAS-A for ArcView Application
 Sediment Budget Analysis System-A: SBAS-A for ArcView Application by Rose Dopsovic, Lynn Hardegree, and Julie Rosati PURPOSE. This Coastal and Hydraulics Engineering Technical Note (CHETN) describes a
LED Lighting Facts: Product Submission Guide
 LED Lighting Facts: Product Submission Guide NOVEMBER 2017 1 P a g e L E D L i g h t i n g F a c t s : M a n u f a c t u r e r P r o d u c t S u b m i s s i o n G u i d e TABLE OF CONTENTS Section 1) Accessing
Quality Measures Green Light Report Online Management Tool. Self Guided Tutorial
 Quality Measures Green Light Report Online Management Tool Self Guided Tutorial 1 Tutorial Contents Overview Access the QM Green Light Report Review the QM Green Light Report Tips for Success Contact PointRight
Demand Forecasting. for. Microsoft Dynamics 365 for Operations. User Guide. Release 7.1. April 2018
 Demand Forecasting for Microsoft Dynamics 365 for Operations User Guide Release 7.1 April 2018 2018 Farsight Solutions Limited All Rights Reserved. Portions copyright Business Forecast Systems, Inc. This
Protein Deconvolution Version 2.0
 Thermo Protein Deconvolution Version 2.0 User Guide XCALI-97414 Revision A August 2012 2012 Thermo Fisher Scientific Inc. All rights reserved. ReSpect is a trademark of Positive Probability Ltd. Xcalibur
ncounter PlexSet Data Analysis Guidelines
 ncounter PlexSet Data Analysis Guidelines NanoString Technologies, Inc. 530 airview Ave North Seattle, Washington 98109 USA Telephone: 206.378.6266 888.358.6266 E-mail: info@nanostring.com Molecules That
Agilent MassHunter Quantitative Data Analysis
 Agilent MassHunter Quantitative Data Analysis Presenters: Howard Sanford Stephen Harnos MassHunter Quantitation: Batch Table, Compound Information Setup, Calibration Curve and Globals Settings 1 MassHunter
CREATING CUSTOMIZED DATE RANGE COLLECTIONS IN PRESENTATION STUDIO
 CREATING CUSTOMIZED DATE RANGE COLLECTIONS IN PRESENTATION STUDIO Date range collections are pre-defined reporting periods for performance data. You have two options: Dynamic date ranges automatically
D.T.M: TRANSFER TEXTBOOKS FROM ONE SCHOOL TO ANOTHER
 Destiny Textbook Manager allows users with full access to transfer Textbooks from one school site to another and receive transfers from the warehouse In this tutorial you will learn how to: Requirements:
Collaborative Forecasts Implementation Guide
 Collaborative Forecasts Implementation Guide Version 1, Summer 18 @salesforcedocs Last updated: August 21, 2018 Copyright 2000 2018 salesforce.com, inc. All rights reserved. Salesforce is a registered
Map My Property User Guide
 Map My Property User Guide Map My Property Table of Contents About Map My Property... 2 Accessing Map My Property... 2 Links... 3 Navigating the Map... 3 Navigating to a Specific Location... 3 Zooming
Collaborative Forecasts Implementation Guide
 Collaborative Forecasts Implementation Guide Version 1, Winter 19 @salesforcedocs Last updated: October 16, 2018 Copyright 2000 2018 salesforce.com, inc. All rights reserved. Salesforce is a registered
Designing a Quilt with GIMP 2011
 Planning your quilt and want to see what it will look like in the fabric you just got from your LQS? You don t need to purchase a super expensive program. Try this and the best part it s FREE!!! *** Please
Jasco V-670 absorption spectrometer
 Laser Spectroscopy Labs Jasco V-670 absorption spectrometer Operation instructions 1. Turn ON the power switch on the right side of the spectrophotometer. It takes about 5 minutes for the light source
Using the Stock Hydrology Tools in ArcGIS
 Using the Stock Hydrology Tools in ArcGIS This lab exercise contains a homework assignment, detailed at the bottom, which is due Wednesday, October 6th. Several hydrology tools are part of the basic ArcGIS
Table of content. Understanding workflow automation - Making the right choice Creating a workflow...05
 Marketers need to categorize their audience to maximize their r e a c h. Z o h o C a m p a i g n s a u t o m a t e s r e c i p i e n t c l a s s i fi c a t i o n a n d action performance to free up marketers
Exercise 6: Using Burn Severity Data to Model Erosion Risk
 Exercise 6: Using Burn Severity Data to Model Erosion Risk Document Updated: November 2009 Software Versions: ERDAS Imagine 9.3 and ArcGIS 9.3, Microsoft Office 2007 Introduction A common use of burn severity
Performing Map Cartography. using Esri Production Mapping
 AGENDA Performing Map Cartography Presentation Title using Esri Production Mapping Name of Speaker Company Name Kannan Jayaraman Agenda Introduction What s New in ArcGIS 10.1 ESRI Production Mapping Mapping
Tutorial. Getting started. Sample to Insight. March 31, 2016
 Getting started March 31, 2016 Sample to Insight CLC bio, a QIAGEN Company Silkeborgvej 2 Prismet 8000 Aarhus C Denmark Telephone: +45 70 22 32 44 www.clcbio.com support-clcbio@qiagen.com Getting started
Getting started with BatchReactor Example : Simulation of the Chlorotoluene chlorination
 Getting started with BatchReactor Example : Simulation of the Chlorotoluene chlorination 2011 ProSim S.A. All rights reserved. Introduction This document presents the different steps to follow in order
ICM-Chemist How-To Guide. Version 3.6-1g Last Updated 12/01/2009
 ICM-Chemist How-To Guide Version 3.6-1g Last Updated 12/01/2009 ICM-Chemist HOW TO IMPORT, SKETCH AND EDIT CHEMICALS How to access the ICM Molecular Editor. 1. Click here 2. Start sketching How to sketch
Chemwatch How To. Create Labels for Chemicals, Products & Mixtures.
 Chemwatch How To. Create Labels for Chemicals, Products & Mixtures. Dr Ian Lane Radiation and Chemical Manager Faculty of Science Version 1.0, April 2017 Outline: (i) Important Note! Part A: Creating a
Geodatabases and ArcCatalog
 Geodatabases and ArcCatalog Francisco Olivera, Ph.D., P.E. Srikanth Koka Lauren Walker Aishwarya Vijaykumar Keri Clary Department of Civil Engineering April 21, 2014 Contents Geodatabases and ArcCatalog...
Introduction to ArcMap
 Introduction to ArcMap ArcMap ArcMap is a Map-centric GUI tool used to perform map-based tasks Mapping Create maps by working geographically and interactively Display and present Export or print Publish
WMS 9.0 Tutorial GSSHA Modeling Basics Infiltration Learn how to add infiltration to your GSSHA model
 v. 9.0 WMS 9.0 Tutorial GSSHA Modeling Basics Infiltration Learn how to add infiltration to your GSSHA model Objectives This workshop builds on the model developed in the previous workshop and shows you
Appendix B Microsoft Office Specialist exam objectives maps
 B 1 Appendix B Microsoft Office Specialist exam objectives maps This appendix covers these additional topics: A Excel 2003 Specialist exam objectives with references to corresponding material in Course
Task 1: Start ArcMap and add the county boundary data from your downloaded dataset to the data frame.
 Exercise 6 Coordinate Systems and Map Projections The following steps describe the general process that you will follow to complete the exercise. Specific steps will be provided later in the step-by-step
2010 Autodesk, Inc. All rights reserved. NOT FOR DISTRIBUTION.
 Wastewater Profiles 2010 Autodesk, Inc. All rights reserved. NOT FOR DISTRIBUTION. The contents of this guide were created for Autodesk Topobase 2011. The contents of this guide are not intended for other
Accountability. User Guide
 Accountability User Guide The information in this document is subject to change without notice and does not represent a commitment on the part of Horizon. The software described in this document is furnished
Application Note. U. Heat of Formation of Ethyl Alcohol and Dimethyl Ether. Introduction
 Application Note U. Introduction The molecular builder (Molecular Builder) is part of the MEDEA standard suite of building tools. This tutorial provides an overview of the Molecular Builder s basic functionality.
Introduction to Structure Preparation and Visualization
 Introduction to Structure Preparation and Visualization Created with: Release 2018-4 Prerequisites: Release 2018-2 or higher Access to the internet Categories: Molecular Visualization, Structure-Based
How to create a new geodatabase using the extract data wizard. 1. How to Extract the Schema to create a Geodatabase using an existing design.
 How to create a new geodatabase using the extract data wizard The Extract Data Wizard can be used to create a new database based on an existing geodatabase. This tool may be used in the following cases: