|
|
|
- Camron Snow
- 5 years ago
- Views:
Transcription

1
2
3
4
5
6
7
8
9
10
11

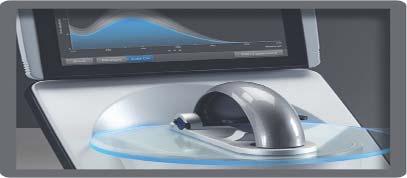
12 NanoDrop One Viewer software NanoDrop One Website.

13 NanoDrop One Website
14 NanoDrop One Viewer software NanoDrop One Website Software System Update Update Update Software, Update Note OK Language

15
16
17
18

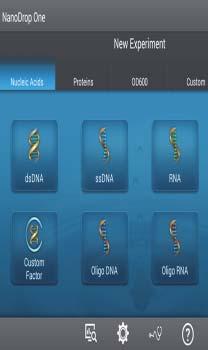
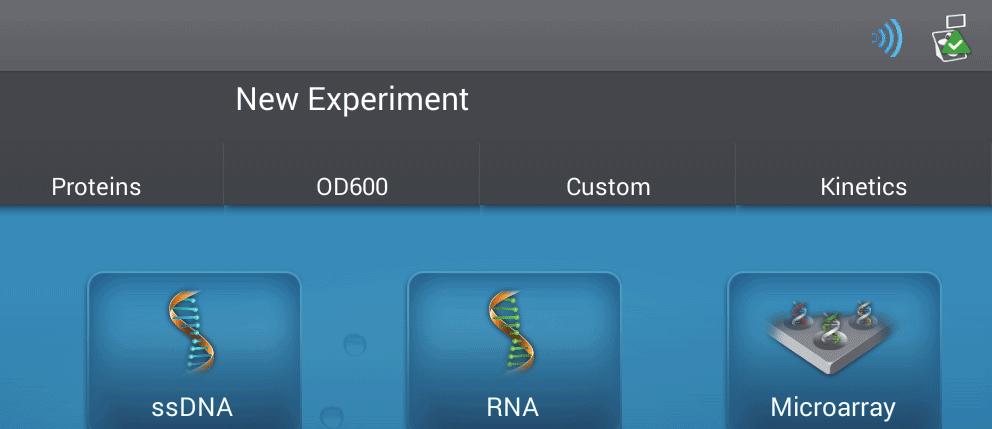
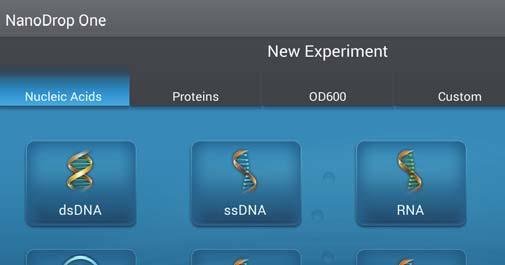
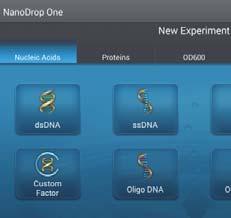
19 Measure dsdna, ssdna or RNA Reported Results Settings Detection Limits Calculations
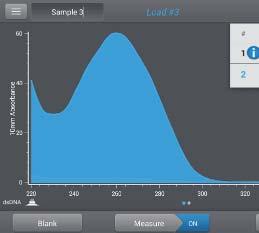
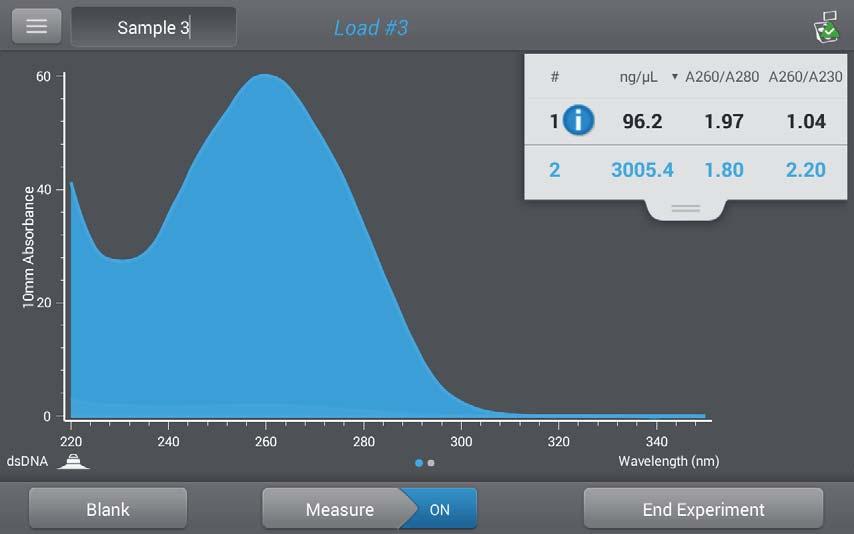
20 Before you begin... Nucleic Acids dsdna, ssdna or RNA Tip Blank Tip Measure. Measure End Experiment
21 Related Topics
22
23 Related Topics Nucleic Acid Setup.
24 Optional user-defined baseline correction Related Topics Beer-Lambert Equation (solved for concentration) Note
25 Extinction Coefficients vs Factors sample pathlength f Factors Used dsdna ssdna RNA Custom Factor
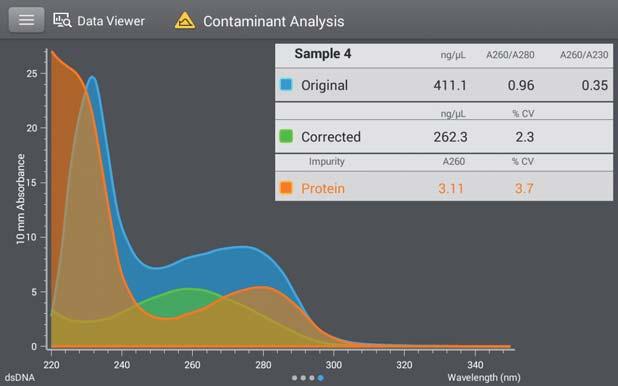
26 Measured Values Note A260 absorbance A230 and A280 absorbance Sample Pathlength
27 Reported Values Nucleic acid concentration A260/A280 purity ratio A260/A230 purity ratio Note
28

29 Measure Microarray Samples Reported Results Settings Detection Limits Calculations
30 Before you begin...
31 Microarray Nucleic Acids Tip Tip Blank Tip Measure. Measure End Experiment
32 Related Topics
33
34 Related Topics Microarray Setup.
35 Tip

36 > Dye/Chrom. Editor > Dye/Chrom. Editor Settings
37 Add or remove a dye Add custom dye Name Done Unit Extinction Coefficient Wavelength Add Dye Edit custom dye
38 Save Dye Delete custom dye Related Topics Available Options for Factors dsdna ssdna RNA Oligo DNA Oligo RNA Custom Factor Tip Note
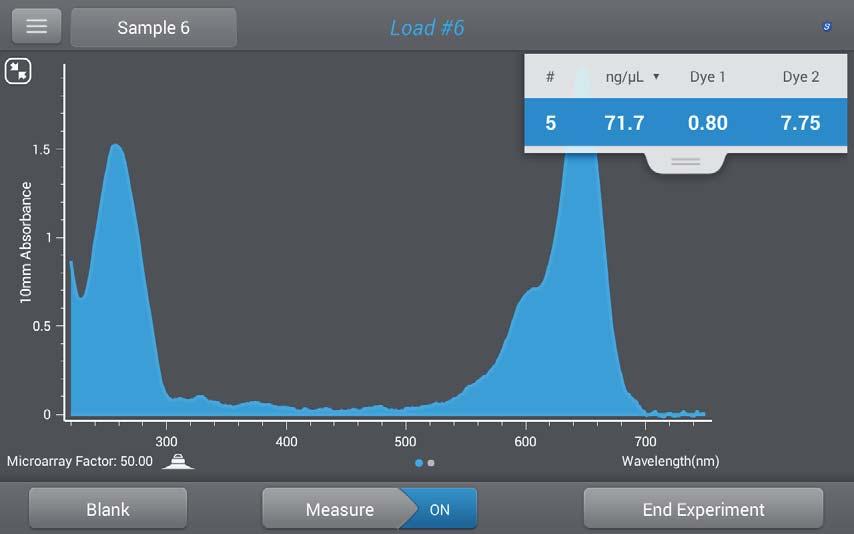
39 Measured Values A260 absorbance Note A280 absorbance Dye absorbance Dye correction
40 Sample Pathlength Reported Values Nucleic acid concentration A260/A280 purity ratio Dye1/Dye2 concentration Note Related Topics

41 Measure using Custom Factor Reported Results Settings Detection Limits Calculations
42 Before you begin... Custom Factor Nucleic Acids Tip Blank Tip Measure. Measure End Experiment
43 Related Topics
44 Related Topics
45 Custom Factor Setup. f = 1/( * b)) f b Optional user-defined baseline correction Related Topics
46 Related Topics

47 Measure Oligo DNA or RNA Reported Results Settings Detection Limits Calculations
48 Before you begin...
49 Oligo DNA Nucleic Acids Oligo RNA Tip Blank Tip Measure. Measure End Experiment Related Topics
50

51
52 Related Topics

53 Oligo RNASetup). Oligo DNASetup (or Factor f = 1/( * b) f b
54 Molecular Weight Number of Bases Molar Ext. Coefficient (260 nm) %GC Tip Related Topics
55 Related Topics Extinction Coefficients for Oligonucleotides N = N 1 2 N 1 Tip
56 Measured Values A260 absorbance Note A230, A280 absorbance Sample Pathlength
57 Reported Values Nucleic acid concentration A260/A280 purity ratio A260/A230 purity ratio Note Note Related Topics
58

59 Measure A280 Proteins Reported Results Settings Detection Limits Calculations
60 Before you begin...
61 Protein A280 Proteins Tip Blank Tip Measure Measure End Experiment
62
63 Related Topics
64

65 Related Topics Protein A280 Setup.
66
67 Tip > Protein Editor Settings > Protein Editor

68 Add custom protein Name Done Description Molar Extinction Mass Extinction Mass Extinction

69 Molar Extinction OK Edit custom protein OK
70 Delete custom protein Related Topics Related Topics
71 Beer-Lambert Equation (solved for concentration) Note Extinction Coefficients for Proteins Tip
72 Available Options for Extinction Coefficient 1 Abs = 1 mg/ml BSA IgG Lysozyme Tip Other protein Other protein Note Published Extinction Coefficients Tip Conversions Between molar and 1%
73 Conversions Between g/100 ml and mg/ml Tip Measured Values A280 absorbance Note A260 absorbance Sample Pathlength
74 Reported Values Protein concentration. A260/A280 purity ratio Note

75 Measure Labeled Proteins Reported Results Settings Detection Limits Calculations
76 Before you begin...
77 Protein & Labels Proteins Tip Tip Blank Tip Measure Measure End Experiment
78 Related Topics
79
80 Reported values for Proteins & Labels application Related Topics Proteins & Labels Setup.
81 Tip Tip
82 Related Topics Related Topics
83 Available Options for Extinction Coefficient 1 Abs = 1 mg/ml BSA IgG Lysozyme Other protein Other protein Tip Note Measured Values A280 absorbance Note
84 Dye absorbance Dye correction Sample Pathlength Reported Values Protein concentration. Dye1/Dye2 concentration Related Topics

85 Measure A205 Proteins Reported Results Settings Detection Limits Calculations
86 Before you begin... Proteins Protein A205 Tip Blank Tip Measure Measure End Experiment Related Topics
87

88
89 Related Topics Protein A205 Setup.
90 Related Topics Tip
91 Available Options for Extinction Coefficient 31 Scopes Other protein Note Tip Measured Values A205 absorbance Note A280 absorbance
92 Sample Pathlength Reported Values Protein concentration. Related Topics
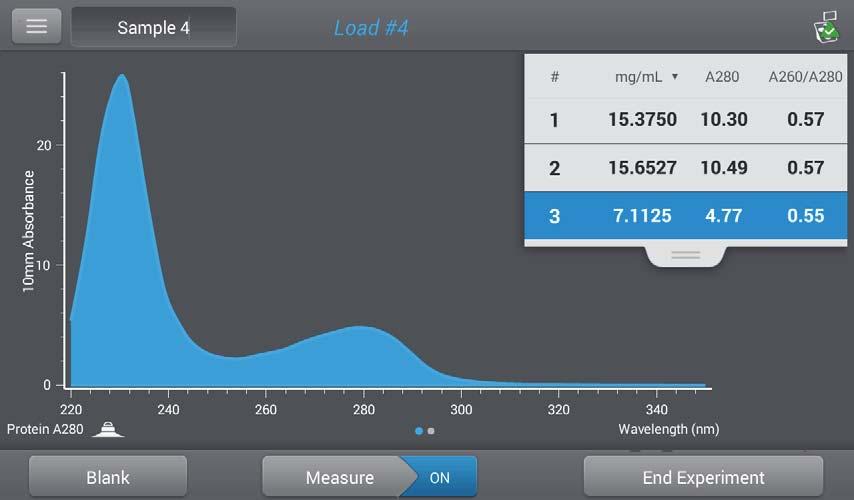
93 Measure Total Protein Reported Results Settings Detection Limits
94 All reference and standards solutions First standard Concentration range of the standards requires one reference measurement Concentration values for standards up to 7 standards

95 Measure the reference and all standards blank the instrument

96 Swipe left one screen

97 Swipe left one screen Press and hold

98 Load more standards Run samples [application name] Setup Done [application name] Setup Done
99 Valid Curve indicator Before you begin... Proteins Protein BCA Tip Curve Type
100 Tip Blank Measure Measure Done Measure End Experiment Related Topics
101
102
103
104

105 Related Topics
106 Protein BCA Setup. Linear Interpolation 2 nd order polynomial 3 rd order polynomial Note Note Related Topics
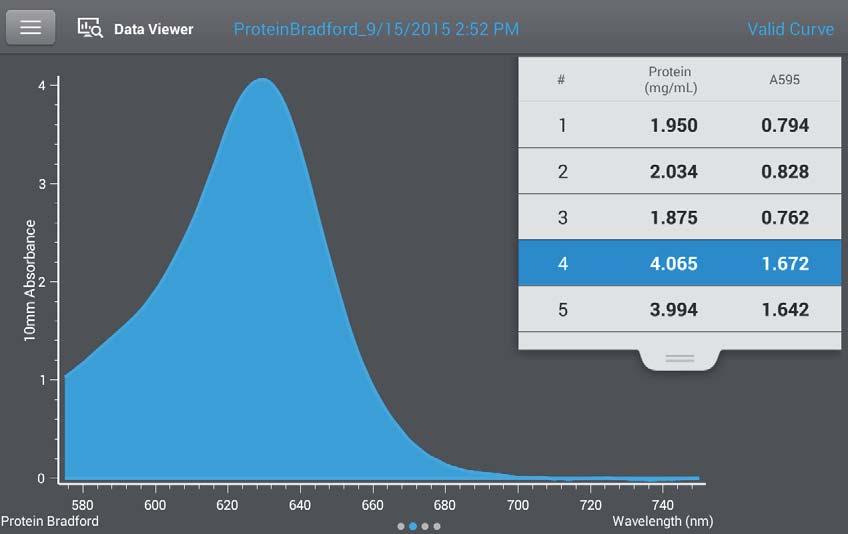
107 Measure Total Protein Reported Results Settings Detection Limits
108 Work quickly and do not allow prepared standards or samples to sit longer than necessary Measure standards and samples in triplicate
109 Before you begin... Proteins Protein Bradford Tip Curve Type Replicates
110 Tip Blank Measure Measure Done Measure End Experiment Related Topics
111
112
113
114
115 Related Topics Protein Bradford Setup.
116 Linear Interpolation 2 nd order polynomial 3 rd order polynomial Note Note Related Topics
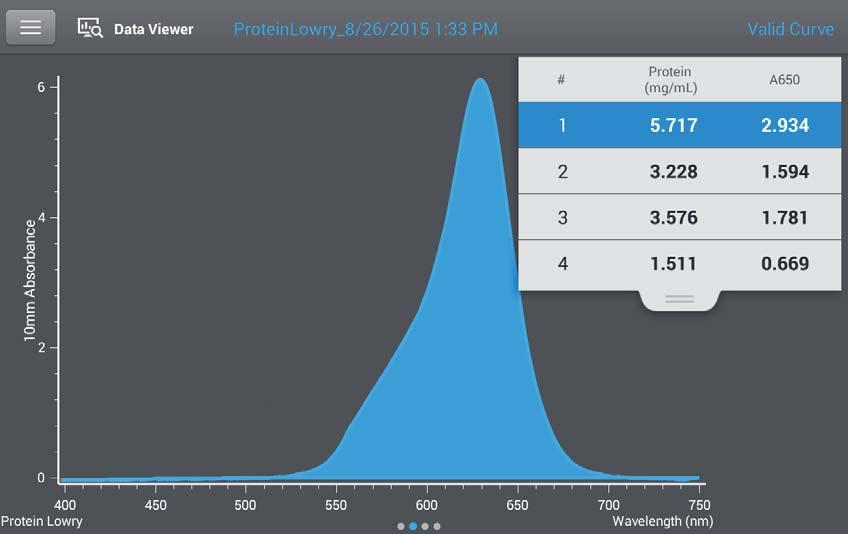
117 Measure Total Protein Reported Results Settings Detection Limits
118 Before you begin... Proteins Protein Lowry Tip Curve Type
119 Tip Blank Measure Measure Done Measure End Experiment Related Topics
120
121
122
123 Related Topics
124 Protein Lowry Setup. Linear Interpolation 2 nd order polynomial 3 rd order polynomial Note Note Related Topics

125 Measure Total Protein Reported Results Settings Detection Limits
126 Before you begin...
127 Proteins Protein Pierce 660 Tip Curve Type
128 Tip Blank Measure Measure Done Measure End Experiment Related Topics
129

130
131
132 Related Topics

133 Protein Pierce 660 Setup. Linear Interpolation 2 nd order polynomial 3 rd order polynomial Note Note Related Topics
134

135 Measure OD600 Reported Results Settings Calculations
136
137 Before you begin...
138 OD600 OD600 Tip Blank Tip Measure Measure End Experiment Related Topics

139

140 Related Topics OD600 Setup.
141
142 Related Topics Tip
143 Measured Values A600 absorbance Note A absorbance Sample Pathlength Reported Values Cell concentration.
144

145 Measure Custom Method Delete Custom Method Reported Results

146 Load custom methods onto the instrument Custom Custom Load Method Load
147 Before you begin... Custom Custom Local Direct-Connect PC computer s assigned name
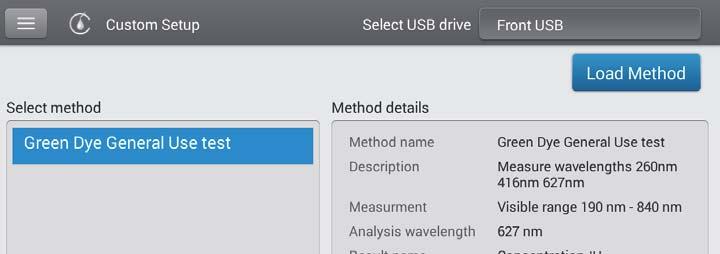

148 OK Local Direct-Connect PC computer name Run Method
149 Related Topics Custom Custom
150

151 Related Topics
152

153 Measure UV-Vis Reported Results Settings Detection Limits
154 Before you begin... Custom UV-Vis Tip Blank Tip Measure Measure. End Experiment
155 Related Topics
156

157 Related Topics
158 Setup. UV-Vis User-defined wavelengths to be measured and reported at run time Note Optional automated pathlength selection Note Optional user-defined baseline correction Related Topics
159
160

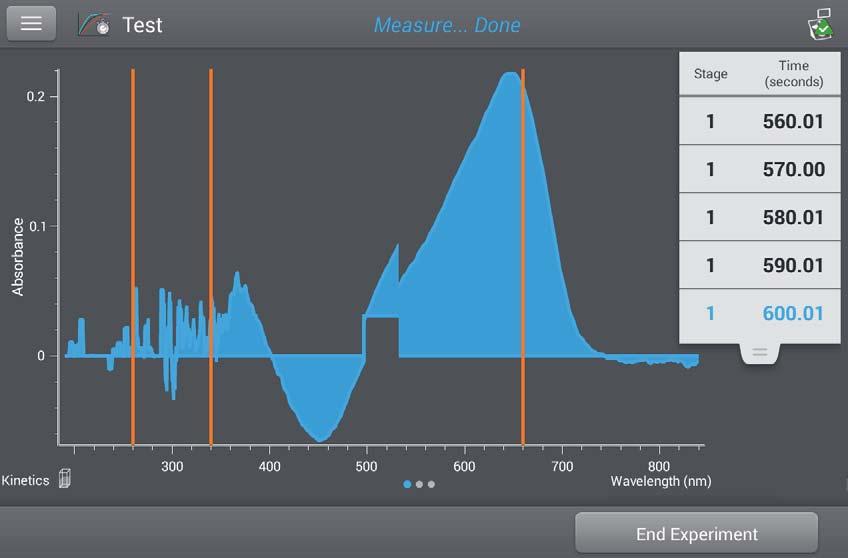
161 Measure Kinetics Create Kinetics Method Edit Kinetics Method Reported Results Settings Detection Limits

162 Kinetics Kinetics method name Save Method Create Method method name Edit Method > Settings Note Run Method Blank

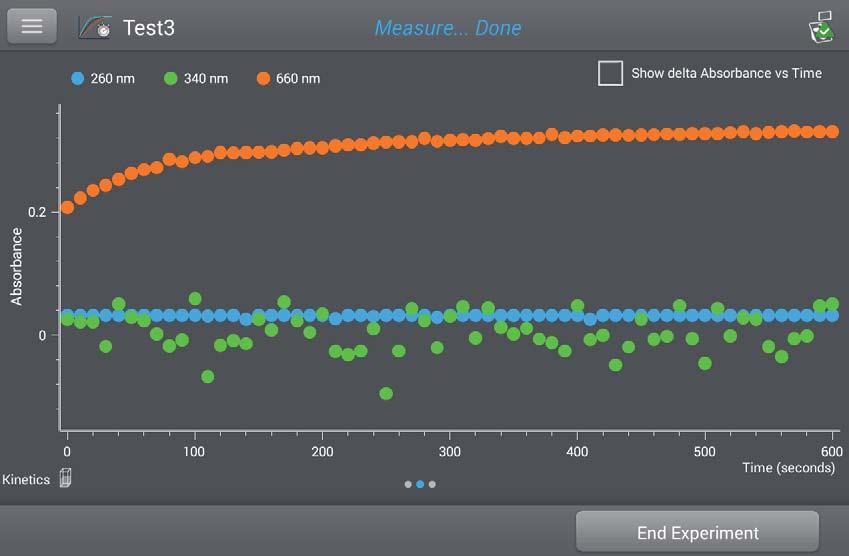
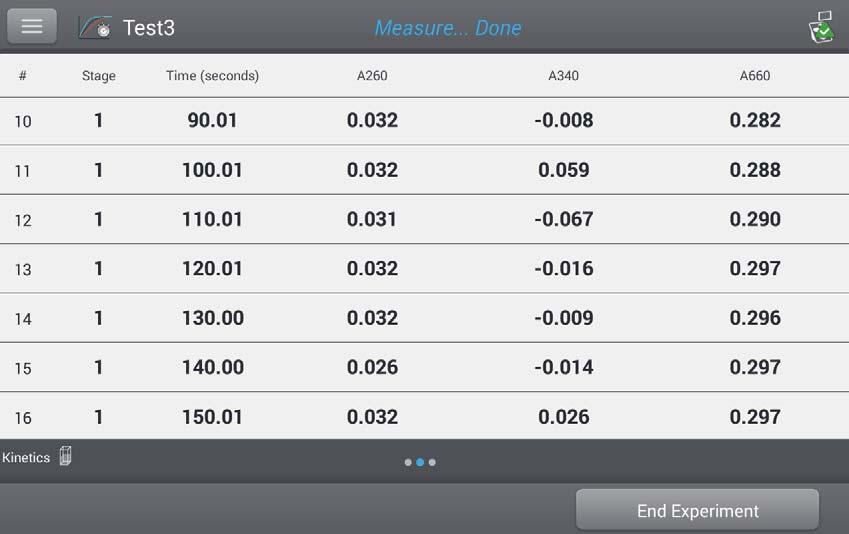
163 Heat Cuvette to 37 C Note Measure Heat Cuvette to 37 C Note Pause Stop End Experiment Related Topics

164 Create Method Kinetics Kinetics Method Name Description Measurement range Wavelengths to monitor

165 Number of stages Time unit # intervals Interval times Delays rows boxes Save Method Run Method Related Topics
166 Kinetics Kinetics Edit Method Save Method Run Method Related Topics
167
168

169 Show Delta Absorbance Vs Time
170

171 Related Topics
172 Kinetics > Kinetics Create Method Edit Method. Kinetics Setup. Enter a name description Select the spectral range Note Enter up to 3 wavelengths Note Specify up to 5 stages Note

173 unit Delay Interval Time Note #Intervals Note #Intervals Duration rows boxes
174 Related Topics Note


175

176
177 Note Absorbance = log intensitysample intensityblank A = b c Related Topics
178

179 Set up Bluetooth connections on the instrument Settings System Bluetooth ( Off add a Bluetooth device Search For Devices
180 tap its name complete any instructions

181 Back Done Deselect Bluetooth input device System Bluetooth Profiles
182 Use For Input Paired Bluetooth Device Back Done Disconnect Bluetooth device System Bluetooth

183 Unpair Back Done Set up Ethernet connection


184 Select Wi-Fi network on the instrument System Wi-Fi ( Connect
185 Back Done

186 Configure Wi-Fi data storage on the remote computer NanoDrop One Viewer File > Set Up Wi-Fi Data Storage Instrument IP address Instrument Name Status Settings > System PC Name
187 Enabled Add OK Delete

188 Connectivity Status Local Direct-Connect PC* computer s assigned name* *
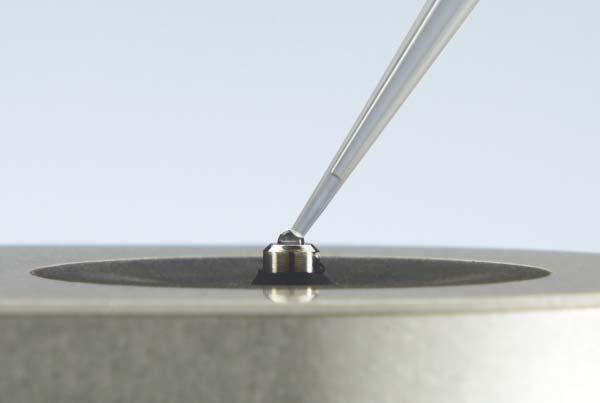
")
189 Connect ( OK )
190

191 Show connectivity status OK Related Topics
192
193


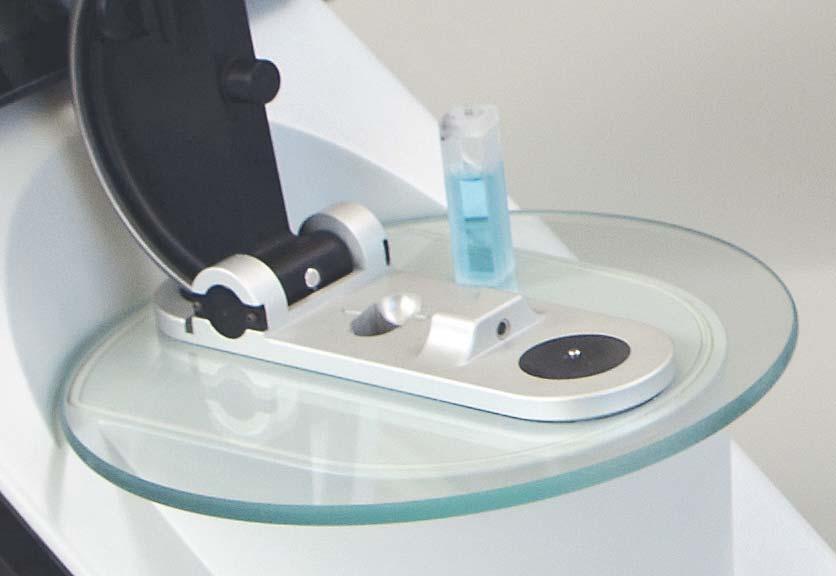
194 Cleaning pedestals for daily operation

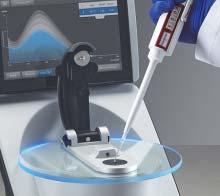
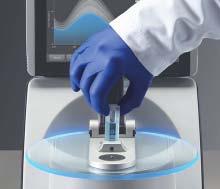
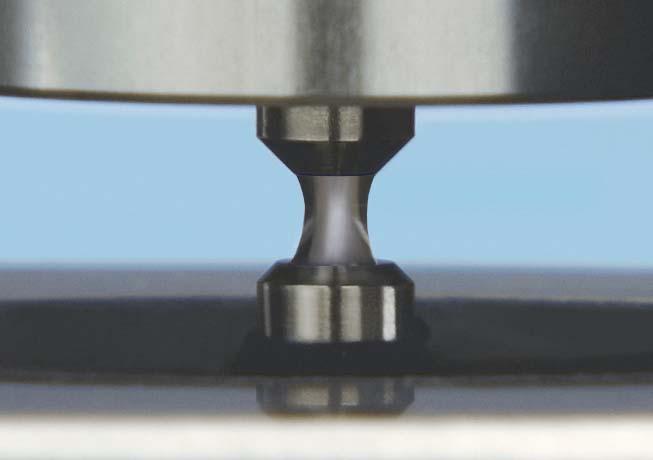
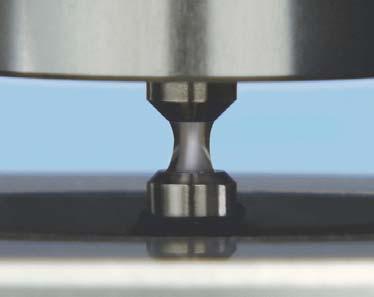
195 Pipetting Samples


196 Data Storage tap the icon


197 Blank Tip Measure
198

199 Related Topics Experiment Name Done

200

201


202 General. Use Cuvette. Pathlength Done. Blank

203 Related Topics Measure.
204 Tip Tip

205 For best results: Problems associated with blanking
206 Solutions for blanking problems Supplies needed
207
208 Blank Measure End Experiment Related Topics
209
210

211 application name Application tab
212 * *
213
214 Related Topics
215
216 Edit default sample base name Sample Name Done Edit sample name swipe left Sample Name sample name
217 Done
218 Blank Measure Measure
219 Auto-Measure On Off Auto-Blank On Off End Experiment End Experiment

220 sample row

221 Related Topics

222
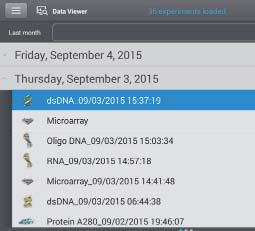
223 Open instrument database of measurement results

224 Search Select Export selected experiments row Select
225 Export Export OK Select Delete selected experiments row Select Delete OK

226 Open an experiment row experiment name
227 Spectral data

228 Data Table Menu
229 Related Topics Label new experiment when you save it Add Identifier Done End Experiment
230 Label experiment in Data Viewer Manage Identifiers Add Identifier Done OK View assigned labels for an experiment Find labeled experiments Search OK Remove a label Manage Identifiers OK

231 Export data at end of experiment
232 Export OK End Experiment Export data from Data Viewer row Select Export

233 Export OK Delete data from any measurement screen Delete data from Data Viewer row
234 Print data from any measurement screen Print OK Print data from Data Viewer row experiment name Print OK

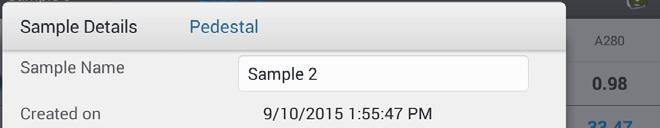
235 Print sample details OK Related Topics

236 View or change instrument settings Settings Wi-Fi Bluetooth Language Notice
237
238
239
240
241
242
243
244
245
246
247
248
249
250
251
252
253
254
255
256
257
258
259
260
261
262
263
264
265
266
267
268
269
270
271
272
273
274
275
276
277
278
279
280
281
282
283
284
285
286
287
288
289
290
291
292
293
294
295
296
297
298
299
300
301
302
303
304
305
306
307
308
309
310
311
312
INSTRUCTION MANUAL. VWR myspec spectrophotometer
 VWR myspec spectrophotometer INSTRUCTION MANUAL European Catalogue Numbers: VWR myspec 732-2533 VWR myspec Touch 732-2534 VWR myspec Twin 732-2535 VWR myspec Twin Touch 732-2536 Version: 2.0 Issued: 29
TL6 Ultra Micro-volume Spectrophotometer
 TL6 Ultra Micro-volume Spectrophotometer TL6 is the latest Ultra Micro-volume Spectrophotometer of PERSEE ANALYTICS. It is a small portable instrument for fast analysis of nucleic acid and protein concentrations
Operation Manual. SPECTRO-NANO4 Nucleic Acid Analyzer PLEASE READ THIS MANUAL CAREFULLY BEFORE OPERATION
 Operation Manual SPECTRO-NANO4 Nucleic Acid Analyzer PLEASE READ THIS MANUAL CAREFULLY BEFORE OPERATION 3, Hagavish st. Israel 58817 Tel: 972 3 5595252, Fax: 972 3 5594529 mrc@mrclab.com MRC. 4.18 Foreword
ND-1000 Spectrophotometer. V3.3 User s Manual
 ND-1000 Spectrophotometer V3.3 User s Manual NanoDrop Technologies, Inc. 3411 Silverside Road Bancroft Building Wilmington, DE 19810 USA Voice: 302-479-7707 Fax: 302-792-7155 Email: info@nanodrop.com www.nanodrop.com
ND-1000 Spectrophotometer. V3.5 User s Manual
 ND-1000 Spectrophotometer V3.5 User s Manual NanoDrop Technologies, Inc. 3411 Silverside Road Bancroft Building Wilmington, DE 19810 USA Voice: 302-479-7707 Fax: 302-792-7155 Email: info@nanodrop.com www.nanodrop.com
Microplate Spectrophotometer
 Microplate Spectrophotometer Features Benefits Applications Bali, October 1999 Optical System Xenon Flashing Lamp Order Sorting Filters Monochromator Data Light collection Light Transfer Why are these
Micro-Spectrohpotometer USERS MANUAL
 Nano-100 Micro-Spectrohpotometer USERS MANUAL Version 1.0 HANGZHOU ALLSHENG INSTRUMENTS CO., LTD. Foreword Thank you for purchasing our Products: Micro-Spectrohpotometer. This Manual for users contains
The Plus for your lab!
 BioPhotometer plus NEW! analysis system The Plus for your lab! The easy, rapid and reliable BioPhotometer plus analysis system See it clearly! UVette Precision in plastics The patented* 1 UVette is the
Spectrophotometer for Life Science. BioSpec-nano C101-E112D
 Spectrophotometer for Life Science BioSpec-nano C11-E112D BioSpec-nano Spectrophotometer for Life Science Drop-and-Start Analysis Automatic Optical Pathlength Setting & Automatic Wiping Low Carryover Achieved
Optical density measurements automatically corrected to a 1-cm pathlength with PathCheck Technology
 APPLICATION NOTE Optical density measurements automatically corrected to a 1-cm pathlength with PathCheck Technology Introduction UV/VIS spectrophotometers and microplate readers differ fundamentally in
Kinetics of Crystal Violet Bleaching
 Kinetics of Crystal Violet Bleaching Authors: V. C. Dew and J. M. McCormick* From Update March 12, 2013 with revisions Nov. 29, 2016 Introduction Chemists are always interested in whether a chemical reaction
The Determination of an Equilibrium Constant
 The Determination of an Equilibrium Constant Chemistry 102 10 Chemical reactions occur to reach a state of equilibrium. The equilibrium state can be characterized by quantitatively defining its equilibrium
Determining the Concentration of a Solution: Beer s Law
 Determining the Concentration of a Solution: Beer s Law LabQuest 11 The primary objective of this experiment is to determine the concentration of an unknown nickel (II) sulfate solution. You will be using
Nucleic Acid Quantitation in Microplates
 PHARMACEUTICAL application note Nucleic Acid Quantitation in Microplates HansWilly Mueller, Ph.D. J. Fenton Williams, Ph.D. Introduction Many molecular biology applications require the determination of
Low-volume, High Throughput Workflow for Analysis of Nucleic Acid Samples for Biobanking
 A p p l i c a t i o n N o t e Low-volume, High Throughput Workflow for Analysis of Nucleic Acid Samples for Biobanking Peter J. Brescia, Jr., Chris Wilson, and Peter Banks, BioTek Instruments, Inc., Winooski,
The Determination of an Equilibrium Constant
 LabQuest 10 The equilibrium state of a chemical reaction can be characterized by quantitatively defining its equilibrium constant, Keq. In this experiment, you will determine the value of Keq for the reaction
BioDrop DUO dsdna Application Note
 BioDrop DUO dsdna Application Note Using a BioDrop DUO spectrophotometer to measure the concentration of low volume samples of dsdna Micro-volume measurement of DNA is a routine application in many life
Nano Spectrophotometer LNS-A10
 Nano Spectrophotometer LNS-A10 Nano spectrophotometer with full spectrum light covers wide wavelength range of 200 to 800nm. It requires only 0.5-2.0µl micro-volume sample for measurement which takes place
Protocol for Use of BCMP Jasco J-815 Circular Dichroism Spectropolarimeter
 Protocol for Use of BCMP Jasco J-815 Circular Dichroism Spectropolarimeter Getting Started 1. Turn on the nitrogen: Open the valve on the nitrogen tank (max 10 psi) so that the pressure gauge on the left
NOTE: The color of the actual product may differ from the color pictured in this catalog due to printing limitation.
 NOTE: The color of the actual product may differ from the color pictured in this catalog due to printing limitation. SCANNING UV VISIBLE SPECTROPHOTOMETER Features SCANNING UV VISIBLE SPECTROPHOTOMETER
GE Healthcare Life Sciences. Spectrophotometry. Handbook
 GE Healthcare Life Sciences Spectrophotometry Handbook Contents Spectrophotometry basics 3 What is spectrophotometry? 3 Definition 3 Lambert s Law 4 Beer s Law 4 Nucleic acid applications 6 Direct UV measurement
Nucleic Acid Thermo Scientific NanoDrop Spectrophotometers
 Thermo Scientific NanoDrop Spectrophotometers Part of Thermo Fisher Scientific The information in this publication is provided for reference only. All information contained in this publication is believed
C101-E112. BioSpec-nano. Shimadzu Spectrophotometer for Life Science
 C101-E112 BioSpec-nano Shimadzu Spectrophotometer for Life Science Power of small. BioSpec-nano BioSpec-nano Shimadzu Spectrophotometer for Life Science Quick and Simple Nucleic Acid Quantitation Drop-and-Click
Instructor s Advance Preparation
 INSTRUCTOR'S MANUAL Instructor s Advance Preparation This protocol is designed for 80 workstations of 4 students. Each group will prepare a set of standards, a blank, and 2 milk samples (can be a blind
SuperCELL Data Programmer and ACTiSys IR Programmer User s Guide
 SuperCELL Data Programmer and ACTiSys IR Programmer User s Guide This page is intentionally left blank. SuperCELL Data Programmer and ACTiSys IR Programmer User s Guide The ACTiSys IR Programmer and SuperCELL
Jasco V-670 absorption spectrometer
 Laser Spectroscopy Labs Jasco V-670 absorption spectrometer Operation instructions 1. Turn ON the power switch on the right side of the spectrophotometer. It takes about 5 minutes for the light source
Using SkyTools to log Texas 45 list objects
 Houston Astronomical Society Using SkyTools to log Texas 45 list objects You can use SkyTools to keep track of objects observed in Columbus and copy the output into the Texas 45 observation log. Preliminary
An ultra-sensitive, versatile, and affordable single tube luminometer for Life Science Research.
 p e r s o n a l D E T E C T I O N N o w, y o u c a n o p t i m i z e y o u r p e r s o n a l w o r k f l o w. P r o m e g a i n s t r u m e n t s a n d r e a g e n t s i n t e g r a t e e a s i l y. An
Instytut Fizyki Doświadczalnej Wydział Matematyki, Fizyki i Informatyki UNIWERSYTET GDAŃSKI
 Instytut Fizyki Doświadczalnej Wydział Matematyki, Fizyki i Informatyki UNIWERSYTET GDAŃSKI Experiment 20 : Studying light absorption in terphenyl I. Background theory. 1. 2. 3. 4. 5. 6. 7. Electromagnetic
Experiment 2: The Beer-Lambert Law for Thiocyanatoiron (III)
") Chem 1B Saddleback College Dr. White 1 Experiment 2: The Beer-Lambert Law for Thiocyanatoiron (III) Objectives To use spectroscopy to relate the absorbance of a colored solution to its concentration. To
Chem 1B Saddleback College Dr. White 1 Experiment 2: The Beer-Lambert Law for Thiocyanatoiron (III) Objectives To use spectroscopy to relate the absorbance of a colored solution to its concentration. To
L-malic acid measurement in wines using the SpectraMax Plus 384 Microplate Reader
 APPLICATION NOTE L-malic acid measurement in wines using the SpectraMax Plus 384 Microplate Reader Introduction Analysis of malic acid, residual sugar, volatile acidity and ammonia is very important for
Determining the Concentration of a Solution: Beer s Law
 Determining the Concentration of a Solution: Beer s Law Vernier Spectrometer 1 The primary objective of this experiment is to determine the concentration of an unknown copper (II) sulfate solution. You
ProMass Deconvolution User Training. Novatia LLC January, 2013
 ProMass Deconvolution User Training Novatia LLC January, 2013 Overview General info about ProMass Features Basics of how ProMass Deconvolution works Example Spectra Manual Deconvolution with ProMass Deconvolution
Application Note TABLE OF CONTENTS
 Application Note 25 Making optical density measurements automatically corrected to a 1 cm pathlength in the SPECTRAmax PLUS microplate spectrophotometer (The three P s of Pathcheck : Principle, Procedures
REVIEW OF LAB TECHNIQUES
 Experiment 1 REVIEW OF LAB TECHNIQUES Prepared by Masanobu M. Yamauchi and Ross S. Nord, Eastern Michigan University PURPOSE To review density calculations, Beer s Law and the use of electronic balances,
Biochrom Libra. UV-Visible Spectrophotometers. High performance instruments with added application value for academia, research and industry
 New Double Beam Spectrophotometers Biochrom Libra UV-Visible Spectrophotometers High performance instruments with added application value for academia, research and industry Biochrom Libra Real Choice
Ocean Optics Red Tide UV-VIS Spectrometer (Order Code: SPRT-UV-VIS)
") Ocean Optics Red Tide UV-VIS Spectrometer (Order Code: SPRT-UV-VIS) The UV-VIS spectrometer is a portable ultraviolet light and visible light spectrophotometer, combining a spectrometer and a light source/cuvette
Ocean Optics Red Tide UV-VIS Spectrometer (Order Code: SPRT-UV-VIS) The UV-VIS spectrometer is a portable ultraviolet light and visible light spectrophotometer, combining a spectrometer and a light source/cuvette
Determination of the Rate of a Reaction, Its Order, and Its Activation Energy
 Determination of the Rate of a Reaction, Its Order, and Its Activation Energy Reaction kinetics is defined as the study of the rates of chemical reactions and their mechanisms. Reaction rate is simply
Connect the Vernier spectrometer to your lap top computer and power the spectrometer if necessary. Start LoggerPro on your computer.
 Connect the Vernier spectrometer to your lap top computer and power the spectrometer if necessary. Start LoggerPro on your computer. The screen shown in Fig. 1 may be displayed. If status line displays
Colorimetric Protein Assays Thermo Scientific NanoDrop Spectrophotometers
 Colorimetric Protein Assays Thermo Scientific NanoDrop Spectrophotometers Part of Thermo Fisher Scientific Colorimetric Protein Assays The information in this publication is provided for reference only.
PRELIMINARY ACTIVITY FOR
 PRELIMINARY ACTIVITY FOR Beer s Law Investigations Guided Inquiry Version Experiment 11 The primary objective of this Preliminary Activity is to determine the concentration of an unknown copper (II) sulfate
HOOK -Psoralen-PEO-Biotin
 406PR-01 G-Biosciences 1-800-628-7730 1-314-991-6034 technical@gbiosciences.com A Geno Technology, Inc. (USA) brand name HOOK -Psoralen-PEO-Biotin A photoreactive reagent for biotinylation of nucleic acids
Protein extraction and quantification by Teresa Fan, University of Kentucky BUFFER PREPARATION AND STORAGE
 Protein extraction and quantification by Teresa Fan, University of Kentucky Note: This procedure follows [Fan_Extract_Polar_Lipid_Prot_SOP] Step 11 (middle part, in 1.5 ml tube). BUFFER PREPARATION AND
Biology 3B LABORATORY Quantitative determination of chlorophyll using spectroscopy
 Biology 3B LABORATORY Quantitative determination of chlorophyll using spectroscopy Objectives Gain an understanding of the Beer-Lambert Law Use this principle to quantify the concentration of total chlorophyll
Determining the Concentration of a Solution: Beer s Law
 Determining the Concentration of a Solution: Beer s Law The primary objective of this experiment is to determine the concentration of an unknown cobalt (II) chloride solution. You will use a Vernier SpectroVis
Lecture 5. More on UV-visible Spectrophotometry: Beer s Law and Measuring Protein Concentration
 Biological Chemistry Laboratory Biology 3515/Chemistry 3515 Spring 2018 Lecture 5 More on UV-visible Spectrophotometry: Beer s Law and Measuring Protein Concentration 23 January 2018 c David P. Goldenberg
MassHunter Software Overview
 MassHunter Software Overview 1 Qualitative Analysis Workflows Workflows in Qualitative Analysis allow the user to only see and work with the areas and dialog boxes they need for their specific tasks A
Determining the Concentration of a Solution: Beer s Law. Evaluation copy. Figure 1
 Determining the Concentration of a Solution: Beer s Law Computer 17 The primary objective of this experiment is to determine the concentration of an unknown copper (II) sulfate solution. You will use a
Agilent MassHunter Quantitative Data Analysis
 Agilent MassHunter Quantitative Data Analysis Presenters: Howard Sanford Stephen Harnos MassHunter Quantitation: Batch and Method Setup Outliers, Data Review, Reporting 1 MassHunter Quantitative Analysis
Photosynthesis. LabQuest OBJECTIVES
 Photosynthesis LabQuest 4B The process of photosynthesis involves the use of energy to convert carbon dioxide and water into sugar, oxygen, and other organic compounds. This process is often summarized
LightCycler 480 Instrument Quick Guide Relative Quantification
 LightCycler 480 Instrument Quick Guide Relative Quantification Performing a Relative Quantification Analysis: 1. Open the experiment that you want to analyze in main window 1. 2. If sample information
Absorption Spectra of Conjugated Molecules
 Expt 1: Absorption Spectra of onjugated Molecules EM 361 Introduction Absorption Spectra of onjugated Molecules The purpose of this experiment is to measure the absorption spectra of two series of cyanine
BIOLIGHT STUDIO IN ROUTINE UV/VIS SPECTROSCOPY
 BIOLIGHT STUDIO IN ROUTINE UV/VIS SPECTROSCOPY UV/Vis Spectroscopy is a technique that is widely used to characterize, identify and quantify chemical compounds in all fields of analytical chemistry. The
Spectrophotometric quantification of nucleic acids using the nanovette microliter cell accessory with a DU 730 spectrophotometer
 Application Information Spectrophotometric quantification of nucleic acids using the nanovette microliter cell accessory with a DU 730 spectrophotometer Amy Yoder, Mary Blair, Kenny Abell Beckman Coulter,
Concentrations that absorb. Measuring percentage transmittance of solutions at different concentrations
 Measuring percentage transmittance of solutions at different Dimension 2 Cross Cutting Concepts Dimension 1 Science and Engineering Practices FRAMEWORK FOR K-12 SCIENCE EDUCATION 2012 Concentrations that
University of Minnesota Nano Center Standard Operating Procedure
 University of Minnesota Nano Center Standard Operating Procedure Equipment Name: Zeta Potential Analyzer Model: Stabino Location: PAN 185 Badger Name: Not on Badger Revision Number: 0-Inital release Revisionist:
REVIEW OF LAB TECHNIQUES
 Experiment 1 REVIEW OF LAB TECHNIQUES Prepared by Masanobu M. Yamauchi and Ross S. Nord, Eastern Michigan University PURPOSE To review density calculations, Beer s Law and the use of electronic balances,
AP Chemistry Laboratory #15: Reaction Rate of Crystal Violet and Sodium Hydroxide. Lab days: Thursday and Friday, February 1-2, 2018
 AP Chemistry Laboratory #15: Reaction Rate of Crystal Violet and Sodium Hydroxide Lab days: Thursday and Friday, February 1-2, 2018 Lab due: TBD Goal (list in your lab book): The goal of this lab is to
Lab 5: Calculating an equilibrium constant
 Chemistry 162 The following write-up is inaccurate for the particular chemicals we are using. Please have all sections up through and including the data tables ready before class on Wednesday, February
Building Inflation Tables and CER Libraries
 Building Inflation Tables and CER Libraries January 2007 Presented by James K. Johnson Tecolote Research, Inc. Copyright Tecolote Research, Inc. September 2006 Abstract Building Inflation Tables and CER
Qubit RNA IQ Assay Kits
 USER GUIDE Qubit RNA IQ s Catalog No. Q33221, Q33222 Pub. No. MAN0017405 Rev. B.0 Product information The Qubit RNA IQ provides a fast, simple method to check whether an RNA sample has degraded using the
Size Determination of Gold Nanoparticles using Mie Theory and Extinction Spectra
 Size Determination of Gold Nanoparticles using Mie Theory and Extinction Spectra OUTLINE OF THE PROCEDURE A) Measure the extinction spectra of each of your samples. B) Model the extinction spectrum of
Introduction to Spectroscopy: Analysis of Copper Ore
 Introduction to Spectroscopy: Analysis of Copper Ore Using a Buret and Volumetric Flask: 2.06 ml of solution delivered 2.47 ml of solution delivered 50.00 ml Volumetric Flask Reading a buret: Burets are
Using the Budget Features in Quicken 2008
 Using the Budget Features in Quicken 2008 Quicken budgets can be used to summarize expected income and expenses for planning purposes. The budget can later be used in comparisons to actual income and expenses
Bloomsburg University Weather Viewer Quick Start Guide. Software Version 1.2 Date 4/7/2014
 Bloomsburg University Weather Viewer Quick Start Guide Software Version 1.2 Date 4/7/2014 Program Background / Objectives: The Bloomsburg Weather Viewer is a weather visualization program that is designed
Dr. OligoTM DNA / RNA / OLIGO SYNTHESIZERS
 Dr. OligoTM DNA / RNA / OLIGO SYNTHESIZERS High Throughput Oligo Synthesis Synthesize Cleave Deprotect Desalt Elute Dr. Oligo TM The Dr. Oligo TM High Throughput Oligo Synthesizer is available in four
Meet Stunner: The one-shot protein concentration and sizing combo
 TECH NOTE Meet Stunner: The one-shot protein concentration and sizing combo Introduction What if you could get a better read on the quality of your biologics and use less sample at the same time? Stunner
Experiment 1 Chemical Kinetics 1
 Experiment 1 Chemical Kinetics 1 Purpose: Determine the rate law for the reaction of the dye crystal violet with hydroxide. Reading: Brown, et. al., Chemistry The Central Science, sections 14.1 14.4. Introduction
UV/VIS SPECTROMETRIC DETERMINATION OF AN EQUILIBRIUM CONSTANT
 EXPERIMENT 8 UV/VIS SPECTROMETRIC DETERMINATION OF AN EQUILIBRIUM CONSTANT A. Prelab Perform the experimental portion of the lab in groups of 68. Divide the work so everyone participates. You have one
Experiment 2: The Beer-Lambert Law for Thiocyanatoiron (III)
") Chem 1B Dr. White 11 Experiment 2: The Beer-Lambert Law for Thiocyanatoiron (III) Objectives To use spectroscopy to relate the absorbance of a colored solution to its concentration. To prepare a Beer s
Chem 1B Dr. White 11 Experiment 2: The Beer-Lambert Law for Thiocyanatoiron (III) Objectives To use spectroscopy to relate the absorbance of a colored solution to its concentration. To prepare a Beer s
Tutorial. Getting started. Sample to Insight. March 31, 2016
 Getting started March 31, 2016 Sample to Insight CLC bio, a QIAGEN Company Silkeborgvej 2 Prismet 8000 Aarhus C Denmark Telephone: +45 70 22 32 44 www.clcbio.com support-clcbio@qiagen.com Getting started
Rate Law Determination of the Crystal Violet Reaction. Evaluation copy
 Rate Law Determination of the Crystal Violet Reaction Computer 30 In this experiment, you will observe the reaction between crystal violet and sodium hydroxide. One objective is to study the relationship
Getting started with BatchReactor Example : Simulation of the Chlorotoluene chlorination
 Getting started with BatchReactor Example : Simulation of the Chlorotoluene chlorination 2011 ProSim S.A. All rights reserved. Introduction This document presents the different steps to follow in order
Quantitative Determination of Proteins
 Application Note UV-0003-E Quantitative Determination of Proteins Generally, the concentration of proteins is measured using UV-Vis spectrophotometers. The JASCO V-630 Bio (Figure 1) is a UV/Vis spectrophotometer
Qubit dsdna BR Assay Kits
 Qubit dsdna BR s For use with the Qubit Fluorometer (all models) Catalog nos. Q32850, Q32853 Online Specials Table 1 Contents and storage Material Q32850 (100 assays) Amount Q32853 (500 assays) Concentration
EZ Read 2000 Microplate Reader User Manual. Biochrom Ltd 22 Cambridge Science Park Cambridge UK CB4 0FJ Tel.: +44/
 EZ Read 2000 Microplate Reader User Manual Biochrom Ltd 22 Cambridge Science Park Cambridge UK CB4 0FJ Tel.: +44/1223 423723 1 Table of Contents 1. INTRODUCTION AND INTENDED USE....4 1.1 WHAT TO EXPECT
Using Dolphin-1D microtiter assay to establish protein
 Using Dolphin-1D microtiter assay to establish protein concentration with the Lowry protein assay MATERIAL BSA (Sigma-Aldrich, St Louis, MO, U.S.A.) 1 mg/ml diluted in 0.01 M PBS ph 7.4. Lowry reagents:
Measure - Conductivity STANDARD Last std: Sep 10:17 am. Touch meas to measure sample. Touch std to access standardize mode ATC. 25.
 Conductivity Operation accumet Measure - Conductivity us/cm channel 1 STANDARD Last : Sep 17 @ 10:17 am The meter will automatically convert conductivity values to salinity, total dissolved solids (TDS),
Spectrometer User s Guide
 Spectrometer User s Guide (Order Codes: V-SPEC, SPRT-VIS, SP-VIS, SP-UV-VIS, ESRT-VIS) The spectrometer is a portable light spectrophotometer, combining a spectrometer and a light source/cuvette holder.
Table of content. Understanding workflow automation - Making the right choice Creating a workflow...05
 Marketers need to categorize their audience to maximize their r e a c h. Z o h o C a m p a i g n s a u t o m a t e s r e c i p i e n t c l a s s i fi c a t i o n a n d action performance to free up marketers
Protein assay of SpectroArt 200
 Technical Bulletin 14 SpectroArt 200 12/01/2008 Protein assay of SpectroArt 200 MATERIAL BSA: Albumin, bovine serum (Sigma) PBS: BupH TM Phosphate Buffered Saline packs (PIERCE) Bradford assay: Bio-Rad
TitriSoft 2.5. Content
 Content TitriSoft 2.5... 1 Content... 2 General Remarks... 3 Requirements of TitriSoft 2.5... 4 Installation... 5 General Strategy... 7 Hardware Center... 10 Method Center... 13 Titration Center... 28
ON SITE SYSTEMS Chemical Safety Assistant
 ON SITE SYSTEMS Chemical Safety Assistant CS ASSISTANT WEB USERS MANUAL On Site Systems 23 N. Gore Ave. Suite 200 St. Louis, MO 63119 Phone 314-963-9934 Fax 314-963-9281 Table of Contents INTRODUCTION
Introduction to Spectroscopy: Analysis of Copper Ore
 Introduction to Spectroscopy: Analysis of Copper Ore Using a Buret and Volumetric Flask: 2.06 ml of solution 2.47 ml of solution 50.00 ml delivered delivered Volumetric Flask Reading a buret: Burets are
Spectrophotometric Determination of pka of Phenol Red
 Spectrophotometric Determination of pka of Phenol Red This experiment uses instrumentation to accomplish quantitative analysis. You will get far more experience in this during CH427 if you are a Chemistry
FireFamilyPlus Version 5.0
 FireFamilyPlus Version 5.0 Working with the new 2016 NFDRS model Objectives During this presentation, we will discuss Changes to FireFamilyPlus Data requirements for NFDRS2016 Quality control for data
Protein Quantification Kit (Bradford Assay)
") Protein Quantification Kit (Bradford Assay) Booklet Item NO. KTD3002 Product Name Protein Quantification Kit (Bradford Assay) ATTENTION For laboratory research use only. Not for clinical or diagnostic
Protein Quantification Kit (Bradford Assay) Booklet Item NO. KTD3002 Product Name Protein Quantification Kit (Bradford Assay) ATTENTION For laboratory research use only. Not for clinical or diagnostic
Appendix B Microsoft Office Specialist exam objectives maps
 B 1 Appendix B Microsoft Office Specialist exam objectives maps This appendix covers these additional topics: A Excel 2003 Specialist exam objectives with references to corresponding material in Course
Stoichiometric Reactor Simulation Robert P. Hesketh and Concetta LaMarca Chemical Engineering, Rowan University (Revised 4/8/09)
") Stoichiometric Reactor Simulation Robert P. Hesketh and Concetta LaMarca Chemical Engineering, Rowan University (Revised 4/8/09) In this session you will learn how to create a stoichiometric reactor model
Stoichiometric Reactor Simulation Robert P. Hesketh and Concetta LaMarca Chemical Engineering, Rowan University (Revised 4/8/09) In this session you will learn how to create a stoichiometric reactor model
UV-Vis optical fiber assisted spectroscopy in thin films and solutions
 UV-Vis optical fiber assisted spectroscopy in thin films and solutions Description UV-Visible absorption and transmission spectra provide fundamental information for all experiments related to the attenuation
PREPARATION FOR CHEMISTRY LAB: FLUORIDE IN WATER
 1 Name: Lab Instructor: PREPARATION FOR CHEMISTRY LAB: FLUORIDE IN WATER On these problems, the solvent is water and the solution is sufficiently dilute so that the density of the solution is the same
PowerWaveX Select and KC4 : A Multifunctional System for Today s Laboratory Environment
 PowerWaveX Select and KC4 : A Multifunctional System for Today s Laboratory Environment Figure 1. PowerWaveX Select Microplate Spectrophotometer Introduction With today's requirements for high throughput,
Zetasizer Nano-ZS User Instructions
 Zetasizer Nano-ZS User Instructions 1. Activate the instrument computer by logging in to CORAL. If needed, log in to the local instrument computer Username: zetasizer. Password: zetasizer. 2. Instrument
Introduction to Chemistry Techniques Prelab (Week 1) 2. Determine the number of significant figures in each of the following numbers.
 2. Determine the number of significant figures in each of the following numbers.") Introduction to Chemistry Techniques Prelab (Week 1) Name Total /10 SHOW ALL WORK NO WORK = NO CREDIT 1. What is the purpose of this experiment? 2. Determine the number of significant figures in each of
Introduction to Chemistry Techniques Prelab (Week 1) Name Total /10 SHOW ALL WORK NO WORK = NO CREDIT 1. What is the purpose of this experiment? 2. Determine the number of significant figures in each of
Investigating Food Dyes in Sports Beverages. Sample
 Investigating Food Dyes in Sports Beverages Investigation 1 There are many different brands of beverages that fall under the general category of sports drinks. Most of these beverages contain an FD&C food
Qubit RNA XR Assay Kits
 USER GUIDE Qubit RNA XR s Catalog No. Q33223, Q33224 Pub. No. MAN0017501 Rev. B.0 Product information The Qubit RNA XR (Extended Range) s make quantitation of total RNA, rrna, or large mrna easy and accurate.
Qubit 4 Fluorometer. Catalog Number Q Publication Number MAN Revision B.0. For Research Use Only. Not for use in diagnostic procedures.
 Qubit 4 Fluorometer Catalog Number Q33226 Publication Number MAN0017209 Revision B.0 For Research Use Only. Not for use in diagnostic procedures. Manufacturer: Life Technologies Holdings Pte Ltd Block
Beer's Law and Data Analysis *
 OpenStax-CNX module: m15131 1 Beer's Law and Data Analysis * Mary McHale This work is produced by OpenStax-CNX and licensed under the Creative Commons Attribution License 2.0 1 Beer's Law and Data Analysis
Qubit RNA BR Assay Kits
 Qubit RNA BR s For use with the Qubit Fluorometer (all models) Catalog nos. Q10210, Q10211 Table 1. Contents and storage Material Q10210 (100 assays) Amount Q10211 (500 assays) Concentration Storage Stability
Technical Procedure for Glass Refractive Index Measurement System 3 (GRIM 3)
") Technical Procedure for Glass Refractive Index Measurement System 3 (GRIM 3) 1.0 Purpose - This technical procedure shall be followed for the operation of the GRIM 3. 2.0 Scope - This procedure applies
Technical Procedure for Glass Refractive Index Measurement System 3 (GRIM 3) 1.0 Purpose - This technical procedure shall be followed for the operation of the GRIM 3. 2.0 Scope - This procedure applies