Instytut Fizyki Doświadczalnej Wydział Matematyki, Fizyki i Informatyki UNIWERSYTET GDAŃSKI
|
|
|
- Lewis Craig
- 5 years ago
- Views:
Transcription


1 Instytut Fizyki Doświadczalnej Wydział Matematyki, Fizyki i Informatyki UNIWERSYTET GDAŃSKI

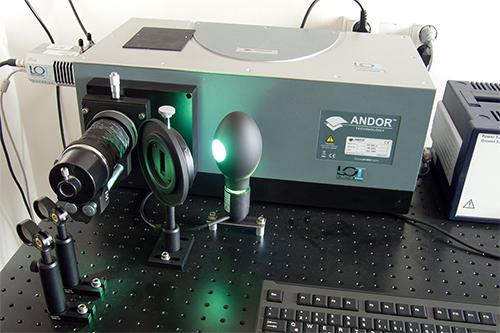
2 Experiment 20 : Studying light absorption in terphenyl I. Background theory Electromagnetic radiation: nature, characteristics, spectrum. Classification of molecular spectra. Spectroscopy and division by spectral range. Spectroscopic equipment. Construction and operation of a spectrophotometer. Molecular internal energy (division, simple models of molecules, energy states). Transitions between molecular energy states: a) spectra corresponding to these transitions; b) selection rules; c) electronic transitions. 8. Light absorption in solutions: a) light absorption law; b) absorption coefficient; c) molar extinction coefficient; d) oscillator power and its relationship with the absorption coefficient; e) relationship of the absorption spectrum with the average lifetime of the molecule. 9. Effect of a solvent on the absorption spectra (response field). 10. Preparing solutions of a specific concentration. II. Experimental tasks. 1. Refer to the setup shown in Picture 1. Picture 1. Setup for measuring absorption spectra: 1 computer; 2 spectrophotometer UV Instytut Fizyki Doświadczalnej 1.
3 2. Prepare five solutions of p-quaterphenyl in cyclohexane with concentrations ranging from 2, mol/l do 2, mol/l. 3. Refer to the instructions found in the Appendix. 4. Measure the absorption spectrum in the range nm according to the instruction manual. 5. Based on the experimental results for each concentration of the solutions, plot a set of graphs: absorbance vs. wavelength; molar extinction coefficient vs. wavelength; molar extinction coefficient vs. wave number. 6. Tabulate your results including columns for maximum absorption wavelength, absorbance, molar absorption coefficients, molar extinction coefficients, integrals of the molar extinction coefficient and spectrum half-width. 7. Calculate: oscillator power of the observed electron transition; natural life span in an excited state. 8. Analyse the results for possible deviations from the absorption laws. III. Apparatus. 1. Spectrophotometer Shimadzu UV mini Computer. IV. Literature. 1. G.M. Barrow Introduction to Molecular Spectroscopy, McGraw Hill, New York J.P. Simons Photochemistry and Spectroscopy, Wiley, H. Haken, H. Ch. Wolf Molecular Physics and Elements of Quantum Chemistry, Springer, Instytut Fizyki Doświadczalnej 2.


4 Appendix Instruction manual for measuring absorption spectra I. Turning on the spectrophotometer. 1. Turn on the computer and monitor. 2. Turn on the spectrophotometer (switch is located on the back of the spectrophotometer). The power-on initialization process will begin, which tests each individual component. After completing the initialization, the spectrophotometer screen should appear as in Figure 2. Figure 2. Spectrophotometer screen after initialization. For optimal working conditions, you should wait at least 10 minutes after initialization of the spectrophotometer. II. Setting the measurement parameters. From the mode menu (Figure 3), select option 2.Spectrum. Figure 3. Spectrophotometer screen ready for work. Instytut Fizyki Doświadczalnej 3.

5 Experiment 20 : Studying light absorption in terphenyl The spectrophotometer screen will look as in Figure 4. Figure 4. Screen for setting measurement parameters for measuring spectra Using the spectrophotometer s keyboard, enter the following parameters: 1.Meas. mode : ABS 2.λ range : 450 nm ~ 250 nm 3.Rec. range : 0.00A ~ 2.00A 4.Scan speed : Slow 5.No. of scans : 1 6.Display mode : Sequential III. Baseline measurements. Baseline measurements must be made because of the need to take into account the spectral properties of both the cuvette (which must be identical to the cuvette used in performing spectral measurements of the prepared solutions) and the solvent in which the test substance is dissolved. To do this, insert the cuvette with pure solvent in the cuvette holder, as shown in Picture 5. Picture 5. View of the open spectrophotometer sample chamber: 1 cuvette holder. Instytut Fizyki Doświadczalnej 4.
 in Picture 6.")
6 Experiment 20 : Studying light absorption in terphenyl After placing the cuvette in the holder and closing the spectrophotometer chamber, run the baseline measurement by pressing F1 (BaseCorr). The measurement should be stopped by pressing START/STOP, when you reach a wavelength of 250 nm. The area on the spectrophotometer LCD showing the wavelength is shown in (1) in Picture 6. Picture 6. Spectrophotometer screen while measuring the baseline: 1 area displaying wavelength. After the baseline measurement, remove the pure solvent cuvette from the cuvette holder. IV. Measuring absorption spectra. Place the cuvette with the test solution in the holder inside the spectrophotometer sample chamber (Picture 5). After closing the chamber of the spectrophotometer, start the absorption spectrum measurement by pressing START/STOP. A view of the screen during the measurement of the absorption spectrum is shown in Picture 7. Picture 7. Spectrophotometer Screen while measuring an absorption spectrum. Instytut Fizyki Doświadczalnej 5.
. The screen should then look as in Figure 3.")

7 V. Recording the data to the computer. After completing measurements, the data should be sent to the computer. To do this, the spectrophotometer must be set in file transfer mode. This requires changing the mode of the spectrophotometer (by pressing RETURN twice). The screen should then look as in Figure 3. In this mode, press F3 (FileTrans) to prepare the spectrophotometer to transfer files. The spectrophotometer screen should appear as follows (Picture 8): Picture 8. Spectrophotometer screen in file transfer mode. To exit the file transfer mode after finishing the transmission, press RETURN. Start the UV Data Manager program on your computer by double clicking the mouse on the program icon (Picture 9). Picture 9. View of the desktop. Instytut Fizyki Doświadczalnej 6.

. Picture 11.")
, data will be transferred to the computer and the window")
8 After starting the program, the following window will appear (Picture 10): Picture 10. UV Data Manager program window. Connect the computer with the spectrophotometer by clicking once on Connect. This brings up a window with a question about the choice of data port (Picture 11). Picture 11. Data transmission port selection window. After selecting COM4 (by pressing OK), data will be transferred to the computer and the window will look as in Picture 12. Picture 12. UV Data Manager window after data acquisition from the spectrophotometer. Instytut Fizyki Doświadczalnej 7.

 and enter a filename according to the scheme described below.")
, HX (hexane), etc.")
9 Recorded data (absorption curves in the form of a table of wavelengths and photometric values and measurement parameters) are always saved in the file Original (shown in the window Photometer ) which should be saved to the computer and marked with the selected channel Ch, as shown in Picture 12. The folder Dane MUST be chosen as the target in the Directories window. The pop-up window Target must have the property Data. After clicking Save, a dialogue box opens enabling the user to save a file to the disk. From the list File Type, choose Text (*.csv) and enter a filename according to the scheme described below. For the sake of order in the Dane folder, and to make it easier to identify your own data, use the following naming convention: XY_Substance_Solvent_concentration_range_date.CSV where: XY - Your initials Substance - substance abbreviation e.g. POPOP, PPO, 2MPOPOP, STILBEN Solvent - name of the solvent: MeOH, CH (cyclohexane), HX (hexane), etc. concentration - 2-5e-4 = 2, mol/l range - e.g nm date Because of the way data is saved by the spectrophotometer and the data transmission format between the spectrophotometer and the computer, every measurement must be transferred to your computer and saved in accordance with the instructions above. Currently, it is not possible to make multiple measurements with the spectrophotometer and transfer them to the computer later. Each absorption spectrum measurement should be sent to the computer as soon as it is recorded (after setting the spectrophotometer to file transfer mode as detailed above) by clicking Update in the UV Data Manager program window (Picture 12). When importing data into the Origin software package, use the CSV format. Data is saved in a CSV file with the following format: 500,0, 0, ,5, 0, ,0, 0, ,5, 0, ,0, 0, ,5, 0, ,0, 0,0027 etc. Instytut Fizyki Doświadczalnej 8.
Jasco V-670 absorption spectrometer
 Laser Spectroscopy Labs Jasco V-670 absorption spectrometer Operation instructions 1. Turn ON the power switch on the right side of the spectrophotometer. It takes about 5 minutes for the light source
Measuring ph with Smart Cuvettes
 1 Measuring ph with Smart Cuvettes Hardware Setup for ph Measurements ph is measured in Absorbance mode. Configure your spectroscopy components for Absorbance measurements. Sample Absorbance setups for
UV-Vis optical fiber assisted spectroscopy in thin films and solutions
 UV-Vis optical fiber assisted spectroscopy in thin films and solutions Description UV-Visible absorption and transmission spectra provide fundamental information for all experiments related to the attenuation
Experiment 2: The Beer-Lambert Law for Thiocyanatoiron (III)
") Chem 1B Saddleback College Dr. White 1 Experiment 2: The Beer-Lambert Law for Thiocyanatoiron (III) Objectives To use spectroscopy to relate the absorbance of a colored solution to its concentration. To
Chem 1B Saddleback College Dr. White 1 Experiment 2: The Beer-Lambert Law for Thiocyanatoiron (III) Objectives To use spectroscopy to relate the absorbance of a colored solution to its concentration. To
Instytut Fizyki Doświadczalnej Wydział Matematyki, Fizyki i Informatyki UNIWERSYTET GDAŃSKI
 Instytut Fizyki Doświadczalnej Wydział Matematyki, Fizyki i Informatyki UNIWERSYTET GDAŃSKI I. Background theory. 1. Fundamentals of band theory. 2. Classification of solids using band theory. 3. Intrinsic
Experiment 2: The Beer-Lambert Law for Thiocyanatoiron (III)
") Chem 1B Dr. White 11 Experiment 2: The Beer-Lambert Law for Thiocyanatoiron (III) Objectives To use spectroscopy to relate the absorbance of a colored solution to its concentration. To prepare a Beer s
Chem 1B Dr. White 11 Experiment 2: The Beer-Lambert Law for Thiocyanatoiron (III) Objectives To use spectroscopy to relate the absorbance of a colored solution to its concentration. To prepare a Beer s
Lab 5: Calculating an equilibrium constant
 Chemistry 162 The following write-up is inaccurate for the particular chemicals we are using. Please have all sections up through and including the data tables ready before class on Wednesday, February
Instytut Fizyki Doświadczalnej Wydział Matematyki, Fizyki i Informatyki UNIWERSYTET GDAŃSKI
 Instytut Fizyki Doświadczalnej Wydział Matematyki, Fizyki i Informatyki UNIWERSYTET GDAŃSKI I. Background theory. 1. Uniform circular motion: a) angular velocity; b) linear velocity; c) torque; d) power
Instytut Fizyki Doświadczalnej Wydział Matematyki, Fizyki i Informatyki UNIWERSYTET GDAŃSKI
 Instytut Fizyki Doświadczalnej Wydział Matematyki, Fizyki i Informatyki UNIWERSYTET GDAŃSKI Experiment 13 : Electron beam diffraction on a layer of polycrystalline graphite I. Background theory. 1. Wave
Connect the Vernier spectrometer to your lap top computer and power the spectrometer if necessary. Start LoggerPro on your computer.
 Connect the Vernier spectrometer to your lap top computer and power the spectrometer if necessary. Start LoggerPro on your computer. The screen shown in Fig. 1 may be displayed. If status line displays
Photoluminescence Spectrometer (FLS980)
") Photoluminescence Spectrometer (FLS980) Instrument Summary: The Edinburgh Instruments FLS980 photoluminescence spectrometer offers both steady state and time resolved (lifetime) fluorescence spectroscopy
Photoluminescence Spectrometer (FLS980) Instrument Summary: The Edinburgh Instruments FLS980 photoluminescence spectrometer offers both steady state and time resolved (lifetime) fluorescence spectroscopy
Effect of mass attached to the spring: 1. Replace the small stopper with the large stopper. Repeat steps 3-9 for each spring set.
 EXERCISE 1: Representing molecular vibrations with spring oscillations A spring is a common model for covalent chemical bonds. One of the interesting interpretations of quantum mechanics is that bonds
Beer-Lambert law Decomposition of the manganese oxalate ion
 A34 Beer-Lambert law Decomposition of the manganese oxalate ion Task: 1. Determine the wavelength of maximal absorbance λ max of a hydrated Cu(NH 3 ) 4 2+ complex in the wavelength region of 400 to 800
Kinetics of Crystal Violet Bleaching
 Kinetics of Crystal Violet Bleaching Authors: V. C. Dew and J. M. McCormick* From Update March 12, 2013 with revisions Nov. 29, 2016 Introduction Chemists are always interested in whether a chemical reaction
Determining the Concentration of a Solution: Beer s Law
 Determining the Concentration of a Solution: Beer s Law The primary objective of this experiment is to determine the concentration of an unknown cobalt (II) chloride solution. You will use a Vernier SpectroVis
Lab 1 Uniform Motion - Graphing and Analyzing Motion
 Lab 1 Uniform Motion - Graphing and Analyzing Motion Objectives: < To observe the distance-time relation for motion at constant velocity. < To make a straight line fit to the distance-time data. < To interpret
Size Determination of Gold Nanoparticles using Mie Theory and Extinction Spectra
 Size Determination of Gold Nanoparticles using Mie Theory and Extinction Spectra OUTLINE OF THE PROCEDURE A) Measure the extinction spectra of each of your samples. B) Model the extinction spectrum of
Spectroelectrochemistry Part 2: Experiments and Data evaluation
 Spectroelectrochemistry Part 2: Experiments and Data evaluation Purpose of This Note This application note is part 2 of a series of notes introducing Gamry s spectroelectrochemistry system. Part 1 discusses
X-ray spectroscopy: Experimental studies of Moseley s law (K-line x-ray fluorescence) and x-ray material s composition determination
 and x-ray material s composition determination") Uppsala University Department of Physics and Astronomy Laboratory exercise X-ray spectroscopy: Experimental studies of Moseley s law (K-line x-ray fluorescence) and x-ray material s composition determination
Uppsala University Department of Physics and Astronomy Laboratory exercise X-ray spectroscopy: Experimental studies of Moseley s law (K-line x-ray fluorescence) and x-ray material s composition determination
Ocean Optics Red Tide UV-VIS Spectrometer (Order Code: SPRT-UV-VIS)
") Ocean Optics Red Tide UV-VIS Spectrometer (Order Code: SPRT-UV-VIS) The UV-VIS spectrometer is a portable ultraviolet light and visible light spectrophotometer, combining a spectrometer and a light source/cuvette
Ocean Optics Red Tide UV-VIS Spectrometer (Order Code: SPRT-UV-VIS) The UV-VIS spectrometer is a portable ultraviolet light and visible light spectrophotometer, combining a spectrometer and a light source/cuvette
BIOLIGHT STUDIO IN ROUTINE UV/VIS SPECTROSCOPY
 BIOLIGHT STUDIO IN ROUTINE UV/VIS SPECTROSCOPY UV/Vis Spectroscopy is a technique that is widely used to characterize, identify and quantify chemical compounds in all fields of analytical chemistry. The
EXPERIMENT 6 INTRODUCTION TO SPECTROSCOPY
 EXPERIMENT 6 INTRODUCTION TO SPECTROSCOPY INTRODUCTION Much of what we know about the structures of atoms and molecules has been learned through experiments in which photons (electromagnetic radiation
SPECIALIZED LABORATORY of pharmaceuticals manufacturing
 SPECIALIZED LABORATORY of pharmaceuticals manufacturing Department of organic technology (111) Solid dosage forms testing: Dissolution test Supervisors: Laboratory location: S25b Introduction Ensuring
1. Prepare the MALDI sample plate by spotting an angiotensin standard and the test sample(s).
.") Analysis of a Peptide Sequence from a Proteolytic Digest by MALDI-TOF Post-Source Decay (PSD) and Collision-Induced Dissociation (CID) Standard Operating Procedure Purpose: The following procedure may
Analysis of a Peptide Sequence from a Proteolytic Digest by MALDI-TOF Post-Source Decay (PSD) and Collision-Induced Dissociation (CID) Standard Operating Procedure Purpose: The following procedure may
Fluorescence Spectrophotometry
 Chemistry 422L Manual Page 27 I. Introduction Fluorescence Spectrophotometry Ru(bpy) 3 2+, where bpy = 2, 2' bipyridine, has been one of the most widely studied metal complexes in recent years. Interest
Absorption Spectra of Conjugated Molecules
 Expt 1: Absorption Spectra of onjugated Molecules EM 361 Introduction Absorption Spectra of onjugated Molecules The purpose of this experiment is to measure the absorption spectra of two series of cyanine
Biology 3B LABORATORY Quantitative determination of chlorophyll using spectroscopy
 Biology 3B LABORATORY Quantitative determination of chlorophyll using spectroscopy Objectives Gain an understanding of the Beer-Lambert Law Use this principle to quantify the concentration of total chlorophyll
Concentrations that absorb. Measuring percentage transmittance of solutions at different concentrations
 Measuring percentage transmittance of solutions at different Dimension 2 Cross Cutting Concepts Dimension 1 Science and Engineering Practices FRAMEWORK FOR K-12 SCIENCE EDUCATION 2012 Concentrations that
Experiment 13. Dilutions and Data Handling in a Spreadsheet rev 1/2013
 Absorbance Experiment 13 Dilutions and Data Handling in a Spreadsheet rev 1/2013 GOAL: This lab experiment will provide practice in making dilutions using pipets and introduce basic spreadsheet skills
Experiment 6a: Excited-state properties of 2-naphthol (the acidity constants) (Dated: October 29, 2009)
 (Dated: October 29, 2009)") Experiment 6a: Excited-state properties of 2-naphthol (the acidity constants) (Dated: October 29, 2009) I. INTRODUCTION The electronic structure of a molecule determines such physical and chemical properties
Experiment 6a: Excited-state properties of 2-naphthol (the acidity constants) (Dated: October 29, 2009) I. INTRODUCTION The electronic structure of a molecule determines such physical and chemical properties
Computational Chemistry Lab Module: Conformational Analysis of Alkanes
 Introduction Computational Chemistry Lab Module: Conformational Analysis of Alkanes In this experiment, we will use CAChe software package to model the conformations of butane, 2-methylbutane, and substituted
Measuring Planck s Constant By Martin Hackworth
 Measuring Planck s Constant By Martin Hackworth Historical Perspective and Physics Theory Max Planck (1858-1947) was born in Kiel Germany and attended schools in Munich and Berlin. Planck was an early
Instytut Fizyki Doświadczalnej Wydział Matematyki, Fizyki i Informatyki UNIWERSYTET GDAŃSKI
 Instytut Fizyki Doświadczalnej Wydział Matematyki, Fizyki i Informatyki UNIWERSYTET GDAŃSKI I. Background theory. 1. Electromagnetic waves and their properties. 2. Polarization of light: a) non-polarised
DOAS measurements of Atmospheric Species
 Practical Environmental Measurement Techniques: DOAS measurements of Atmospheric Species Last change of document: April 14, 2014 Supervisor: Dr. Andreas Richter, room U2090, tel 62103, and Dr. Folkard
Physical Chemistry II Laboratory
 Kuwata Spring 2003 Physical Chemistry II Laboratory The Rovibrational Spectra of H 35 Cl and H 37 Cl Using FTIR Write-Up Due Date: Thursday, April 17 (You may record spectra and write your reports in teams
Modeling the UV-Vis Absorption of a Series of Dyes CH342L: Spectroscopy February 15, 2016
 Modeling the UV-Vis Absorption of a Series of Dyes CH342L: Spectroscopy February 15, 2016 We ll correlate the absorbance maximum of a series of dyes with structural changes between them 1. Chemicals absorb
A Study of Beer s Law Prelab
 1. What is the purpose of this experiment? A Study of Beer s Law Prelab 2. Using the absorbance versus wavelength curve given in Figure I, determine the approximate value of max of the dye used to construct
Zetasizer Nano-ZS User Instructions
 Zetasizer Nano-ZS User Instructions 1. Activate the instrument computer by logging in to CORAL. If needed, log in to the local instrument computer Username: zetasizer. Password: zetasizer. 2. Instrument
Protocol for Use of BCMP Jasco J-815 Circular Dichroism Spectropolarimeter
 Protocol for Use of BCMP Jasco J-815 Circular Dichroism Spectropolarimeter Getting Started 1. Turn on the nitrogen: Open the valve on the nitrogen tank (max 10 psi) so that the pressure gauge on the left
Beer's Law and Data Analysis *
 OpenStax-CNX module: m15131 1 Beer's Law and Data Analysis * Mary McHale This work is produced by OpenStax-CNX and licensed under the Creative Commons Attribution License 2.0 1 Beer's Law and Data Analysis
 NanoDrop One Viewer software NanoDrop One Website. NanoDrop One Website NanoDrop One Viewer software NanoDrop One Website Software System Update Update Update Software, Update Note OK Language Measure
Spectroscopy II Introduction: Spectrophotometry and Fluorometry
 Introduction: Spectrophotometry and Fluorometry In this experiment you will use the SpectroVis Plus (a small computer controlled Spectrophotometer + Fluorometer) to: Measure the Transmission and Absorbance
Lab 5 Enthalpy of Solution Formation
 Chemistry 3202 Lab 5 Enthalpy of Solution Formation Page 1 of 9 Lab 5 Enthalpy of Solution Formation Introduction This lab activity will introduce you to the measurement of energy change associated with
Relativistic Electrons
 Relativistic Electrons Physics 300 1 Introduction In this experiment you will make independent measurements of the momentum and kinetic energy of electrons emitted from a β source. You will use these data
Determining the Concentration of a Solution: Beer s Law
 Determining the Concentration of a Solution: Beer s Law Vernier Spectrometer 1 The primary objective of this experiment is to determine the concentration of an unknown copper (II) sulfate solution. You
Waters GPC User Guide and Tutorial for Using the GPC in the Reynolds Research Group 2 nd Edition: April 2012
 Waters GPC User Guide and Tutorial for Using the GPC in the Reynolds Research Group 2 nd Edition: April 2012 Georgia Institute of Technology School of Chemistry & Biochemistry School of Materials Science
EXPERIMENT 14. ACID DISSOCIATION CONSTANT OF METHYL RED 1
 EXPERIMET 14. ACID DISSOCIATIO COSTAT OF METHYL RED 1 The acid dissociation constant, Ka, of a dye is determined using spectrophotometry. Introduction In aqueous solution, methyl red is a zwitterion and
SuperCELL Data Programmer and ACTiSys IR Programmer User s Guide
 SuperCELL Data Programmer and ACTiSys IR Programmer User s Guide This page is intentionally left blank. SuperCELL Data Programmer and ACTiSys IR Programmer User s Guide The ACTiSys IR Programmer and SuperCELL
UV/VIS SPECTROMETRIC DETERMINATION OF AN EQUILIBRIUM CONSTANT
 EXPERIMENT 8 UV/VIS SPECTROMETRIC DETERMINATION OF AN EQUILIBRIUM CONSTANT A. Prelab Perform the experimental portion of the lab in groups of 68. Divide the work so everyone participates. You have one
CHEMISTRY SEMESTER ONE
 BEER-LAMBERT LAW Lab format: this lab is a remote lab activity Relationship to theory: This activity quantitatively relates the concentration of a lightabsorbing substance to the absorbance of light. LEARNING
Exercise 2-4. Titration of a Buffer Solution EXERCISE OBJECTIVES
 Exercise 2-4 Titration of a Buffer Solution EXERCISE OBJECTIVES To define the terms buffer solution and buffer capacity; To titrate a buffer solution with a weak acid solution; To plot a graph using the
TALLINN UNIVERSITY OF TECHNOLOGY, INSTITUTE OF PHYSICS 6. THE TEMPERATURE DEPENDANCE OF RESISTANCE
 6. THE TEMPERATURE DEPENDANCE OF RESISTANCE 1. Objective Determining temperature coefficient of metal and activation energy of self-conductance of semiconductor sample. 2. Equipment needed Metal and semiconductor
Determination of the Equivalent Weight and the K a or K b for a Weak Acid or Base
 INTRODUCTION Determination of the Equivalent Weight and the K a or K b for a Weak Acid or Base Chemists frequently make use of the equivalent weight (eq. wt.) as the basis for volumetric calculations.
Zeeman Effect Physics 481
 Zeeman Effect Introduction You are familiar with Atomic Spectra, especially the H- atom energy spectrum. Atoms emit or absorb energies in packets, or quanta which are photons. The orbital motion of electrons
UV-Visible Absorption Analysis of a Two Component System
 UV-Visible Absorption Analysis of a Two Component System 1. Purpose This procedure will determine the amounts of vanillin and p-hydroxybenzaldehyde in an unknown mixture using a UV-Vis spectrophotometer.
C101-E107B UV Shimadzu UV-VIS-NIR Spectrophotometer
 C101-E107B UV-3600 Shimadzu UV-VIS-NIR Spectrophotometer High sensitivity, high resolution, and an ultra-low stray-light level achieved with the latest technology lead the way to new solutions. UV-3600
Determination of the Rydberg constant, Moseley s law, and screening constant (Item No.: P )
") Determination of the Rydberg constant, Moseley s law, and screening constant (Item No.: P2541001) Curricular Relevance Area of Expertise: ILIAS Education Level: Physik Topic: Hochschule Subtopic: Moderne
Determination of the Rydberg constant, Moseley s law, and screening constant (Item No.: P2541001) Curricular Relevance Area of Expertise: ILIAS Education Level: Physik Topic: Hochschule Subtopic: Moderne
O P E R A T I N G M A N U A L
 OPERATING MANUAL WeatherJack OPERATING MANUAL 1-800-645-1061 The baud rate is 2400 ( 8 bits, 1 stop bit, no parity. Flow control = none) To make sure the unit is on line, send an X. the machine will respond
Ocean Optics Educational Spectrometers. Getting Started Manual
 Ocean Optics Educational Spectrometers Getting Started Manual We here at Ocean Optics want you to know that we appreciate your business. To speak to a Technical Support representative or an Ocean Optics
Investigating Food Dyes in Sports Beverages. Sample
 Investigating Food Dyes in Sports Beverages Investigation 1 There are many different brands of beverages that fall under the general category of sports drinks. Most of these beverages contain an FD&C food
This experiment is included in the XRP 4.0 X-ray solid state, XRS 4.0 X-ray structural analysis, and XRC 4.0 X-ray characteristics upgrade sets.
 The intensity of characteristic X-rays as a TEP Related topics Characteristic X-radiation, energy levels, Bragg s law, and intensity of characteristic X-rays Principle The X-ray spectrum of an X-ray tube
Operation Manual. SPECTRO-NANO4 Nucleic Acid Analyzer PLEASE READ THIS MANUAL CAREFULLY BEFORE OPERATION
 Operation Manual SPECTRO-NANO4 Nucleic Acid Analyzer PLEASE READ THIS MANUAL CAREFULLY BEFORE OPERATION 3, Hagavish st. Israel 58817 Tel: 972 3 5595252, Fax: 972 3 5594529 mrc@mrclab.com MRC. 4.18 Foreword
Molecular Modeling and Conformational Analysis with PC Spartan
 Molecular Modeling and Conformational Analysis with PC Spartan Introduction Molecular modeling can be done in a variety of ways, from using simple hand-held models to doing sophisticated calculations on
CHM Salicylic Acid Properties (r16) 1/11
 1/11") CHM 111 - Salicylic Acid Properties (r16) 1/11 Purpose In this lab, you will perform several tests to attempt to confirm the identity and assess the purity of the substance you synthesized in last week's
CHM 111 - Salicylic Acid Properties (r16) 1/11 Purpose In this lab, you will perform several tests to attempt to confirm the identity and assess the purity of the substance you synthesized in last week's
GOLD NANOPARTICLES EXAMPLE OF LAB EXPERIMENT
 GOLD NANOPARTICLES EXAMPLE OF LAB EXPERIMENT The following experiment provides an example of how some of the activities described in the module may be implemented in a lab environment under the supervision
Atomic and nuclear physics
 Atomic and nuclear physics X-ray physics Physics of the atomic shell LEYBOLD Physics Leaflets Moseley s law and determination of the Rydberg constant P6.3.3.6 Objects of the experiment Measuring the K-absorption
Elementary charge and Millikan experiment Students worksheet
 Tasks This experiment deals with the observation of charged oil droplets, which are accelerated between two capacitor plates.. Measure some rise and fall times of oil droplets at different voltages. Determine
Quick Start Guide New Mountain Visit our Website to Register Your Copy (weatherview32.com)
") Quick Start Guide New Mountain Visit our Website to Register Your Copy (weatherview32.com) Page 1 For the best results follow all of the instructions on the following pages to quickly access real-time
Quick Start Guide New Mountain Visit our Website to Register Your Copy (weatherview32.com) Page 1 For the best results follow all of the instructions on the following pages to quickly access real-time
EXPERIMENT 12. SPECTROSCOPIC STUDIES OF HCL AND DCL
 EXPERIMENT 12. SPECTROSCOPIC STUDIES OF HCL AND DCL High resolution infrared spectroscopy is one of the most useful tools for investigating the structure of small molecules. In this experiment you will
1. Preliminary qualitative analysis of unknown substances (liquid or solid).
.") Name of Procedure: Ultraviolet Spectroscopy Suggested Uses: 1. Preliminary qualitative analysis of unknown substances (liquid or solid). 2. Quantitative analysis of known compounds. Apparatus Used to Perform
Name of Procedure: Ultraviolet Spectroscopy Suggested Uses: 1. Preliminary qualitative analysis of unknown substances (liquid or solid). 2. Quantitative analysis of known compounds. Apparatus Used to Perform
and Environmental Science Centre
 1. Purpose The purpose of this document is to familiarize the user with the mode of function of the FT-Raman available at the facility, and to describe the sampling procedure. 2. Introduction Raman spectroscopy
REVIEW OF LAB TECHNIQUES
 Experiment 1 REVIEW OF LAB TECHNIQUES Prepared by Masanobu M. Yamauchi and Ross S. Nord, Eastern Michigan University PURPOSE To review density calculations, Beer s Law and the use of electronic balances,
Lab Activity H4 It s Snow Big Deal
 Lab Activity H4 It s Snow Big Deal OUTCOMES After completing this lab activity, the student should be able to use computer-based data acquisition techniques to measure temperatures. draw appropriate conclusions
Automatic Watershed Delineation using ArcSWAT/Arc GIS
 Automatic Watershed Delineation using ArcSWAT/Arc GIS By: - Endager G. and Yalelet.F 1. Watershed Delineation This tool allows the user to delineate sub watersheds based on an automatic procedure using
Physics 476LW Advanced Physics Laboratory Atomic Spectroscopy
 Physics 476LW Atomic Spectroscopy 1 Introduction The description of atomic spectra and the Rutherford-Geiger-Marsden experiment were the most significant precursors of the so-called Bohr planetary model
Atomic and nuclear physics
 Atomic and nuclear physics X-ray physics Attenuation of x-rays LEYBOLD Physics Leaflets P6.3.2.2 Investigating the wavelength dependency of the coefficient of attenuation Objects of the experiment To measure
Operation of the Bruker 400 JB Stothers NMR Facility Department of Chemistry Western University
 Operation of the Bruker 400 JB Stothers NMR Facility Department of Chemistry Western University 1. INTRODUCTION...3 1.1. Overview of the Bruker 400 NMR Spectrometer...3 1.2. Overview of Software... 3 1.2.1.
Quantum States and Spectra of Gases
 Page 1 of 12 RECOMMENDED READINGS Quantum States and Spectra of Gases ONE WEIGHT 1) R. Harris: Modern Physics, Ch.4, pp. 122-124; Ch.7 pp. 238-268; Ch.8.4-8.9. Addison Wesley, 2008. 2) PASCO Wireless Spectrometer
Assignment 2: Conformation Searching (50 points)
") Chemistry 380.37 Fall 2015 Dr. Jean M. Standard September 16, 2015 Assignment 2: Conformation Searching (50 points) In this assignment, you will use the Spartan software package to investigate some conformation
Chemistry 380.37 Fall 2015 Dr. Jean M. Standard September 16, 2015 Assignment 2: Conformation Searching (50 points) In this assignment, you will use the Spartan software package to investigate some conformation
The investigation of the photokinetics of a platinum organoamine complex using the Cary 50/60
 The investigation of the photokinetics of a platinum organoamine complex using the Cary 50/60 Application Note Chemical Author Jeffrey J. Comerford, PhD. Agilent Technologies, Inc. Mulgrave, Victoria 3170,
CEE 697K Bromide Lab
 CEE 697K Bromide Lab Laboratory Project Work in groups of three to investigate the kinetics of reaction between aqueous chlorine and bromide. Use the paper by Kumar and Margerum 1 that we discussed in
Electricity. Electrolysis. Current and the transport of charge DETERMINATION OF THE FARADAY CONSTANT BASIC PRINCIPLES
 Electricity Current and the transport of charge Electrolysis DETERMINATION OF THE FARADAY CONSTANT Production of hydrogen by means of electrolysis and determining the volume of the hydrogen V. Determining
FLS980 Series Reference Guide
 FLS980 Series Reference Guide Integrating Sphere for Measurements of Fluorescence Quantum Yields and Spectral Reflectance Revision 1 Copyrights Copyright 2016 Edinburgh Instruments Ltd. All rights reserved.
NanoLab (Phys4970) Mie Theory & Extinction Spectra [ver 1.1.0]
![NanoLab (Phys4970) Mie Theory & Extinction Spectra [ver 1.1.0]](/thumbs/87/96940456.jpg "NanoLab (Phys4970) Mie Theory & Extinction Spectra [ver 1.1.0]") Part B) Model your results in MiePlot. Step 0) Download Mieplot from the NanoLab www site. Install this on your computer. It is a small program and should not present any difficulty. Step 1) Start MiePlot
Part B) Model your results in MiePlot. Step 0) Download Mieplot from the NanoLab www site. Install this on your computer. It is a small program and should not present any difficulty. Step 1) Start MiePlot
Athena Visual Software, Inc. 1
 Athena Visual Studio Visual Kinetics Tutorial VisualKinetics is an integrated tool within the Athena Visual Studio software environment, which allows scientists and engineers to simulate the dynamic behavior
TL6 Ultra Micro-volume Spectrophotometer
 TL6 Ultra Micro-volume Spectrophotometer TL6 is the latest Ultra Micro-volume Spectrophotometer of PERSEE ANALYTICS. It is a small portable instrument for fast analysis of nucleic acid and protein concentrations
Investigating Transition Metal Complexes
 Exercise 4 Investigating Transition Metal Complexes 4 Introduction Colour is a well known property of the transition metals. The colour produced as parts of the visible spectrum are due to electron transitions
Creating Empirical Calibrations
 030.0023.01.0 Spreadsheet Manual Save Date: December 1, 2010 Table of Contents 1. Overview... 3 2. Enable S1 Calibration Macro... 4 3. Getting Ready... 4 4. Measuring the New Sample... 5 5. Adding New
Date: Summer Stem Section:
 Page 1 of 7 Name: Date: Summer Stem Section: Summer assignment: Build a Molecule Computer Simulation Learning Goals: 1. Students can describe the difference between a molecule name and chemical formula.
RATE LAW DETERMINATION OF CRYSTAL VIOLET HYDROXYLATION
 Rate Law Determination of Crystal Violet Hydroxylation Revised 5/22/12 RATE LAW DETERMINATION OF CRYSTAL VIOLET HYDROXYLATION Adapted from "Chemistry with Computers" Vernier Software, Portland OR, 1997
Spectroscopy Meditsiiniline keemia/medical chemistry LOKT Spectroscopy
 Meditsiiniline keemia/medical chemistry LOKT.00.009 Spectroscopy 04.09.12 http://tera.chem.ut.ee/~koit/arstpr/spe_en.pdf 1 ntroduction Spectroscopy is a general term for methods that investigate interactions
Vibrations of Carbon Dioxide and Carbon Disulfide
 Vibrations of Carbon Dioxide and Carbon Disulfide Purpose Vibration frequencies of CO 2 and CS 2 will be measured by Raman and Infrared spectroscopy. The spectra show effects of normal mode symmetries
Determining the Concentration of a Solution: Beer s Law. Evaluation copy. Figure 1
 Determining the Concentration of a Solution: Beer s Law Computer 17 The primary objective of this experiment is to determine the concentration of an unknown copper (II) sulfate solution. You will use a
Atomic Spectra HISTORY AND THEORY
 Atomic Spectra HISTORY AND THEORY When atoms of a gas are excited (by high voltage, for instance) they will give off light. Each element (in fact, each isotope) gives off a characteristic atomic spectrum,
FLUORESCENCE APPLICATIONS
 FLUORESCENCE APPLICATIONS CORRECTION OF EMISSION SPECTRA USING THE PERKINELMER MODEL LS-50 LUMINESCENCE SPECTROMETER Spectra collected on luminescence spectrometers consist of true spectral information
Chemistry 3202 Lab 6 Hess s Law 1
 Chemistry 3202 Lab 6 Hess s Law 1 Lab 6 Hess's Law Introduction Chemical and physical changes are always accompanied by a change in energy. Energy changes may be observed by detecting heat flow between
Determining the Concentration of a Solution: Beer s Law
 Determining the Concentration of a Solution: Beer s Law LabQuest 11 The primary objective of this experiment is to determine the concentration of an unknown nickel (II) sulfate solution. You will be using
Hydration of Propionaldehyde by Temperature-Jump Relaxation 1
 1 Hydration of Propionaldehyde by Temperature-Jump Relaxation 1 Purpose: Determine the rate constants for the reversible hydration of propionaldehyde using temperature-jump relaxation. Pre-lab Reading:
DETERMINATION OF THE DECOMPOSITION PRODUCTS OF CALCIUM OXALATE USING THERMAL GRAVIMETRY AND INFRARED SPECTROMETRY
 DETERMINATION OF THE DECOMPOSITION PRODUCTS OF CALCIUM OXALATE USING THERMAL GRAVIMETRY AND INFRARED SPECTROMETRY Objective: The objectives of this experiment are: (1) to determine the stability of various