PeptideProphet: Validation of Peptide Assignments to MS/MS Spectra
|
|
|
- Lee Haynes
- 5 years ago
- Views:
Transcription

1 PeptideProphet: Validation of Peptide Assignments to MS/MS Spectra Andrew Keller Day 2 October 17, 2006 Andrew Keller Rosetta Bioinformatics, Seattle
2 Outline Need to validate peptide assignments to MS/MS spectra Statistical approach to validation Running PeptideProphet software Interpreting results of PeptideProphet Exercises
3 Most search results are wrong [M+2H]2+/[M+3H]3+ uncertainty (LCQ) Non-peptide noise Incomplete database e.g. post-translational modifications Multiple precursors Limitation of database search algorithm
4 Validation of Peptide Assignments In the past, a majority of analysis time was devoted to identifying the minority of correct search results from the majority of incorrect results Required manual judgment sample prep instrument time database search validation Peptide Identification Effort 8.3% 8.3% 8.3% manual validation 75.0%
5 (Un)reliability of Manual Validation Manual Authenticators Search Results Correct Validation Incorrect Validation Validation Withheld
6 Need for Objective Criteria Manual scrutiny of search results is not practical for large datasets common to high throughput proteomics As an alternative to relying on human judgment, many research groups employ search scores and properties of the assigned peptides to discriminate between correct and incorrect results
7 Traditional Filtering Criteria Each Mascot search result has: Ionscore, Identityscore, Homologyscore, NTT (number of tryptic termini) Accept all results that satisfy: Ionscore > Identityscore
8 Traditional Filtering Criteria Each Mascot search result has: Ionscore, Identityscore, Homologyscore, NTT (number of tryptic termini) Accept all results that satisfy: Ionscore > Identityscore (NTT = 2)
9 Traditional Filtering Criteria Each Mascot search result has: Ionscore, Identityscore, Homologyscore, NTT (number of tryptic termini) Accept all results that satisfy: Ionscore > Identityscore (NTT = 2) Ionscore > Homologyscore
10 Traditional Filtering Criteria Each Mascot search result has: Ionscore, Identityscore, Homologyscore, NTT (number of tryptic termini) Accept all results that satisfy: Ionscore > Identityscore (NTT = 2) Ionscore > Homologyscore (NTT = 2)
11 Traditional Filtering Criteria Each Mascot search result has: Ionscore, Identityscore, Homologyscore, NTT (number of tryptic termini) Accept all results that satisfy: Ionscore > Identityscore (NTT = 2) Ionscore > Homologyscore (NTT = 2) Ionscore 30
12 Traditional Filtering Criteria Each Mascot search result has: Ionscore, Identityscore, Homologyscore, NTT (number of tryptic termini) Accept all results that satisfy: Ionscore > Identityscore (NTT = 2) Ionscore > Homologyscore (NTT = 2) Ionscore 30 (NTT = 2)
13 Problems with Traditional Filtering Different research groups use different thresholds Divides data into correct and incorrect- no in between Unknown error rates (fraction of data passing filter that are incorrect) Unknown sensitivity (fraction of correct results passing filter) Appropriate threshold may depend on database, mass spectrometer type, sample, etc.
14 Use of Forward/Reverse Database to Estimate False Positive Error Rates Do search against single Forward/Reverse database containing usual entries along with their sequencereversed counterparts Forward and Reverse protein sequences each comprise 50% of the database peptides Incorrect results, taken at random from the database, are predicted to correspond with Reverse protein sequences on average 50% of the time Number of incorrect results passing any score filter calculated as twice the number of accepted results corresponding to Reverse proteins Search takes twice as long
15 Use of Separate Forward and Reverse Database Searches Do searches against Forward and Reverse databases separately Number of incorrect results in Forward search passing any score filter calculated as the number of results passing the same filter applied to the Reverse search Gives an overestimate of the number of incorrect results passing a filter since compares the Reverse search which has no correct results with the Forward search which may have up to 100% correct results Results of 2 searches must be analyzed in parallel
16 Statistical Approach Use search scores and properties of the assigned peptides to compute a probability that each search result is correct Desirable model properties: Accurate High power to discriminate correct and incorrect results Robust
17 Training Dataset Want dataset of Mascot search results for which the true correct and incorrect peptide assignments are known Sample of 18 control proteins (bovine, yeast, bacterial) Collect ~40,000 MS/MS spectra, and search using Mascot vs. a Drosophila database appended with sequences of 18 control proteins and common sample contaminants


18 Training Dataset Peptides corresponding to Drosophila proteins are incorrect Peptides corresponding to 18 control proteins or contaminants are correct*
19 Derive Discriminant Function Derive single search score best at discriminating correct from incorrect search results Generally, can combine together multiple search engine scores, when available, into single linear combination score using Linear Discriminant Function Analysis (e.g. SEQUEST s Xcorr, DeltaCn, and SpRank) Use search engine score directly if only one Derive separately for search results of each parent ion charge (1+, 2+, and 3+)
20 Mascot Discriminant Function Use (Ionscore Identityscore) difference Ionscore - Identityscore More Correct More Incorrect Secondarily, use (Ionscore Homologyscore) difference to penalize some predominantly incorrect results and improve discrimination Ionscore - Identityscore More More Correct Incorrect More Incorrect Ionscore - Homologyscore
21 Mascot Discriminant Function In particular, use the (Ionscore Identityscore) difference adjusted for the Average Identityscore in the dataset for given parent ion charge Require (Ionscore Identityscore) not exceed m*(ionscore Homologyscore) + b + err, where m, b, and err are correlation parameters learned from the data for each parent ion charge Discriminant Function, F = 0.1 * {(Ionscore Identityscore) + Average Identityscore} 3.0 Ionscore - Identityscore x x Identity score too low x x x x x x x x intercept b +error err x x x x x x x x x x slope m Ionscore - Homologyscore Corr. line
22 Compute Discriminant Score Example: Peptide = LSISGTYDLK Precursor Ion Charge = 2 Ionscore = Identityscore = 46 Homologyscore = 37 Ave. Identityscore = 47 Corr. Slope = 0.53, Intercept = -6.99, Error = 10 (Ionscore Identityscore) = = 4.91 (Ionscore Identityscore) not allowed to exceed 0.53 * (Ionscore Homologyscore) , or 0.53 * ( ) = F = 0.1 * { } 3.0 = 2.19
23 Discriminant Score Distributions no. of spectra incorrect (-) correct (+) discriminant score (F) Training dataset [M+2H] 2+ spectra
24 Computing probabilities from discriminant score distributions no. of spectra incorrect (-) p = 0.5 correct (+) discriminant score (F) Probability of being correct, given discriminant score F obs, is: p = Number of correct search results with F obs Total number of search results with F obs
25 Computing probabilities from discriminant score distributions no. of spectra incorrect (-) p = 0.5 correct (+) discriminant score (F) Probability of being correct, given discriminant score F obs, is: Model Incorrect results as Extreme Value Distribution (EVD) Model Correct results as Normal Distribution p = Normal μ,σ (F obs ) * Total correct Normal μ,σ (F obs ) * Total correct + EVD β,μ (F obs ) * Total incorrect
26 Employing peptide properties Properties of the assigned peptides, in addition to search scores, are useful information for distinguishing correct and incorrect results. For example, in unconstrained Mascot searches with MS/MS spectra collected from trypsinized samples, a majority of correct assigned peptides have 2 tryptic termini (preceded by K,R), whereas a majority of incorrect assigned peptides have 0 tryptic termini.
27 Number of Tryptic Termini (NTT) NTT can equal 0, 1, or 2: G.HVEQLDSSS.D NTT = 0 K.HVEQLDSSS.D NTT = 1 G.HVEQLDSSR.D NTT = 1 K.HVEQLDSSR.D NTT = 2
28 Number of Tryptic Termini (NTT) For the same value of F, assigned peptides with higher NTT values are more likely to be correct Example: training dataset Correct: 0.03 NTT=0, 0.28 NTT=1, 0.69 NTT=2 Incorrect: 0.80 NTT=0, 0.19 NTT=1, 0.01 NTT=2 Probability of being correct, given discriminant score F obs with NTT=2 is: p = Normal μ,σ (F obs ) * Total corr * 0.69 Normal μ,σ (F obs ) * Total corr * EVD β,μ (F obs ) * Total incorr * 0.01 F obs : p = 0.5 without NTT becomes p=0.99 using NTT
29 Number of Tryptic Termini (NTT) For the same value of F, assigned peptides with lower NTT values are less likely to be correct Example: training dataset Correct: 0.03 NTT=0, 0.28 NTT=1, 0.69 NTT=2 Incorrect: 0.80 NTT=0, 0.19 NTT=1, 0.01 NTT=2 Probability of being correct, given discriminant score F obs with NTT=0 is: p = Normal μ,σ (F obs ) * Total corr * 0.03 Normal μ,σ (Fobs) * Total corr * EVD β,μ (F obs ) * Total incorr * 0.80 F obs : p = 0.5 without NTT becomes p=0.04 using NTT
30 Additional Peptide Properties Number of missed tryptic cleavages (NMC) Mass difference between precursor ion and peptide Presence of light or heavy cysteine (ICAT) Presence of N-glyc motif (N-glycosylation capture) Calculated pi (FFE) Incorporate similar to NTT above, assuming independence of peptide properties and search scores among correct and incorrect results
31 Computed Probabilities Given training dataset distributions of F, NTT, NMC, Massdiff, ICAT, N-glyc, and pi among correct and incorrect search results, then the probability of any search result with F obs, NTTobs, NMCobs, Massdiffobs, ICATobs, N-glycobs, and pi obs can be computed as described above, with terms for each piece of information Accurate Discriminating
32 Robust Model One cannot rely on the training dataset distributions of F, NTT, NMC, Massdiff, ICAT, N- glyc, and pi among correct and incorrect search results These distributions are expected to vary depending upon: Database used for search Mass spectrometer Spectrum quality Sample preparation and purity
33 Variations in Discriminant Score Distributions Different proportion of correct results in dataset no of spectra incorrect (-) correct (+) discriminant score (F) vs. training dataset [M+2H] 2+ spectra
34 Variations in Discriminant Score Distributions Different distribution means no of spectra incorrect (-) correct (+) discriminant score (F) vs. training dataset [M+2H] 2+ spectra
35 EM Algorithm PeptideProphet learns the distributions of F and peptide properties among correct and incorrect search results in each dataset It then uses the learned distributions to compute probabilities that each search result is correct Expectation-Maximization (EM) algorithm: unsupervised learning method that iteratively estimates the distributions given probabilities that each search result is correct, and then computes those probabilities given the distributions Initial settings help guide algorithm to good solution
36 EM Algorithm Details 1. Initial estimates of result probabilities Search Result F NTT prob 1-prob A B C D Update F value distributions among correct and incorrect results P(F +): m = (3.0)(1.0) + (2.0)(0.5) + (1.0)(0.5) + (0.0)(0.0) = 2.25 P(F -): m = (3.0)(0.0) + (2.0)(0.5) + (1.0)(0.5) + (0.0)(1.0) P(NTT=0 +) = (0.0) / ( ) = 0.0 P(NTT=1 +) = ( ) / ( ) = 0.5 P(NTT=2 +) = (1.0)/( ) = 0.5 P(NTT=0 -) = (1.0) / ( ) = 0.5 P(NTT=1 -) = ( ) / ( ) = 0.5 P(NTT=2 -) = (0.0)/( ) = 0.0 = Update NTT distributions among correct and incorrect results 4. Recompute result probabilities using updated distributions, and iterate
37 EM Algorithm learns test data score distributions Incorrect Peptide Assignments NTT = 0 NTT = 1 NTT = 2 No. of spectra Correct Peptide Assignments Discriminant search score
38 EM Iteration 0 Incorrect Peptide Assignments NTT = 0 NTT = 1 NTT = 2 No. of spectra Correct Peptide Assignments Discriminant search score
39 EM Iteration 1 Incorrect Peptide Assignments NTT = 0 NTT = 1 NTT = 2 No. of spectra Correct Peptide Assignments Discriminant search score
40 EM Iteration 2 Incorrect Peptide Assignments NTT = 0 NTT = 1 NTT = 2 No. of spectra Correct Peptide Assignments Discriminant search score
41 EM Iteration 3 Incorrect Peptide Assignments NTT = 0 NTT = 1 NTT = 2 No. of spectra Correct Peptide Assignments Discriminant search score
42 EM Iteration 4 Incorrect Peptide Assignments NTT = 0 NTT = 1 NTT = 2 No. of spectra Correct Peptide Assignments Discriminant search score
43 EM Iteration 7 Incorrect Peptide Assignments NTT = 0 NTT = 1 NTT = 2 No. of spectra Correct Peptide Assignments Discriminant search score
44 Accuracy of the Model ~ spectra with computed p ~ 0.9 model ideal p=0.9 90% of them (90) should be correct Observed probability is around 0.9 Model is accurate test data: A. Keller et al. OMICS 6, 207 (2002)
45 Discriminating Power of Computed Probabilities conventional Mascot thresholds probability thresholds Sensitivity: fraction of all correct results passing filter Error: fraction of all results passing filter that are incorrect Ideal Spot test data: A. Keller et al. OMICS 6, 207 (2002)
46 Discriminating Power of Computed Probabilities sensitivity, error min. probability threshold observed predicted test data: A. Keller et al. OMICS 6, 207 (2002) Sensitivity: fraction of all correct results passing filter Error: fraction of all results passing filter that are incorrect
47 Discriminating Power Example: p sensitivity, error min. probability threshold observed predicted test data: A. Keller et al. OMICS 6, 207 (2002) 0.01 Sensitivity: fraction of all correct results passing filter Error: fraction of all results passing filter that are incorrect
48 Discriminating Power Example: p sensitivity, error min. probability threshold observed predicted test data: A. Keller et al. OMICS 6, 207 (2002) 0.07 Sensitivity: fraction of all correct results passing filter Error: fraction of all results passing filter that are incorrect
49 Use of PeptideProphet Probabilities to Compare Searches False positive error rate predicted by PeptideProphet is an objective criterion for comparing different searches Sample preparation and LC/MS/MS Search conditions Search engine Compare the number of results of each search passing its minimum probability threshold to achieve a fixed predicted false positive error rate Reflects both search engine and PeptideProphet performance
50 From Peptide to Protein Level Analysis When the identification of proteins rather than peptides is of interest, it is unnecessary in practice to filter search results based on probabilities Instead, all search results and their computed probabilities are passed to the ProteinProphet program which infers sample proteins by combining together the peptide evidence for each protein Initially adjusts the PeptideProphet probabilities based on whether a peptide corresponds to a single-hit or multi-hit protein Then apportions shared peptides among all their corresponding proteins in such a way to derive the simplest list of proteins that explain the observed peptides Computes accurate protein probabilities
51 PeptideProphet Software Tutorial How to run PeptideProphet through the TPP Web Interface Interpretation of analysis results User options
52 Getting started with PeptideProphet Input: pepxml files (file1.xml, file2.xml ) XInteract program first merges files together into single file interact.xml, then PeptideProphet runs model, computes probabilities, and writes probabilities as first column Combine together runs that are similar (sample, database, search constraints, mass spectrometer)

53 Getting started with PeptideProphet Specify search engine and select Analysis Pipeline 2 1

54 Getting started with PeptideProphet Select peptide level analysis
55 Getting started with PeptideProphet Specify search results to analyze

56 Getting started with PeptideProphet Navigate data directories

57 Getting started with PeptideProphet Add each search run pepxml included in analysis

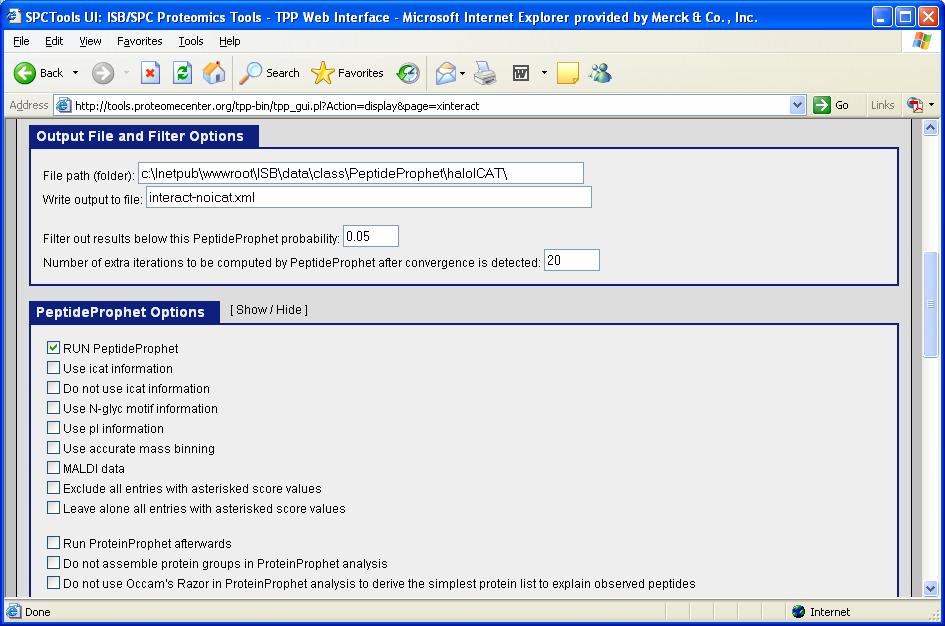
58 Getting started with PeptideProphet Specify output file name and minimum probability filter, opt to run PeptideProphet

59 Getting started with PeptideProphet Specify PeptideProphet optional parameters and run analysis


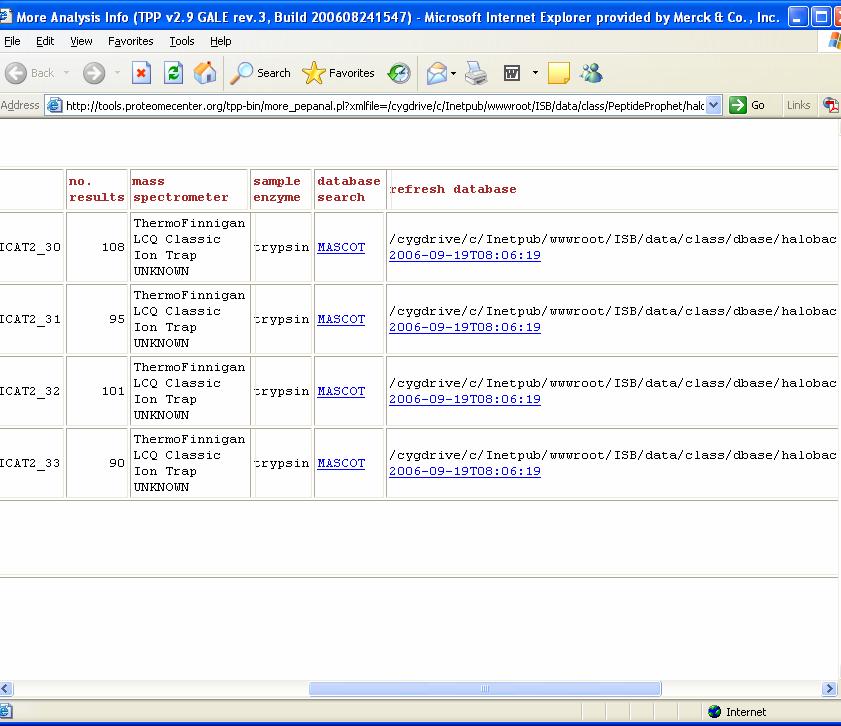
60 Getting started with PeptideProphet Click on links to view results of analysis

61 PeptideProphet Results Results

62 PeptideProphet Results: Model Summary
63 Reasonable Learned Discriminant Score Distributions
64 Suspicious Looking Learned Discriminant Score Distributions

65 PeptideProphet Results: Model Sumary PeptideProphet Results: Model Summary
66 PeptideProphet Results: Model Summary Good Not so good
67 PeptideProphet Results: Model Summary PeptideProphet Results: Model Summary
68 PeptideProphet Results: Predicted Numbers of Correct Peptides
69 PeptideProphet Results: Contributing Score and Peptide Properties 2+ search result discriminant score value
![PeptideProphet [M+2H] 2+ vs [M+3H] 3+ Precursor Ions Spectrum](/docs-images/85/91516330/images/70-0.jpg "searched as both 2+ and 3+ precursor received significant")
70 PeptideProphet [M+2H] 2+ vs [M+3H] 3+ Precursor Ions Spectrum searched as both 2+ and 3+ precursor received significant probability
71 PeptideProphet Results: Incomplete Analysis Model incomplete for results of 1+ precursor ions

.")

72 PeptideProphet Results: Incomplete Analysis In general, if analysis of results of precursor ion charge N is incomplete, results are partitioned into those unlikely to be correct (assigned probability 0 ), and those possibly correct (assigned probability -N ). These estimates are made using learned distributions for an adjacent charge when available, otherwise using training dataset distributions Model incomplete for results of 1+ precursor ions

73 Sort Data by Computed Probability

74 Filter Data by Mascot Ionscore

75 Select and Color Specified AA s


76 Pep3D and Analysis Summary Links Raw Data Details of Peptide Analysis

77 User Options for PeptideProphet Rename Output File (e.g. to interact-noicat.xml):
78 Use of Supplemental Discriminating Information Use additional discriminating information, including ICAT or N-glyc, when relevant PeptideProphet automatically uses ICAT information when it thinks appropriate Nevertheless, you can explicitly set whether or not ICAT information is utilized


79 Ionscore* Example Search results are marked with asterisked Ionscore when runner up peptide(s) share at least 75% sequence identity with top peptide
80 Ionscore* Options There are three ways asterisked Ionscores can be treated by PeptideProphet: Penalize (the default option, halves Ionscore values) Leave alone (suitable for the context of homologues) Exclude (the most conservative, assigns probability 0)
81 Run/Don t Run PeptideProphet
82 Ongoing Developments for PeptideProphet Optimize for various additional mass spectrometers New discriminant function Adapt to additional methods for assigning peptides to tandem mass spectra SEQUEST COMET ProbID SpectraST X!Tandem Others
83 Exercises with PeptideProphet Accuracy of computed probabilities Utility of conventional Mascot score thresholds and PeptideProphet analysis Model results for ICAT data analyzed with and without ICAT information Model results for Mystery dataset
84 Exercise Datasets Many of the exercises utilize Mascot search results of HaloICAT datasets for which correct results are independently known: MS/MS spectra generated from Halobacterium ICAT sample searched against a halobacterium_plus_human protein sequence database The pepxml Viewer is pre-configured for this class to automatically color all HaloICAT correct corresponding proteins red!
PeptideProphet: Validation of Peptide Assignments to MS/MS Spectra. Andrew Keller
 PeptideProphet: Validation of Peptide Assignments to MS/MS Spectra Andrew Keller Outline Need to validate peptide assignments to MS/MS spectra Statistical approach to validation Running PeptideProphet
iprophet: Multi-level integrative analysis of shotgun proteomic data improves peptide and protein identification rates and error estimates
 MCP Papers in Press. Published on August 29, 2011 as Manuscript M111.007690 This is the Pre-Published Version iprophet: Multi-level integrative analysis of shotgun proteomic data improves peptide and protein
Isotopic-Labeling and Mass Spectrometry-Based Quantitative Proteomics
 Isotopic-Labeling and Mass Spectrometry-Based Quantitative Proteomics Xiao-jun Li, Ph.D. Current address: Homestead Clinical Day 4 October 19, 2006 Protein Quantification LC-MS/MS Data XLink mzxml file
Empirical Statistical Model To Estimate the Accuracy of Peptide Identifications Made by MS/MS and Database Search
 Anal. Chem. 2002, 74, 5383-5392 Empirical Statistical Model To Estimate the Accuracy of Peptide Identifications Made by MS/MS and Database Search Andrew Keller,*, Alexey I. Nesvizhskii,*, Eugene Kolker,
Introduction to pepxmltab
 Introduction to pepxmltab Xiaojing Wang October 30, 2018 Contents 1 Introduction 1 2 Convert pepxml to a tabular format 1 3 PSMs Filtering 4 4 Session Information 5 1 Introduction Mass spectrometry (MS)-based
Tutorial 1: Setting up your Skyline document
 Tutorial 1: Setting up your Skyline document Caution! For using Skyline the number formats of your computer have to be set to English (United States). Open the Control Panel Clock, Language, and Region
Overview - MS Proteomics in One Slide. MS masses of peptides. MS/MS fragments of a peptide. Results! Match to sequence database
 Overview - MS Proteomics in One Slide Obtain protein Digest into peptides Acquire spectra in mass spectrometer MS masses of peptides MS/MS fragments of a peptide Results! Match to sequence database 2 But
MS-MS Analysis Programs
 MS-MS Analysis Programs Basic Process Genome - Gives AA sequences of proteins Use this to predict spectra Compare data to prediction Determine degree of correctness Make assignment Did we see the protein?
Protein Identification Using Tandem Mass Spectrometry. Nathan Edwards Informatics Research Applied Biosystems
 Protein Identification Using Tandem Mass Spectrometry Nathan Edwards Informatics Research Applied Biosystems Outline Proteomics context Tandem mass spectrometry Peptide fragmentation Peptide identification
Last updated: Copyright
 Last updated: 2012-08-20 Copyright 2004-2012 plabel (v2.4) User s Manual by Bioinformatics Group, Institute of Computing Technology, Chinese Academy of Sciences Tel: 86-10-62601016 Email: zhangkun01@ict.ac.cn,
Quan%ta%on with XPRESS. and. ASAPRa%o
 Quan%ta%on with XPRESS and ASAPRa%o 1 Pep%de and Protein Quan%ta%on Raw Mass Spec Data Pep%de Iden%fica%on Pep%de Valida%on Quan%ta%on Protein Assignment Protein List msconvert X!Tandem SpectraST SEQUEST*
Workflow concept. Data goes through the workflow. A Node contains an operation An edge represents data flow The results are brought together in tables
 PROTEOME DISCOVERER Workflow concept Data goes through the workflow Spectra Peptides Quantitation A Node contains an operation An edge represents data flow The results are brought together in tables Protein
HOWTO, example workflow and data files. (Version )
") HOWTO, example workflow and data files. (Version 20 09 2017) 1 Introduction: SugarQb is a collection of software tools (Nodes) which enable the automated identification of intact glycopeptides from HCD
HOWTO, example workflow and data files. (Version 20 09 2017) 1 Introduction: SugarQb is a collection of software tools (Nodes) which enable the automated identification of intact glycopeptides from HCD
Improved Classification of Mass Spectrometry Database Search Results Using Newer Machine Learning Approaches*
 Research Improved Classification of Mass Spectrometry Database Search Results Using Newer Machine Learning Approaches* Peter J. Ulintz, Ji Zhu, Zhaohui S. Qin **, and Philip C. Andrews Manual analysis
Spectrum-to-Spectrum Searching Using a. Proteome-wide Spectral Library
 MCP Papers in Press. Published on April 30, 2011 as Manuscript M111.007666 Spectrum-to-Spectrum Searching Using a Proteome-wide Spectral Library Chia-Yu Yen, Stephane Houel, Natalie G. Ahn, and William
MALDI-HDMS E : A Novel Data Independent Acquisition Method for the Enhanced Analysis of 2D-Gel Tryptic Peptide Digests
 -HDMS E : A Novel Data Independent Acquisition Method for the Enhanced Analysis of 2D-Gel Tryptic Peptide Digests Emmanuelle Claude, 1 Mark Towers, 1 and Rachel Craven 2 1 Waters Corporation, Manchester,
Tutorial 1: Library Generation from DDA data
 Tutorial 1: Library Generation from DDA data 1. Introduction Before a targeted, peptide-centric DIA analysis can be performed, a spectral library containing peptide-query parameters needs to be generated.
Properties of Average Score Distributions of SEQUEST
 Research Properties of Average Score Distributions of SEQUEST THE PROBABILITY RATIO METHOD* S Salvador Martínez-Bartolomé, Pedro Navarro, Fernando Martín-Maroto, Daniel López-Ferrer **, Antonio Ramos-Fernández,
An Unsupervised, Model-Free, Machine-Learning Combiner for Peptide Identifications from Tandem Mass Spectra
 Clin Proteom (2009) 5:23 36 DOI 0.007/s204-009-9024-5 An Unsupervised, Model-Free, Machine-Learning Combiner for Peptide Identifications from Tandem Mass Spectra Nathan Edwards Xue Wu Chau-Wen Tseng Published
A NESTED MIXTURE MODEL FOR PROTEIN IDENTIFICATION USING MASS SPECTROMETRY
 Submitted to the Annals of Applied Statistics A NESTED MIXTURE MODEL FOR PROTEIN IDENTIFICATION USING MASS SPECTROMETRY By Qunhua Li,, Michael MacCoss and Matthew Stephens University of Washington and
A new algorithm for the evaluation of shotgun peptide sequencing in proteomics: support vector machine classification of peptide MS/MS spectra
 A new algorithm for the evaluation of shotgun peptide sequencing in proteomics: support vector machine classification of peptide MS/MS spectra and SEQUEST scores D.C. Anderson*, Weiqun Li, Donald G. Payan,
Proteomics. November 13, 2007
 Proteomics November 13, 2007 Acknowledgement Slides presented here have been borrowed from presentations by : Dr. Mark A. Knepper (LKEM, NHLBI, NIH) Dr. Nathan Edwards (Center for Bioinformatics and Computational
DIA-Umpire: comprehensive computational framework for data independent acquisition proteomics
 DIA-Umpire: comprehensive computational framework for data independent acquisition proteomics Chih-Chiang Tsou 1,2, Dmitry Avtonomov 2, Brett Larsen 3, Monika Tucholska 3, Hyungwon Choi 4 Anne-Claude Gingras
Mass Spectrometry and Proteomics - Lecture 5 - Matthias Trost Newcastle University
 Mass Spectrometry and Proteomics - Lecture 5 - Matthias Trost Newcastle University matthias.trost@ncl.ac.uk Previously Proteomics Sample prep 144 Lecture 5 Quantitation techniques Search Algorithms Proteomics
MassHunter Software Overview
 MassHunter Software Overview 1 Qualitative Analysis Workflows Workflows in Qualitative Analysis allow the user to only see and work with the areas and dialog boxes they need for their specific tasks A
Key questions of proteomics. Bioinformatics 2. Proteomics. Foundation of proteomics. What proteins are there? Protein digestion
 s s Key questions of proteomics What proteins are there? Bioinformatics 2 Lecture 2 roteomics How much is there of each of the proteins? - Absolute quantitation - Stoichiometry What (modification/splice)
TUTORIAL EXERCISES WITH ANSWERS
 TUTORIAL EXERCISES WITH ANSWERS Tutorial 1 Settings 1. What is the exact monoisotopic mass difference for peptides carrying a 13 C (and NO additional 15 N) labelled C-terminal lysine residue? a. 6.020129
The Pitfalls of Peaklist Generation Software Performance on Database Searches
 Proceedings of the 56th ASMS Conference on Mass Spectrometry and Allied Topics, Denver, CO, June 1-5, 2008 The Pitfalls of Peaklist Generation Software Performance on Database Searches Aenoch J. Lynn,
Improved Validation of Peptide MS/MS Assignments. Using Spectral Intensity Prediction
 MCP Papers in Press. Published on October 2, 2006 as Manuscript M600320-MCP200 Improved Validation of Peptide MS/MS Assignments Using Spectral Intensity Prediction Shaojun Sun 1, Karen Meyer-Arendt 2,
SRM assay generation and data analysis in Skyline
 in Skyline Preparation 1. Download the example data from www.srmcourse.ch/eupa.html (3 raw files, 1 csv file, 1 sptxt file). 2. The number formats of your computer have to be set to English (United States).
Agilent MassHunter Profinder: Solving the Challenge of Isotopologue Extraction for Qualitative Flux Analysis
 Agilent MassHunter Profinder: Solving the Challenge of Isotopologue Extraction for Qualitative Flux Analysis Technical Overview Introduction Metabolomics studies measure the relative abundance of metabolites
Quality Assessment of Tandem Mass Spectra Based on Cumulative Intensity Normalization
 Quality Assessment of Tandem Mass Spectra Based on Cumulative Intensity Normalization Seungjin Na and Eunok Paek* Department of Mechanical and Information Engineering, University of Seoul, Seoul, Korea
Computational Methods for Mass Spectrometry Proteomics
 Computational Methods for Mass Spectrometry Proteomics Eidhammer, Ingvar ISBN-13: 9780470512975 Table of Contents Preface. Acknowledgements. 1 Protein, Proteome, and Proteomics. 1.1 Primary goals for studying
Information Dependent Acquisition (IDA) 1
 1") Information Dependent Acquisition (IDA) Information Dependent Acquisition (IDA) enables on the fly acquisition of MS/MS spectra during a chromatographic run. Analyst Software IDA is optimized to generate
Information Dependent Acquisition (IDA) Information Dependent Acquisition (IDA) enables on the fly acquisition of MS/MS spectra during a chromatographic run. Analyst Software IDA is optimized to generate
Nature Methods: doi: /nmeth Supplementary Figure 1. Fragment indexing allows efficient spectra similarity comparisons.
 Supplementary Figure 1 Fragment indexing allows efficient spectra similarity comparisons. The cost and efficiency of spectra similarity calculations can be approximated by the number of fragment comparisons
ASCQ_ME: a new engine for peptide mass fingerprint directly from mass spectrum without mass list extraction
 ASCQ_ME: a new engine for peptide mass fingerprint directly from mass spectrum without mass list extraction Jean-Charles BOISSON1, Laetitia JOURDAN1, El-Ghazali TALBI1, Cécile CREN-OLIVE2 et Christian
PRIDE Cluster: building the consensus of proteomics data
 Supplementary Materials PRIDE Cluster: building the consensus of proteomics data Johannes Griss, Joseph Michael Foster, Henning Hermjakob and Juan Antonio Vizcaíno EMBL-European Bioinformatics Institute,
Comprehensive support for quantitation
 Comprehensive support for quantitation One of the major new features in the current release of Mascot is support for quantitation. This is still work in progress. Our goal is to support all of the popular
Methods for proteome analysis of obesity (Adipose tissue)
") Methods for proteome analysis of obesity (Adipose tissue) I. Sample preparation and liquid chromatography-tandem mass spectrometric analysis Instruments, softwares, and materials AB SCIEX Triple TOF 5600
Methods for proteome analysis of obesity (Adipose tissue) I. Sample preparation and liquid chromatography-tandem mass spectrometric analysis Instruments, softwares, and materials AB SCIEX Triple TOF 5600
X!TandemPipeline (Myosine Anabolisée) validating, filtering and grouping MSMS identifications
 validating, filtering and grouping MSMS identifications") X!TandemPipeline 3.3.3 (Myosine Anabolisée) validating, filtering and grouping MSMS identifications Olivier Langella and Benoit Valot langella@moulon.inra.fr; valot@moulon.inra.fr PAPPSO - http://pappso.inra.fr/
X!TandemPipeline 3.3.3 (Myosine Anabolisée) validating, filtering and grouping MSMS identifications Olivier Langella and Benoit Valot langella@moulon.inra.fr; valot@moulon.inra.fr PAPPSO - http://pappso.inra.fr/
MSnID Package for Handling MS/MS Identifications
 Vladislav A. Petyuk December 1, 2018 Contents 1 Introduction.............................. 1 2 Starting the project.......................... 3 3 Reading MS/MS data........................ 3 4 Updating
De novo Protein Sequencing by Combining Top-Down and Bottom-Up Tandem Mass Spectra. Xiaowen Liu
 De novo Protein Sequencing by Combining Top-Down and Bottom-Up Tandem Mass Spectra Xiaowen Liu Department of BioHealth Informatics, Department of Computer and Information Sciences, Indiana University-Purdue
Mixture Mode for Peptide Mass Fingerprinting ASMS 2003
 Mixture Mode for Peptide Mass Fingerprinting ASMS 2003 1 Mixture Mode: New in Mascot 1.9 All peptide mass fingerprint searches now test for the possibility that the sample is a mixture of proteins. Mascot
ProMass Deconvolution User Training. Novatia LLC January, 2013
 ProMass Deconvolution User Training Novatia LLC January, 2013 Overview General info about ProMass Features Basics of how ProMass Deconvolution works Example Spectra Manual Deconvolution with ProMass Deconvolution
STATISTICAL METHODS FOR THE ANALYSIS OF MASS SPECTROMETRY- BASED PROTEOMICS DATA. A Dissertation XUAN WANG
 STATISTICAL METHODS FOR THE ANALYSIS OF MASS SPECTROMETRY- BASED PROTEOMICS DATA A Dissertation by XUAN WANG Submitted to the Office of Graduate Studies of Texas A&M University in partial fulfillment of
profileanalysis Innovation with Integrity Quickly pinpointing and identifying potential biomarkers in Proteomics and Metabolomics research
 profileanalysis Quickly pinpointing and identifying potential biomarkers in Proteomics and Metabolomics research Innovation with Integrity Omics Research Biomarker Discovery Made Easy by ProfileAnalysis
MassHunter TOF/QTOF Users Meeting
 MassHunter TOF/QTOF Users Meeting 1 Qualitative Analysis Workflows Workflows in Qualitative Analysis allow the user to only see and work with the areas and dialog boxes they need for their specific tasks
Identification of proteins by enzyme digestion, mass
 Method for Screening Peptide Fragment Ion Mass Spectra Prior to Database Searching Roger E. Moore, Mary K. Young, and Terry D. Lee Beckman Research Institute of the City of Hope, Duarte, California, USA
Virtual Beach Building a GBM Model
 Virtual Beach 3.0.6 Building a GBM Model Building, Evaluating and Validating Anytime Nowcast Models In this module you will learn how to: A. Build and evaluate an anytime GBM model B. Optimize a GBM model
Computational Analysis of Mass Spectrometric Data for Whole Organism Proteomic Studies
 University of Tennessee, Knoxville Trace: Tennessee Research and Creative Exchange Doctoral Dissertations Graduate School 5-2006 Computational Analysis of Mass Spectrometric Data for Whole Organism Proteomic
MaSS-Simulator: A highly configurable MS/MS simulator for generating test datasets for big data algorithms.
 MaSS-Simulator: A highly configurable MS/MS simulator for generating test datasets for big data algorithms. Muaaz Gul Awan 1 and Fahad Saeed 1 1 Department of Computer Science, Western Michigan University,
A Modular NMF Matching Algorithm for Radiation Spectra
 A Modular NMF Matching Algorithm for Radiation Spectra Melissa L. Koudelka Sensor Exploitation Applications Sandia National Laboratories mlkoude@sandia.gov Daniel J. Dorsey Systems Technologies Sandia
Analysis of Peptide MS/MS Spectra from Large-Scale Proteomics Experiments Using Spectrum Libraries
 Anal. Chem. 2006, 78, 5678-5684 Analysis of Peptide MS/MS Spectra from Large-Scale Proteomics Experiments Using Spectrum Libraries Barbara E. Frewen, Gennifer E. Merrihew, Christine C. Wu, William Stafford
Modeling Mass Spectrometry-Based Protein Analysis
 Chapter 8 Jan Eriksson and David Fenyö Abstract The success of mass spectrometry based proteomics depends on efficient methods for data analysis. These methods require a detailed understanding of the information
Mass Spectrometry Based De Novo Peptide Sequencing Error Correction
 Mass Spectrometry Based De Novo Peptide Sequencing Error Correction by Chenyu Yao A thesis presented to the University of Waterloo in fulfillment of the thesis requirement for the degree of Master of Mathematics
Learning Score Function Parameters for Improved Spectrum Identification in Tandem Mass Spectrometry Experiments
 pubs.acs.org/jpr Learning Score Function Parameters for Improved Spectrum Identification in Tandem Mass Spectrometry Experiments Marina Spivak, Michael S. Bereman, Michael J. MacCoss, and William Stafford
Proteomics. Yeast two hybrid. Proteomics - PAGE techniques. Data obtained. What is it?
 Proteomics What is it? Reveal protein interactions Protein profiling in a sample Yeast two hybrid screening High throughput 2D PAGE Automatic analysis of 2D Page Yeast two hybrid Use two mating strains
HOW TO ANALYZE SYNCHROTRON DATA
 HOW TO ANALYZE SYNCHROTRON DATA 1 SYNCHROTRON APPLICATIONS - WHAT Diffraction data are collected on diffractometer lines at the world s synchrotron sources. Most synchrotrons have one or more user facilities
Transferred Subgroup False Discovery Rate for Rare Post-translational Modifications Detected by Mass Spectrometry* S
 Transferred Subgroup False Discovery Rate for Rare Post-translational Modifications Detected by Mass Spectrometry* S Yan Fu and Xiaohong Qian Technological Innovation and Resources 2014 by The American
Efficient Marginalization to Compute Protein Posterior Probabilities from Shotgun Mass Spectrometry Data
 Efficient Marginalization to Compute Protein Posterior Probabilities from Shotgun Mass Spectrometry Data Oliver Serang Department of Genome Sciences, University of Washington, Seattle, Washington Michael
Targeted Proteomics Environment
 Targeted Proteomics Environment Quantitative Proteomics with Bruker Q-TOF Instruments and Skyline Brendan MacLean Quantitative Proteomics Spectrum-based Spectral counting Isobaric tags Chromatography-based
Qualitative Proteomics (how to obtain high-confidence high-throughput protein identification!)
") Qualitative Proteomics (how to obtain high-confidence high-throughput protein identification!) James A. Mobley, Ph.D. Director of Research in Urology Associate Director of Mass Spectrometry (contact: mobleyja@uab.edu)
Qualitative Proteomics (how to obtain high-confidence high-throughput protein identification!) James A. Mobley, Ph.D. Director of Research in Urology Associate Director of Mass Spectrometry (contact: mobleyja@uab.edu)
ADVANCEMENT IN PROTEIN INFERENCE FROM SHOTGUN PROTEOMICS USING PEPTIDE DETECTABILITY
 ADVANCEMENT IN PROTEIN INFERENCE FROM SHOTGUN PROTEOMICS USING PEPTIDE DETECTABILITY PEDRO ALVES, 1 RANDY J. ARNOLD, 2 MILOS V. NOVOTNY, 2 PREDRAG RADIVOJAC, 1 JAMES P. REILLY, 2 HAIXU TANG 1, 3* 1) School
Bioinformatics 2. Yeast two hybrid. Proteomics. Proteomics
 GENOME Bioinformatics 2 Proteomics protein-gene PROTEOME protein-protein METABOLISM Slide from http://www.nd.edu/~networks/ Citrate Cycle Bio-chemical reactions What is it? Proteomics Reveal protein Protein
LECTURE-13. Peptide Mass Fingerprinting HANDOUT. Mass spectrometry is an indispensable tool for qualitative and quantitative analysis of
 LECTURE-13 Peptide Mass Fingerprinting HANDOUT PREAMBLE Mass spectrometry is an indispensable tool for qualitative and quantitative analysis of proteins, drugs and many biological moieties to elucidate
Proteomics: the first decade and beyond. (2003) Patterson and Aebersold Nat Genet 33 Suppl: from
 Patterson and Aebersold Nat Genet 33 Suppl: from") Advances in mass spectrometry and the generation of large quantities of nucleotide sequence information, combined with computational algorithms that could correlate the two, led to the emergence of proteomics
Advances in mass spectrometry and the generation of large quantities of nucleotide sequence information, combined with computational algorithms that could correlate the two, led to the emergence of proteomics
The Power of LC MALDI: Identification of Proteins by LC MALDI MS/MS Using the Applied Biosystems 4700 Proteomics Analyzer with TOF/TOF Optics
 APPLICATION NOTE TOF MS The Power of LC MALDI: Identification of Proteins by LC MALDI MS/MS Using the Applied Biosystems 4700 Proteomics Analyzer with TOF/TOF Optics Purpose The Applied Biosystems 4700
High-Throughput Protein Quantitation Using Multiple Reaction Monitoring
 High-Throughput Protein Quantitation Using Multiple Reaction Monitoring Application Note Authors Ning Tang, Christine Miller, Joe Roark, Norton Kitagawa and Keith Waddell Agilent Technologies, Inc. Santa
All Ions MS/MS: Targeted Screening and Quantitation Using Agilent TOF and Q-TOF LC/MS Systems
 All Ions MS/MS: Targeted Screening and Quantitation Using Agilent TOF and Q-TOF LC/MS Systems Technical Overview Introduction All Ions MS/MS is a technique that is available for Agilent high resolution
On Optimizing the Non-metric Similarity Search in Tandem Mass Spectra by Clustering
 On Optimizing the Non-metric Similarity Search in Tandem Mass Spectra by Clustering Jiří Novák, David Hoksza, Jakub Lokoč, and Tomáš Skopal Siret Research Group, Faculty of Mathematics and Physics, Charles
Mass spectrometry in proteomics
 I519 Introduction to Bioinformatics, Fall, 2013 Mass spectrometry in proteomics Haixu Tang School of Informatics and Computing Indiana University, Bloomington Modified from: www.bioalgorithms.info Outline
Tutorial 2: Analysis of DIA data in Skyline
 Tutorial 2: Analysis of DIA data in Skyline In this tutorial we will learn how to use Skyline to perform targeted post-acquisition analysis for peptide and inferred protein detection and quantitation using
Proteome-wide label-free quantification with MaxQuant. Jürgen Cox Max Planck Institute of Biochemistry July 2011
 Proteome-wide label-free quantification with MaxQuant Jürgen Cox Max Planck Institute of Biochemistry July 2011 MaxQuant MaxQuant Feature detection Data acquisition Initial Andromeda search Statistics
Tandem mass spectra were extracted from the Xcalibur data system format. (.RAW) and charge state assignment was performed using in house software
 and charge state assignment was performed using in house software") Supplementary Methods Software Interpretation of Tandem mass spectra Tandem mass spectra were extracted from the Xcalibur data system format (.RAW) and charge state assignment was performed using in house
Supplementary Methods Software Interpretation of Tandem mass spectra Tandem mass spectra were extracted from the Xcalibur data system format (.RAW) and charge state assignment was performed using in house
Agilent MassHunter Quantitative Data Analysis
 Agilent MassHunter Quantitative Data Analysis Presenters: Howard Sanford Stephen Harnos MassHunter Quantitation: Batch Table, Compound Information Setup, Calibration Curve and Globals Settings 1 MassHunter
Analyst Software. Automatic Optimization Tutorial
 This document is provided to customers who have purchased AB Sciex equipment to use in the operation of such AB Sciex equipment. This document is copyright protected and any reproduction of this document
SeqAn and OpenMS Integration Workshop. Temesgen Dadi, Julianus Pfeuffer, Alexander Fillbrunn The Center for Integrative Bioinformatics (CIBI)
") SeqAn and OpenMS Integration Workshop Temesgen Dadi, Julianus Pfeuffer, Alexander Fillbrunn The Center for Integrative Bioinformatics (CIBI) Mass-spectrometry data analysis in KNIME Julianus Pfeuffer,
SeqAn and OpenMS Integration Workshop Temesgen Dadi, Julianus Pfeuffer, Alexander Fillbrunn The Center for Integrative Bioinformatics (CIBI) Mass-spectrometry data analysis in KNIME Julianus Pfeuffer,
A TMT-labeled Spectral Library for Peptide Sequencing
 A TMT-labeled Spectral Library for Peptide Sequencing by Jianqiao Shen A thesis presented to the University of Waterloo in fulfillment of the thesis requirement for the degree of Master of Mathematics
Parallel Algorithms For Real-Time Peptide-Spectrum Matching
 Parallel Algorithms For Real-Time Peptide-Spectrum Matching A Thesis Submitted to the College of Graduate Studies and Research in Partial Fulfillment of the Requirements for the degree of Master of Science
Orbital Insight Energy: Oil Storage v5.1 Methodologies & Data Documentation
 Orbital Insight Energy: Oil Storage v5.1 Methodologies & Data Documentation Overview and Summary Orbital Insight Global Oil Storage leverages commercial satellite imagery, proprietary computer vision algorithms,
Protein Post-translational Modifications Mapping with MS/MS based Frequent Interval Pattern Mining
 Protein Post-translational Modifications Mapping with MS/MS based Frequent Interval Pattern Mining Han Liu Department of Computer Science University of Illinois at Urbana-Champaign Email: hanliu@ncsa.uiuc.edu
A Description of the CPTAC Common Data Analysis Pipeline (CDAP)
") A Description of the CPTAC Common Data Analysis Pipeline (CDAP) v. 01/14/2014 Summary The purpose of this document is to describe the software programs and output files of the Common Data Analysis Pipeline
A Description of the CPTAC Common Data Analysis Pipeline (CDAP) v. 01/14/2014 Summary The purpose of this document is to describe the software programs and output files of the Common Data Analysis Pipeline
VCell Tutorial. Building a Rule-Based Model
 VCell Tutorial Building a Rule-Based Model We will demonstrate how to create a rule-based model of EGFR receptor interaction with two adapter proteins Grb2 and Shc. A Receptor-monomer reversibly binds
Mass spectrometry has been used a lot in biology since the late 1950 s. However it really came into play in the late 1980 s once methods were
 Mass spectrometry has been used a lot in biology since the late 1950 s. However it really came into play in the late 1980 s once methods were developed to allow the analysis of large intact (bigger than
Spectronaut Pulsar. User Manual
 Spectronaut Pulsar User Manual 1 General Information... 6 1.1 Computer System Requirements... 6 1.2 Scope of Spectronaut Software... 6 1.3 Spectronaut Pulsar... 6 1.4 Spectronaut Release Features... 7
An SVM Scorer for More Sensitive and Reliable Peptide Identification via Tandem Mass Spectrometry
 An SVM Scorer for More Sensitive and Reliable Peptide Identification via Tandem Mass Spectrometry Haipeng Wang, Yan Fu, Ruixiang Sun, Simin He, Rong Zeng, and Wen Gao Pacific Symposium on Biocomputing
Peptide Mass Fingerprinting (PMF) Data Acquisition Using the Voyager DE- PRO Database Search with PMF Data using Ms-Fit
 Data Acquisition Using the Voyager DE- PRO Database Search with PMF Data using Ms-Fit") Peptide Mass Fingerprinting (PMF) Data Acquisition Using the Voyager DE- PRO Introduction page 1 Sample preparation (ZipTip) page 1 Data acquisition using the Voyager DE Pro page 5 Resolution and mass
Peptide Mass Fingerprinting (PMF) Data Acquisition Using the Voyager DE- PRO Introduction page 1 Sample preparation (ZipTip) page 1 Data acquisition using the Voyager DE Pro page 5 Resolution and mass
Effective Strategies for Improving Peptide Identification with Tandem Mass Spectrometry
 Effective Strategies for Improving Peptide Identification with Tandem Mass Spectrometry by Xi Han A thesis presented to the University of Waterloo in fulfillment of the thesis requirement for the degree
Self-assembling covalent organic frameworks functionalized. magnetic graphene hydrophilic biocomposite as an ultrasensitive
 Electronic Supplementary Material (ESI) for Nanoscale. This journal is The Royal Society of Chemistry 2017 Electronic Supporting Information for: Self-assembling covalent organic frameworks functionalized
Improved 6- Plex TMT Quantification Throughput Using a Linear Ion Trap HCD MS 3 Scan Jane M. Liu, 1,2 * Michael J. Sweredoski, 2 Sonja Hess 2 *
 Improved 6- Plex TMT Quantification Throughput Using a Linear Ion Trap HCD MS 3 Scan Jane M. Liu, 1,2 * Michael J. Sweredoski, 2 Sonja Hess 2 * 1 Department of Chemistry, Pomona College, Claremont, California
1. Prepare the MALDI sample plate by spotting an angiotensin standard and the test sample(s).
.") Analysis of a Peptide Sequence from a Proteolytic Digest by MALDI-TOF Post-Source Decay (PSD) and Collision-Induced Dissociation (CID) Standard Operating Procedure Purpose: The following procedure may
Analysis of a Peptide Sequence from a Proteolytic Digest by MALDI-TOF Post-Source Decay (PSD) and Collision-Induced Dissociation (CID) Standard Operating Procedure Purpose: The following procedure may
In order to compare the proteins of the phylogenomic matrix, we needed a similarity
 Similarity Matrix Generation In order to compare the proteins of the phylogenomic matrix, we needed a similarity measure. Hamming distances between phylogenetic profiles require the use of thresholds for
Current verification practices with a particular focus on dust
 Current verification practices with a particular focus on dust Marion Mittermaier and Ric Crocker Outline 1. Guide to developing verification studies 2. Observations at the root of it all 3. Grid-to-point,
MS-based proteomics to investigate proteins and their modifications
 MS-based proteomics to investigate proteins and their modifications Francis Impens VIB Proteomics Core October th 217 Overview Mass spectrometry-based proteomics: general workflow Identification of protein
Reagents. Affinity Tag (Biotin) Acid Cleavage Site. Figure 1. Cleavable ICAT Reagent Structure.
 Acid Cleavage Site. Figure 1. Cleavable ICAT Reagent Structure.") DATA SHEET Protein Expression Analysis Reagents Background The ultimate goal of proteomics is to identify and quantify proteins that are relevant to a given biological state; and to unearth networks of
DATA SHEET Protein Expression Analysis Reagents Background The ultimate goal of proteomics is to identify and quantify proteins that are relevant to a given biological state; and to unearth networks of
Purdue-UAB Botanicals Center for Age- Related Disease
 Purdue-UAB Botanicals Center for Age- Related Disease MALDI-TOF Mass Spectrometry Fingerprinting Technique Landon Wilson MALDI-TOF mass spectrometry is an advanced technique for rapid protein identification
Analyst Software. Peptide and Protein Quantitation Tutorial
 This document is provided to customers who have purchased AB Sciex equipment to use in the operation of such AB Sciex equipment. This document is copyright protected and any reproduction of this document
Towards the Prediction of Protein Abundance from Tandem Mass Spectrometry Data
 Towards the Prediction of Protein Abundance from Tandem Mass Spectrometry Data Anthony J Bonner Han Liu Abstract This paper addresses a central problem of Proteomics: estimating the amounts of each of
CS Homework 3. October 15, 2009
 CS 294 - Homework 3 October 15, 2009 If you have questions, contact Alexandre Bouchard (bouchard@cs.berkeley.edu) for part 1 and Alex Simma (asimma@eecs.berkeley.edu) for part 2. Also check the class website
Ligand Scout Tutorials
 Ligand Scout Tutorials Step : Creating a pharmacophore from a protein-ligand complex. Type ke6 in the upper right area of the screen and press the button Download *+. The protein will be downloaded and