IRENE: Visitor from the Extratidal World
|
|
|
- Roger Norris
- 5 years ago
- Views:
Transcription
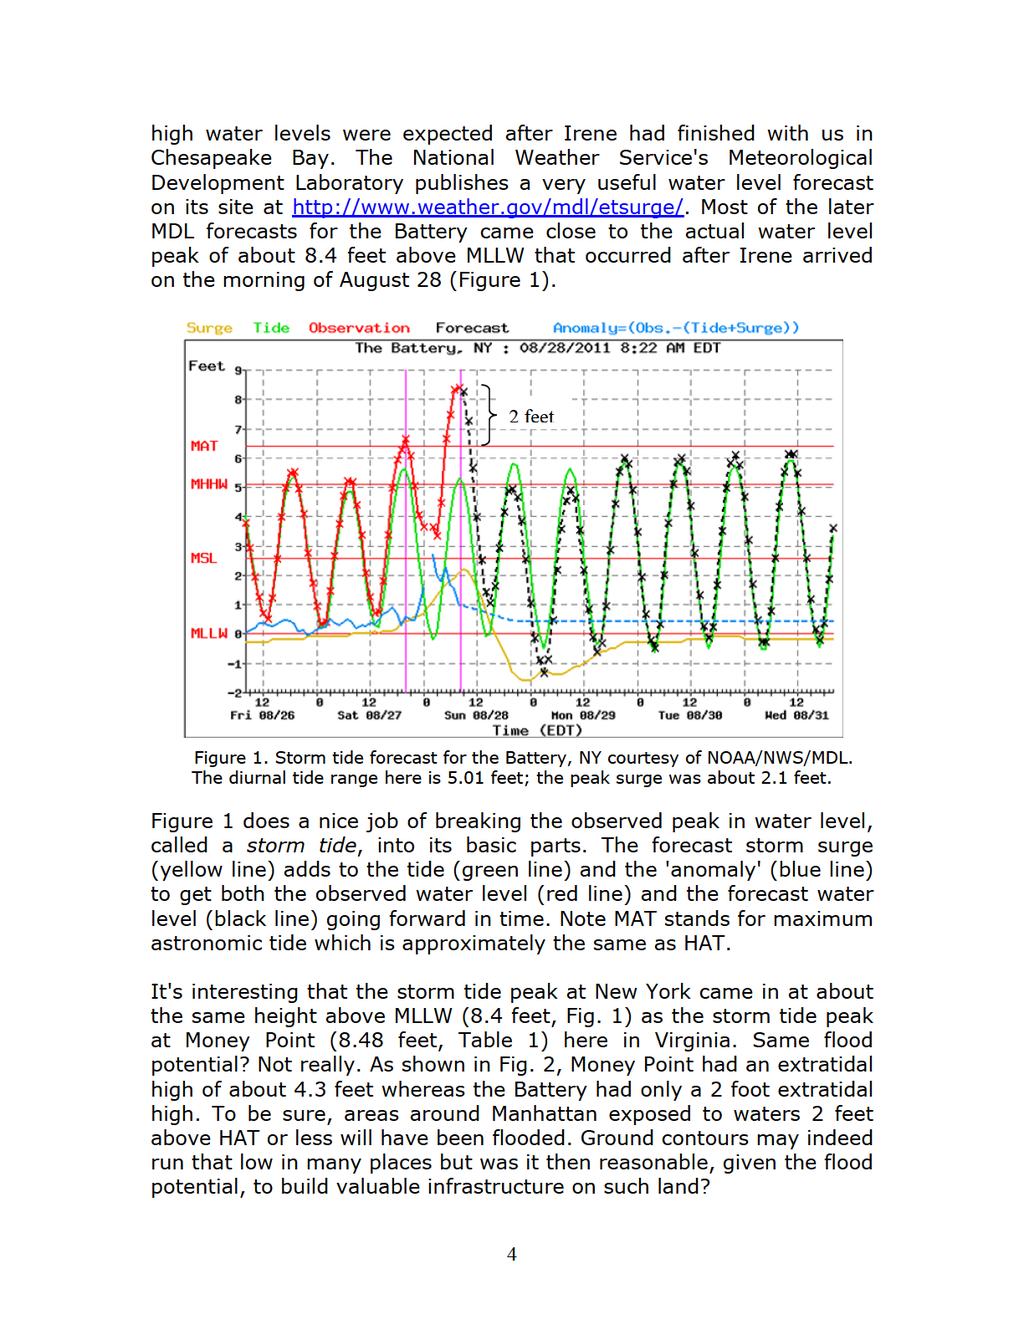
1 IRENE: Visitor from the Extratidal World John Boon Professor Emeritus Virginia Institute of Marine Science School of Marine science College of William and Mary Hurricane Irene did not come to Hampton Roads from outer space but if she had, we'd call her an 'extraterrestrial' visitor. Instead she belongs to the extratidal world, a rare place and time where tides predicted ones anyway - do not go. A place and time where extratidal water finds its way into our yards and driveways and other places higher up where we would rather it didn't go. It requires a storm like Irene to take it there. Perhaps not so rare the times at least. We experience extratidal water fairly often in minor amounts but in much bigger doses during events like the so-called 'Storm of the Century' in Chesapeake Bay, the August 1933 hurricane (8.02 feet above MLLW at Sewells Point). In more recent times several storms have produced similar extremes in water level: Isabel in September 2003, Ernesto in September 2006, Nor'Ida in November 2009 and now Irene in August About one every three years entering the second decade of the millennium. An extratidal water level is one that exceeds highest astronomic tide (HAT) or falls below lowest astronomic tide (LAT). In between is the intertidal zone. The National Oceanic and Atmospheric Administration (NOAA) has defined HAT as the highest predicted tide over the National Tidal Datum Epoch (NTDE), a specific 19-year period that currently includes the years 1983 through LAT is similarly defined as the lowest predicted tide over the NTDE. Both HAT and LAT are tidal datums; their elevations are given relative to other tidal datums such as mean sea level (MSL) defined as the average water level over the NTDE and two other 'offsets' from MSL, mean higher high water (MHHW) and mean lower low water (MLLW). Their elevations above tide gauge 'zero' can now be found on NOAA's Tides and Currents web site: under Products >Datums. NOAA does not change the NTDE very often; only once every twenty years or so depending on sea level trends measured at tide stations it maintains around the country. Until the time comes to pick another
2 19-year epoch, all of the tidal datums, including HAT, will remain fixed relative to the land. As the most extreme tidal datum in the upward direction (higher than MHHW, the next most extreme datum), HAT is the natural choice for marking the beginning of extreme water levels. Only when water levels rise above HAT and become extratidal do we have reason to be concerned about flooding in the areas surrounding our tidal waterways. Disclaimer: The data presented below include peak water levels from six-minute observations at NOAA stations, both verified and unverified (Irene), available at Additional data include peak water levels from unverified six-minute water level observations at VIMS-owned tide stations in Jamestown, VA (N. Ferry Pier) and Back River (Dandy Haven). Data and graphics for these stations are available at Note also that VIMS has independently determined HAT and LAT relative to MSL over the NTDE at nine stations in lower Chesapeake Bay; These offsets are similar, but not identical, to those NOAA has determined more recently for its active stations in Chesapeake Bay (not including Jamestown and Back River). HAT referenced data are new and should be used with due caution. How high did the water rise during Irene? How high compared with previous storms for the last decade in lower Chesapeake Bay? Answers for eight active water level stations in the region are provided in tables below (see for station locations). Table 1. Peak Water Levels in feet above MLLW* Station Isabel Ernesto Nor'Ida Irene Datum Money Point MLLW Sewells Point MLLW Jamestown** no data no data MLLW Back River** no data no data MLLW CBBT MLLW Kiptopeke MLLW Yorktown no data MLLW Windmill Point no data MLLW * NOAA data verified for all storms except Irene (unverified) ** VIMS water level station (unverified data use with caution) 2
3 Table 2. Peak Water Levels in feet above HAT* Station Isabel Ernesto Nor'Ida Irene Datum Money Point HAT Sewells Point HAT Jamestown** no data no data HAT Back River** no data no data HAT CBBT HAT Kiptopeke HAT Yorktown no data HAT Windmill Point no data HAT * HAT as determined by VIMS analysis use with caution ** VIMS water level station (unverified data use with caution) Table 1 contains peak water levels referenced to MLLW, the chart datum (datum used to reference depths on NOAA's nautical charts). Table 2 shows the same information referenced to the extratidal datum, HAT. A pair of problems come up when using MLLW as the reference: one, numbers between 7 and 8 appear often and have been mistakenly reported in the media and elsewhere as storm surge, ignoring the contribution by astronomic tides and other forms of sea level change; two, there is nothing in Table 1 telling us where normal tides end and extreme water levels begin in other words there is no information about the range of tide at the place in question. For example, the diurnal tide range (vertical interval between MHHW and MLLW) is 3.22 feet at Money Point on the southern branch of the Elizabeth River and 1.39 feet at Windmill Point near the Rappahannock River entrance. During Ernesto, peak water levels for these stations were 5.74 feet and 5.23 feet above MLLW, respectively. Think Money Point got the worst of it? Not really. Table 2 shows that Windmill Point had water 3.27 feet above the level where its tides are predicted to go whereas Money Point had only 1.66 feet of unusual water on its shores. During Irene, Windmill Point got about the same amount of water above HAT as did Kiptopeke near the Bay entrance but its peak is almost two feet lower than Kiptopeke's when referenced to MLLW. Unlike Hurricane Isabel which impacted mostly the NC-VA coast, Irene managed to visit several other east coast states along the way and we did not lack for Jim Cantore media moments bringing that to our attention. At the Battery in New York City, for example, some very 3
4
5
UNDERSTANDING STORM TIDES
 UNDERSTANDING STORM TIDES Run from the water, hide from the wind.. CATEGORY CATEGORY CATEGORY CATEGORY CATEGORY 1 2 3 4 5 WIND 74-95 mph 64-82 knots 96-110 mph 83-95 knots 111-130 mph 96-113 knots 131-155
Planning for Annapolis Sea Level Rise and Future Extreme Water Levels
 Planning for Annapolis Sea Level Rise and Future Extreme Water Levels U.S. Naval Academy Sea Level Rise Advisory Council 31 October 2017 CAPT Emil Petruncio, USN (Ret.), PhD Associate Professor Gina Henderson
The Science of Sea Level Rise and the Impact of the Gulf Stream
 Old Dominion University ODU Digital Commons July 29, 2016: The Latest in Sea Level Rise Science Hampton Roads Sea Level Rise/Flooding Adaptation Forum 7-29-2016 The Science of Sea Level Rise and the Impact
Between 6 am to 4 pm the next day approximately 7.5 inches fell. Chesapeake Bay Bridge Tunnel NOAA Tide Gage
 Ocean Park Alternative Drainage Route Analysis February, 2012 November 11 14, 2009 Between 6 am to 4 pm the next day approximately 7.5 inches fell Chesapeake Bay Bridge Tunnel NOAA Tide Gage Hurricane
Analysis of Tides and Storm Surge from Observational Records in the Delaware Inland Bays
 Analysis of Tides and Storm Surge from Observational Records in the Delaware Inland Bays John Callahan Delaware Geological Survey Coastal GeoTools Conference March 30 April 2, 2015 Charleston, SC Outline
NOAA Inundation Dashboard
 NOAA Inundation Dashboard Audra Luscher & Paul Fanelli NOS Center for Operational Oceanographic Products & Services (CO-OPS) Hampton Roads Sea Level Rise/Flooding Adaptation Forum July 29, 2016 http://tidesandcurrents.noaa.gov/inundationdb/newyork.html
!!!! ANALYSIS OF EXTREME WATER LEVELS IN THE LOWER CHESAPEAKE BAY. A Thesis. Presented to. The Faculty of the School of Marine Science
 ANALYSIS OF EXTREME WATER LEVELS IN THE LOWER CHESAPEAKE BAY A Thesis Presented to The Faculty of the School of Marine Science The College of William and Mary in Virginia In Partial Fulfillment Of the
The Storm Surge and Inundation Modeling for Nor easter Event in the Chesapeake Bay, and Super-Regional Testbed in the Gulf of Mexico
 The Storm Surge and Inundation Modeling for Nor easter Event in the Chesapeake Bay, and Super-Regional Testbed in the Gulf of Mexico Harry Wang, Jie Gao, Derek Loftis and Yi-cheng Teng Department of Physical
Coastal Storms of the New Jersey Shore
 Coastal Storms of the New Jersey Shore Dr. Steven G. Decker Dept. of Environmental Sciences School of Environmental and Biological Sciences Rutgers University May 25, 2011 Overview Threats Historical Examples
Joint Occurrence and Probabilities of Tides and Rainfall
 Joint Occurrence and Probabilities of Tides and Rainfall City of Virginia Beach, Virginia CIP 7-030, PWCN-15-0014, Work Orders 2 and 5A Final Report Date: October 9, 2017 Submitted to: City of Virginia
Signals of sea-level rise in Delaware and Chesapeake Bay tides
 Signals of sea-level rise in Delaware and Chesapeake Bay tides Andrew C. Ross and Raymond G. Najjar Pennsylvania State University Also thanks to Ming Li, Serena Lee, Fan Zhang, Wei Liu Observations show
NOAA s National Ocean Service. Center for Operational Oceanographic Products and Services
 NOAA s National Ocean Service Center for Operational Oceanographic Products and Services Richard Edwing, CO-OPS Acting Director January 27, 2010 Outline CO-OPS Overview Programs Observing Systems PORTS
Sea Level Rise and Hurricane Florence storm surge research methodology
 Sea Level Rise and Hurricane Florence storm surge research methodology Hurricane Florence storm surge analysis was conducted using a variety of input sources. In order to determine the maximum storm surge
North Atlantic Coast Comprehensive Study (NACCS) APPENDIX A: ENGINEERING
 APPENDIX A: ENGINEERING") North Atlantic Coast Comprehensive Study (NACCS) APPENDIX A: ENGINEERING NORTH ATLANTIC COAST COMPREHENSIVE STUDY: RESILIENT ADAPTATION TO INCREASING RISK Appendix A - Engineering Table of Contents North
North Atlantic Coast Comprehensive Study (NACCS) APPENDIX A: ENGINEERING NORTH ATLANTIC COAST COMPREHENSIVE STUDY: RESILIENT ADAPTATION TO INCREASING RISK Appendix A - Engineering Table of Contents North
Eastern Shore Weather and Climate. Bill Sammler Warning Coordination Meteorologist National Weather Service Wakefield, VA
 Eastern Shore Weather and Climate Bill Sammler Warning Coordination Meteorologist National Weather Service Wakefield, VA About The NWS The National Weather Service is: A Federal Government Agency Part
Latest trends in sea level rise and storm surges in Maine Peter A. Slovinsky, Marine Geologist
 Latest trends in sea level rise and storm surges in Maine Peter A. Slovinsky, Marine Geologist Image from Chebeague.org Maine s glacial geology and historic sea level rise trends Current sea level trends
Shape of the Earth. Data Output by the Receiver
 It is quite common for confusion to arise about the process used during a hydrographic survey when GPS-derived water surface elevation is incorporated into the data as an RTK Tide correction. This article
Turn and Face the Strange: Economic Impacts of Climate Change Sea Level Rise and Coastal Flooding E2Tech Forum June 21, 2018
 Turn and Face the Strange: Economic Impacts of Climate Change Sea Level Rise and Coastal Flooding E2Tech Forum June 21, 2018 Peter A. Slovinsky, Marine Geologist Maine Geological Survey Image from Chebeague.org
Evaluation of Storm Tide Measurements at Panama City Beach, FL
 Evaluation of Storm Tide Measurements at Panama City Beach, FL 1993-2007 Prepared by Mark E. Leadon Beaches and Shores Resource Center Florida State University May 2009 Prepared for Florida Department
Preliminary Vulnerability Assessment of Coastal Flooding Threats - Taylor County, Florida
 Preliminary Vulnerability Assessment of Coastal Flooding Threats - Taylor County, Florida North Central Florida Regional Planning Council Northeast Florida Regional Council April 28, 2016 BACKGROUND This
A Realtime Forecasting System for the Chesapeake Bay Tributaries: Interoperability and Metadata for Automation
 A Realtime Forecasting System for the Chesapeake Bay Tributaries: Interoperability and Metadata for Automation David Forrest Virginia Institute of Marine Science drf@vims.edu East Coast ELCIRC grid Mixed
HURRICANE FRANCES CHARACTERISTICS and STORM TIDE EVALUATION
 HURRICANE FRANCES CHARACTERISTICS and STORM TIDE EVALUATION ((DRAFT)) By Robert Wang and Michael Manausa Sponsored by Florida Department of Environmental Protection, Bureau of Beaches and Coastal Systems
CLIMATE CHANGE IN HAMPTON ROADS PHASE III: SEA LEVEL RISE IN HAMPTON ROADS, VIRGINIA
 CLIMATE CHANGE IN HAMPTON ROADS PHASE III: SEA LEVEL RISE IN HAMPTON ROADS, VIRGINIA This report was funded, in part, by the Virginia Coastal Zone Management Program at the Virginia Department of Environmental
Comparative Analysis of Hurricane Vulnerability in New Orleans and Baton Rouge. Dr. Marc Levitan LSU Hurricane Center. April 2003
 Comparative Analysis of Hurricane Vulnerability in New Orleans and Baton Rouge Dr. Marc Levitan LSU Hurricane Center April 2003 In order to compare hurricane vulnerability of facilities located in different
SLR: Nuisance flooding patterns along the Coastal Bend
 SLR: Nuisance flooding patterns along the Coastal Bend Philippe Tissot Conrad Blucher Institute Resilient Texas: Planning for Sea Level Rise August 8, 2017 Hurricane Ike - 9/13/2008 Marina Photos Courtesy
Weather Briefing Mixed Winter Storm Event February 26-27, 2013
 Weather Briefing Mixed Winter Storm Event February 26-27, 2013 Prepared 1200 PM EST Tuesday, February 26th, 2013 Joe Miketta NOAA s NJ Forecast Office http://www.erh.noaa.gov/phi/ Purpose of Briefing Briefing
GSA DATA REPOSITORY D. Livsey and A.R. Simms
 GSA DATA REPOSITORY 2013273 D. Livsey and A.R. Simms Supplementary Information The supplementary information is divided into three sections: (1) Tide model and datums, (2) Vertical error calculation, and
Integrating Climate Adaptation in Hawaii Disaster Risk Management
 Integrating Climate Adaptation in Hawaii Disaster Risk Management Building Resilient Communities HCPO/HIGICC 2009 Conference September 23-25 Sheraton Waikiki Introduction What are weather/climate-related
SOUTH AFRICAN TIDE TABLES
 SAN HO-2 2018 SOUTH AFRICAN TIDE TABLES PUBLISHED BY THE HYDROGRAPHER SOUTH AFRICAN NAVY PRIVATE BAG X1 TOKAI, 7966 COPYRIGHT RESERVED ISBN 978-0-9869717-9-2 CONTENTS Preface.... (iii) Tidal Levels......(iv)
SOUTH AFRICAN TIDE TABLES
 SAN HO-2 2019 SOUTH AFRICAN TIDE TABLES PUBLISHED BY THE HYDROGRAPHER SOUTH AFRICAN NAVY PRIVATE BAG X1 TOKAI, 7966 COPYRIGHT RESERVED ISBN 978-0-9947002-0-9 Intentionally left blank CONTENTS Preface....
Preliminary Data Release for the Humboldt Bay Sea Level Rise Vulnerability Assessment: Humboldt Bay Sea Level Rise Inundation Mapping
 Preliminary Data Release for the Humboldt Bay Sea Level Rise Vulnerability Assessment: Humboldt Bay Sea Level Rise Inundation Mapping Prepared by: Jeff Anderson, Northern Hydrology & Engineering (jeff@northernhydrology.com)
Mapping Predicted Tidal Exposure Durations Using a MLLW-Referenced LiDAR Terrain Model
 Mapping Predicted Tidal Exposure Durations Using a MLLW-Referenced LiDAR Terrain Model for Management of Spartina alterniflora in Willapa Bay, Washington Meeting the Challenge: Invasive Plants in PNW Ecosystems
ASSESSING FUTURE EXPOSURE: GLOBAL AND REGIONAL SEA LEVEL RISE SCENARIOS FOR THE UNITED STATES
 ASSESSING FUTURE EXPOSURE: GLOBAL AND REGIONAL SEA LEVEL RISE SCENARIOS FOR THE UNITED STATES Chesapeake Bay Program Climate Resiliency Workgroup Conference Call May 15, 2017 William Sweet NOAA CO-OPS
Mapping rainfall and flooding
 Mapping rainfall and flooding BY DAVID WALBERT Although Hurricane Floyd was the biggest storm of 1999 and the one most remembered, eastern North Carolina was hit by three hurricanes in a six-week period
Location. Datum. Survey. information. Etrometa. Step Gauge. Description. relative to Herne Bay is -2.72m. The site new level.
 Tide Gauge Location OS: 616895E 169377N WGS84: Latitude: 51 o 22.919196 N Longitude: 01 o 6.9335907 E Instrument Type Etrometa Step Gauge Benchmarks Benchmark TGBM = 5.524m above Ordnance Datum Newlyn
HURRICANE SURVIVAL KIT
 HURRICANE SURVIVAL KIT DEFINITION-A hurricane is a very vast and powerful storm that originates in the tropics of the Atlantic Ocean. They become hurricanes when the sustained winds associated with it
Your web browser (Safari 7) is out of date. For more security, comfort and the best experience on this site: Update your browser Ignore
 is out of date. For more security, comfort and the best experience on this site: Update your browser Ignore") Your web browser (Safari 7) is out of date. For more security, comfort and the best experience on this site: Update your browser Ignore Educator Version 2005 HU RRICANE SEASO N Map traces a stormy season
Your web browser (Safari 7) is out of date. For more security, comfort and the best experience on this site: Update your browser Ignore Educator Version 2005 HU RRICANE SEASO N Map traces a stormy season
A Perfect Storm: The Collision of Tropical Cyclones, Climate Change and Coastal Population Growth. Jeff Donnelly Woods Hole Oceanographic Institution
 A Perfect Storm: The Collision of Tropical Cyclones, Climate Change and Coastal Population Growth Jeff Donnelly Woods Hole Oceanographic Institution Recent Hurricane Trends What Might the Future Hold?
Positioning the Pacific: NOAA s Geospatial Activities. Juliana Blackwell, Director NOAA s National Geodetic Survey March 6, 2012
 Positioning the Pacific: NOAA s Geospatial Activities Juliana Blackwell, Director NOAA s National Geodetic Survey March 6, 2012 A Common Problem of the Early 19 th Century 1807 President Thomas Jefferson
Impact of Sea Level Rise on Future Storm-induced Coastal Inundation
 Impact of Sea Level Rise on Future Storm-induced Coastal Inundation Changsheng Chen School for Marine Science and Technology, University of Massachusetts-Dartmouth Email: c1chen@umassd.edu 04/14/2015 Outline
Modeling New York in D-Flow FM
 Modeling New York in D-Flow FM Delft, 30 th of October 2013 Internship Tuinhof, T.J. (Taco) August - October 2013 Supervisors: Sander Post (Royal HaskoningDHV) Maarten van Ormondt (Deltares) Contents Introduction...
8.1 Attachment 1: Ambient Weather Conditions at Jervoise Bay, Cockburn Sound
 8.1 Attachment 1: Ambient Weather Conditions at Jervoise Bay, Cockburn Sound Cockburn Sound is 20km south of the Perth-Fremantle area and has two features that are unique along Perth s metropolitan coast
NWS HURRICANES June 3, 2015
 NWS HURRICANES June 3, 2015 Hurricane Season June 1 November 30 2 What s the concern? All tropical systems passing within 125nm of central Maryland since 1950 Mid-Atlantic Hurricanes Greatest Risk: August
Significant Coastal Storm Today through Thursday, 11/7-8. Weather Briefing
 Significant Coastal Storm Today through Thursday, 11/7-8 Weather Briefing Prepared 10:00 am EST Wednesday, November 7, 2012 Presented by Gary Conte, Warning Coordination Meteorologist NOAA s National Weather
SLR Calculator: Sea Level Rise (SLR) Inundation Surface Calculator Add-in for ArcGIS Desktop & 10.4
 Inundation Surface Calculator Add-in for ArcGIS Desktop & 10.4") 1 SLR Calculator: Sea Level Rise (SLR) Inundation Surface Calculator Add-in for ArcGIS Desktop 10.3.1 & 10.4 Florida Sea Level Scenario Sketch Planning Tool Version 1.6, July 2016 University of Florida
1 SLR Calculator: Sea Level Rise (SLR) Inundation Surface Calculator Add-in for ArcGIS Desktop 10.3.1 & 10.4 Florida Sea Level Scenario Sketch Planning Tool Version 1.6, July 2016 University of Florida
TIDAL POWER!
 Tide Notes terms: spring tide, neap tide, flood tide,ebb tide, slack tide, mean low water, mean high water, sea level, diurnal tides, semidiurnal tides http://www.iit.edu/~johnsonp/smart00/lesson4.htm#highest
The Costs of Doing Nothing: Economic Consequences of Not Adapting to Sea Level Rise in the Hampton Roads Region. Photo courtesy of VIMS
 The Costs of Doing Nothing: Economic Consequences of Not Adapting to Sea Level Rise in the Hampton Roads Region Photo courtesy of VIMS Costs of Doing Nothing: Economic Consequences of Not Adapting to Sea
Semi-enclosed seas. Estuaries are only a particular type of semi-enclosed seas which are influenced by tides and rivers
 Semi-enclosed seas Estuaries are only a particular type of semi-enclosed seas which are influenced by tides and rivers Other semi-enclosed seas vary from each other, mostly by topography: Separated from
Scarborough Tide Gauge
 Tide Gauge Location OS: 504898E 488622N WGS84: Latitude: 54 16' 56.990"N Longitude: 00 23' 25.0279"W Instrument Valeport 740 (Druck Pressure Transducer) Benchmarks Benchmark Description TGBM = 4.18m above
John Callahan (Delaware Geological Survey) Kevin Brinson, Daniel Leathers, Linden Wolf (Delaware Environmental Observing System)
 Kevin Brinson, Daniel Leathers, Linden Wolf (Delaware Environmental Observing System)") John Callahan (Delaware Geological Survey) Kevin Brinson, Daniel Leathers, Linden Wolf (Delaware Environmental Observing System) Delaware is extremely vulnerable to the impacts of coastal flooding Tropical
John Callahan (Delaware Geological Survey) Kevin Brinson, Daniel Leathers, Linden Wolf (Delaware Environmental Observing System) Delaware is extremely vulnerable to the impacts of coastal flooding Tropical
Crystal Goodison & Alexis Thomas University of Florida GeoPlan Center
 Crystal Goodison & Alexis Thomas University of Florida GeoPlan Center A1A Fort Lauderdale, Hurricane Sandy, October 2012 Photo Credits: Susan Stocker, Sun Sentinel FAU s Research Report (completed Jan
Town of Cape Elizabeth: A summary of some of the latest sea level rise science and storm surge data to help guide municipal ordinance changes
 Town of Cape Elizabeth: A summary of some of the latest sea level rise science and storm surge data to help guide municipal ordinance changes May 29, 2014 Peter A. Slovinsky, Marine Geologist Maine Geological
10/24/2017. Determining Location. Where in the World are We Geodetically Speaking. Meades Ranch
 Determining Location Where in the World are We Geodetically Speaking Meades Ranch 1 How do we find the Mark? KG0640 DESCRIBED BY COAST AND GEODETIC SURVEY 1948 (MZB) KG0640 STATION IS LOCATED ABOUT 12
Sea level rise Web GIS Applications
 Florida International University FIU Digital Commons GIS Center GIS Center 2018 Sea level rise Web GIS Applications Zhaohui Fu GIS-RS Center, Florida International University, Fujen@fiu.edu Sheyla Santana
Assessing the local impacts of sea level rise
 Assessing the local impacts of sea level rise Ian Miller, Coastal Hazards Specialist Washington Sea Grant MRC Conference Port Townsend, WA 5 December 2014 With contributions from: Eric Grossman, USGS;
Coupling of Wave and Hydrodynamic Models for Predicting Coastal Inundation: A case study in Jakarta and Semarang
 Coupling of Wave and Hydrodynamic Models for Predicting Coastal Inundation: A case study in Jakarta and Semarang http://peta-maritim.bmkg.go.id/cifdp/maps Nelly Florida Riama,Andri Ramdhani, Andi Eka Sakya,,
Sea Level Rise in Connecticut A Risk-Informed Approach
 GZA GeoEnvironmental, Inc. CAFM Conference October 25, 2017 Proactive By Design. Our Company Commitment Proactive By Design. Our Company Commitment Sea Level Rise in Connecticut A Risk-Informed Approach
2017 State of U.S. High Tide Flooding with a 2018 Outlook
 2017 State of U.S. High Tide Flooding with a 2018 Outlook William V. Sweet 1, Doug Marcy 2, Gregory Dusek 1, John J. Marra 3, Matt Pendleton 4 National Oceanic and Atmospheric Administration (NOAA) Center
Ellipsoid Hydro Datum Geoid Errors
 Ellipsoid Hydro Datum Geoid Errors Jack L. Riley Office of Coast Survey Hydrographic Systems & Technology Branch Geoid Errors via Ellipsoid Hydrography? Per datum hydro Traditional & ellipsoid referenced
STORM HISTORY FOR COLLIER COUNTY
 STORM HISTORY FOR COLLIER COUNTY In 1960, when hurricane 'Donna' struck, there were approximately 15,500 people living full time in Collier County. Today there are more than 330,000 residents, most of
Hurricane Florence: Rain this heavy comes along once every 1,000 years
 Hurricane Florence: Rain this heavy comes along once every 1,000 years By Associated Press, adapted by Newsela staff on 09.17.18 Word Count 786 Level 810L Image 1. This satellite image provided by the
Gear data report from Atlantic plankton cruises for the R/V Pathfinder, March March 1962
 College of William and Mary W&M ScholarWorks Reports 1962 Gear data report from Atlantic plankton cruises for the R/V Pathfinder, March 1961 - March 1962 Woodrow L. Wilson Virginia Institute of Marine
HURRICANE CHARLEY CHARACTERISTICS and STORM TIDE EVALUATION
 HURRICANE CHARLEY CHARACTERISTICS and STORM TIDE EVALUATION By Robert Wang, Michael Manausa And Jenny Cheng Sponsored by Florida Department of Environmental Protection, Bureau of Beaches and Coastal Systems
Climate. Annual Temperature (Last 30 Years) January Temperature. July Temperature. Average Precipitation (Last 30 Years)
 January Temperature. July Temperature. Average Precipitation (Last 30 Years)") Climate Annual Temperature (Last 30 Years) Average Annual High Temp. (F)70, (C)21 Average Annual Low Temp. (F)43, (C)6 January Temperature Average January High Temp. (F)48, (C)9 Average January Low Temp.
Climate Annual Temperature (Last 30 Years) Average Annual High Temp. (F)70, (C)21 Average Annual Low Temp. (F)43, (C)6 January Temperature Average January High Temp. (F)48, (C)9 Average January Low Temp.
Field Research Facility
 Field Research Facility Sea Level Rise Observations of Sea Level rise Forces driving change Predicting future Sea Level rise Response of land surface Storm inundation coupled with Sea Level Dr. Jesse McNinch
North Slope Trends in Sea Level, Storm Frequency, Duration and Intensity
 North Slope Trends in Sea Level, Storm Frequency, Duration and Intensity Nels J. Sultan, Kenton W. Braun and Dempsey S. Thieman PND Engineers, Inc. Anchorage, Alaska, USA nsultan@pndengineers.com ABSTRACT
All of Virginia's 4 main rivers flow into the... Chesapeake Bay. Along which river would Jamestown be found? James River. Appalachian Mountains
 All of Virginia's 4 main rivers flow into the... Along which river would Jamestown be found? The Blue Ridge Mountains and Valley and Ridge are part of what large mountain system? Define climate. Define
Peter A. Slovinsky, Marine Geologist Maine Geological Survey Department of Agriculture, Conserva=on and Forestry. Funding from:
 Peter A. Slovinsky, Marine Geologist Maine Geological Survey Department of Agriculture, Conserva=on and Forestry Funding from: 50% 40% Figure modified from Griggs, 2001 10% Global Sea Level Rise Driving
HURRICANE JEANNE CHARACTERISTICS and STORM TIDE EVALUATION
 HURRICANE JEANNE CHARACTERISTICS and STORM TIDE EVALUATION ((DRAFT)) By Robert Wang and Michael Manausa Sponsored by Florida Department of Environmental Protection, Bureau of Beaches and Coastal Systems
Hurricane Matthew Threats and Impacts Briefing for Eastern NC
 Hurricane Matthew Threats and Impacts Briefing for Eastern NC October 6 th, 2016 Date/Time Created: 10/6/2016, Noon EDT National Weather Service Newport/Morehead City, NC Hurricane Matthew Key Points Changes
HURRICANE IVAN CHARACTERISTICS and STORM TIDE EVALUATION
 HURRICANE IVAN CHARACTERISTICS and STORM TIDE EVALUATION By Robert Wang and Michael Manausa Sponsored by Florida Department of Environmental Protection, Bureau of Beaches and Coastal Systems Submitted
South San Francisco Bay Shoreline Studies for EIA 11 with Project Conditions
 South San Francisco Bay Shoreline Studies for EIA 11 with Project Conditions U.S. Army Corps of Engineers San Francisco District Ms. Lisa Andes Mr. Craig Conner Dr. Frank Wu Dr. Jen-Men Lo Dr. Michael
Adaptation to Sea Level Rise A Regional Approach
 Adaptation to Sea Level Rise A Regional Approach Project Partners: in Saco Bay, ME Peter Slovinsky, Marine Geologist Maine Geological Survey, Department of Conservation Project Funding from: Saco Bay Hazards
Urban Street-Scale Hydrodynamic Flood Modeling of Micro-Burst Rainfall
 Urban Street-Scale Hydrodynamic Flood Modeling of Micro-Burst Rainfall Dr. Jon Derek Loftis Asst. Research Scientist, VA Inst. of Marine Science Sridhar Katragadda Systems Analyst, City of Virginia Beach
Progress towards Establishment of a Unique Vertical Datum for Hydrography and Land Surveying in the Emirate of Dubai-Case Study
 Progress towards Establishment of a Unique Vertical Datum for Hydrography and Land Surveying in the Emirate of Dubai-Case Study Yousuf AL MARSOOQI, Amira ALZAROUNI, Satheesh GOPI, United Arab Emirates
Hurricane Season 2010 & NOAA s Deepwater Response
 Hurricane Season 2010 & NOAA s Deepwater Response What s Happened? What Will 2010 Bring? Possible Shoreline Effects Darin Figurskey Meteorologist-in-Charge NOAA s NWS Raleigh, NC NOAA s National Weather
Beyond 2100: Committed Sea Level Rise in South Florida Produced by 21st Century Global Temperature Rise
 Beyond 2100: Committed Sea in South Florida Produced by 21st Century Global Temperature Rise Presented by: Pete Harlem Presented at GIS Day November 6, Pete Harlem, Jack Meeder and Randy Parkinson It s
HFR Surface Currents Observing System in Lower Chesapeake Bay and Virginia Coast
 HFR Surface Currents Observing System in Lower Chesapeake Bay and Virginia Coast Larry P. Atkinson, Teresa Garner, and Jose Blanco Center for Coastal Physical Oceanography Old Dominion University Norfolk,
South Florida Storm Surge
 South Florida Storm Surge Highest storm tide Everglades City/Chokoloskee in area closest to landfall Nevertheless, storm tide as high as 6 feet along Biscayne Bay about 90 miles from eye of Irma! Closer
Draft for Discussion 11/11/2016
 Coastal Risk Consulting (CRC) Climate Vulnerability Assessment for Village of Key Biscayne Deliverable 1.1 in Statement of Work. Preliminary Vulnerability Assessment Identifying Flood Hotspots Introduction...
Mediterranean Sea Level Changes over the Period
 Mediterranean Sea Level Changes over the Period 1961-2 Boris SHIRMAN and Yossi MELZER, Israel Key words: Sea level monitoring, Tide gauge operation, Tide gauge Bench Marks. ABSTRACT The mean value of the
Storm and Storm Systems Related Vocabulary and Definitions. Magnitudes are measured differently for different hazard types:
 Storm and Storm Systems Related Vocabulary and Definitions Magnitude: this is an indication of the scale of an event, often synonymous with intensity or size. In natural systems, magnitude is also related
USING MIKE TO MODEL COASTAL CATASTROPHE RISK
 USING MIKE TO MODEL COASTAL CATASTROPHE RISK Nicola Howe, Christopher Thomas, Joss Matthewman, John Maskell* 1 SUMMARY About RMS Who are we and what do we do? How do we use MIKE in our workflow? Case study:
CLIMATE READY BOSTON. Climate Projections Consensus ADAPTED FROM THE BOSTON RESEARCH ADVISORY GROUP REPORT MAY 2016
 CLIMATE READY BOSTON Sasaki Steering Committee Meeting, March 28 nd, 2016 Climate Projections Consensus ADAPTED FROM THE BOSTON RESEARCH ADVISORY GROUP REPORT MAY 2016 WHAT S IN STORE FOR BOSTON S CLIMATE?
Design and Implementation of a NOAA/NOS Cook Inlet and Shelikof Straits Circulation Modeling System
 Design and Implementation of a NOAA/NOS Cook Inlet and Shelikof Straits Circulation Modeling System Presented at a NOAA/AEA Stakeholders Meeting, August 24, 2011, Anchorage Alaska Richard Patchen and Lyon
Shoreline Evolution: City of Portsmouth, Virginia Hampton Roads and Elizabeth River Shorelines
 Shoreline Evolution: City of Portsmouth, Virginia Hampton Roads and Elizabeth River Shorelines Virginia Institute of Marine Science College of William & Mary Gloucester Point, Virginia September 2010 Shoreline
Boston Coastal Flooding Analysis and Mapping
 Boston Coastal Flooding Analysis and Mapping Philip Orton, Dara Mendeloff, Jane Mills, Malgosia Madajewicz Funding This research was funded by the National Oceanic and Atmospheric Administration (NOAA)
Draft exercise for share fair at Bozeman workshop only. This exercise is not ready for distribution. Please send helpful suggestions to
 Draft exercise for share fair at Bozeman workshop only. This exercise is not ready for distribution. Please send helpful suggestions to foleyd@plu.edu Figure list 1. Trailer photograph 2. Location map
Hurricanes in a Warming World. Jeff Donnelly Woods Hole Oceanographic Institution
 Hurricanes in a Warming World Jeff Donnelly Woods Hole Oceanographic Institution Hurricanes impacting the NE US Hurricane Sandy Was Hurricane Sandy a freak of nature? Or had we just been lucky? What are
A process-based approach toward assessing the coastal impact of projected sea level rise and severe storms
 A process-based approach toward assessing the coastal impact of projected sea level rise and severe storms Patrick Barnard 1, Cheryl Hapke 2, Li Erikson 1, Amy Foxgrover 1, and Maarten van Ormondt 3 1
Percentage of normal rainfall for April 2018 Departure from average air temperature for April 2018
 New Zealand Climate Update No 227, May 2018 Current climate April 2018 Overall, April 2018 was characterised by lower pressure than normal over and to the southeast of New Zealand. Unlike the first three
Major Hurricane Earl
 Major Hurricane Earl Advisory 33 North Carolina Threat Assessment Prepared at: 11 AM Thursday September 2, 2010 Hurricane and Tropical Storm Warnings in effect for the North Carolina Coast and Sounds NWS
The Worst Places for Hurricanes
 The Worst Places for Hurricanes Hurricane Hotspots By now, everyone knows that the last two hurricane seasons have been particularly severe. Severe yes, but compared to what? Hurricane experts are saying
METOCEAN CRITERIA FOR VIRGINIA OFFSHORE WIND TECHNOLOGY ADVANCEMENT PROJECT (VOWTAP)
") METOCEAN CRITERIA FOR VIRGINIA OFFSHORE WIND TECHNOLOGY ADVANCEMENT PROJECT (VOWTAP) Report Number: C56462/7907/R7 Issue Date: 06 December 2013 This report is not to be used for contractual or engineering
METOCEAN CRITERIA FOR VIRGINIA OFFSHORE WIND TECHNOLOGY ADVANCEMENT PROJECT (VOWTAP) Report Number: C56462/7907/R7 Issue Date: 06 December 2013 This report is not to be used for contractual or engineering
NSW Ocean Water Levels
 NSW Ocean Water Levels B Modra 1, S Hesse 1 1 Manly Hydraulics Laboratory, NSW Public Works, Sydney, NSW Manly Hydraulics Laboratory (MHL) has collected ocean water level and tide data on behalf of the
What We Know about the Climate Change Hurricane Connection Some links are indisputable; others are more subtle, but the science is improving all the
 What We Know about the Climate Change Hurricane Connection Some links are indisputable; others are more subtle, but the science is improving all the time By Michael E. Mann, Thomas C. Peterson, Susan Joy
New Jersey Department of Transportation Extreme Weather Asset Management Pilot Study
 New Jersey Department of Transportation Extreme Weather Asset Management Pilot Study Overview Prepared for: June 26, 2018 Introduction Overview of Pilot Study New Jersey s Climate New Jersey s Transportation
Water Level Prediction with Artificial Neural Network Models
 Water Level Prediction with Artificial Neural Network Models CARL STEIDLEY, ALEX SADOVSKI, PHILLIPE TISSOT, RAY BACHNAK, ZACK BOWLES Texas A&M University Corpus Christi 6300 Ocean Dr. Corpus Christi, TX
NTHMP Grant Close-Out Narrative Report November 27, Award Number: NA14NWS
 NTHMP Grant Close-Out Narrative Report November 27, 2015 Award Number: NA14NWS4670041 Project Dates: September 1, 2014 August 31, 2015 Recipient: University of Delaware Contact: James T. Kirby Center for