Weather Station Model
|
|
|
- Daisy Evans
- 5 years ago
- Views:
Transcription
1 Fun with Weather Maps! (no, really stop laughing) AOSC 200 Tim Canty Class Web Site: Topics for today: Station Model Temperature Maps Pressure Maps Fronts Lecture 03 Sept Weather Station Model Fig 1-17 Meteorology: Understanding the Atmosphere 2
2 Weather Station Model The weather station model tells you what the conditions are like at the surface Fig Weather: A Concise Introduction 3 Weather Station Model The central circle indicates cloud cover Fig Weather: A Concise Introduction 4
3 Weather Station Model The symbol located between the air temperature and dew point temperature indicates significant weather Fig Weather: A Concise Introduction 5 Weather Station Model The line indicates the direction the wind is coming from (in this case from the Northeast) and the barbs and pennants indicate wind speed Fig Weather: A Concise Introduction 6


 at the surface Fig 2-1-1 Weather: A")
4 Weather Station Model The line indicates the direction the wind is coming from (in this case from the Northeast) and the barbs and pennants indicate wind speed Fig Weather: A Concise Introduction 7 Weather Station Model Reading the pressure can be a little confusing. In the figure above, the pressure is 987 hpa (mbar) at the surface Fig Weather: A Concise Introduction 8

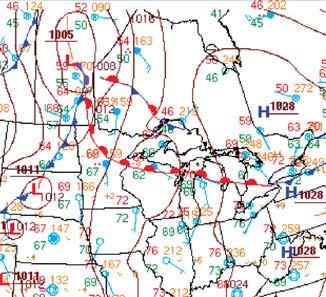

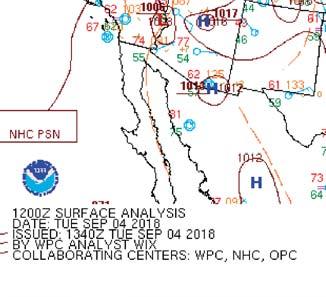
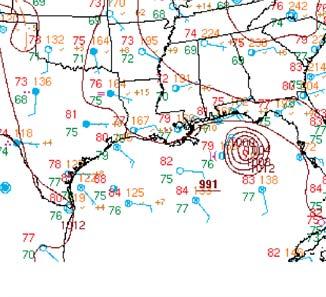
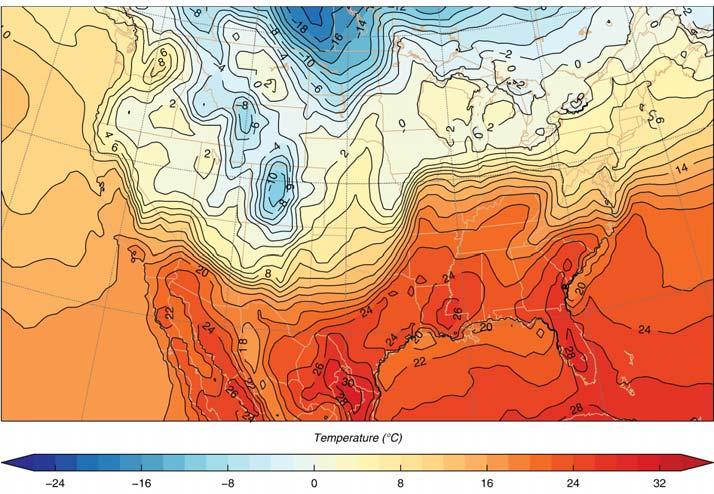
5 Today s Weather Map 9 Temperature Maps Temperature maps are often colored based on how warm (red) or cold (blue) the surface temperatures are Fig 2-2 Weather: A Concise Introduction 10
6 Temperature Maps The black lines indicate isotherms or lines of constant temperature. These maps help us identify the air masses that are controlling surface conditions and the temperature frontal boundaries between them Fig 2-2 Weather: A Concise Introduction 11 Temperature Fronts A cold front is a region where cold air is replacing warm air. It s indicated by a blue line with blue triangles pointing in the direction the air mass is moving. Fig 2-3 Weather: A Concise Introduction 12
7 Temperature Fronts A warm front is a region where warm air is replacing cold air. It s indicated by a red line with red half circles pointing in the direction the air mass is moving. Fig 2-3 Weather: A Concise Introduction 13 Temperature Fronts Recognize the fronts by the symbols!!! You might have a black and white map (like on a test.hint hint!!) and can t rely on the colors to tell you which type of front you re looking at. Fig 2-3 Weather: A Concise Introduction 14
8 Pressure Maps The black lines indicate isobars or lines of constant pressure. These maps help us identify regions of high pressure ( H ) and low pressure ( L ). They also give some indication of surface wind speed and direction. Fig 2-4 Weather: A Concise Introduction 15 Pressure Maps Generally, isobars are plotted at 4 hpa intervals If it helps, consider this like a map of surface height and you ll get an idea of where are is flowing too and how fast it s moving. Fig 2-4 Weather: A Concise Introduction 16
9 Pressure Maps Closed contours define regions of high pressure and low pressure. Fig 2-5 Weather: A Concise Introduction 17 Pressure Maps Isobars that aren t closed can still help us define regions of increasing ( ridges ) and decreasing ( troughs ) pressure. Fig 2-6 Weather: A Concise Introduction 18
10 Temperature Maps We can combine the different ways of looking at surface data to create what you may recognize as a modern weather map Fig 2-2 Weather: A Concise Introduction 19 Weather Maps We can combine the different ways of looking at surface data to create what you may recognize as a modern weather map Fig 2-2 Weather: A Concise Introduction 20
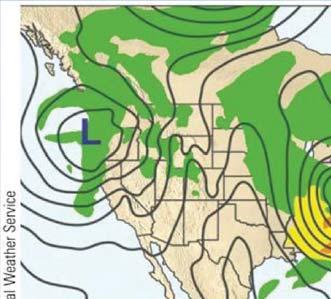
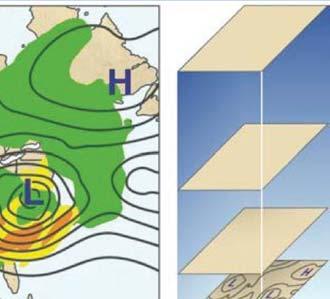
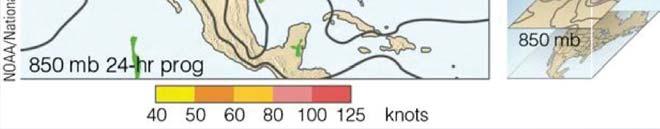
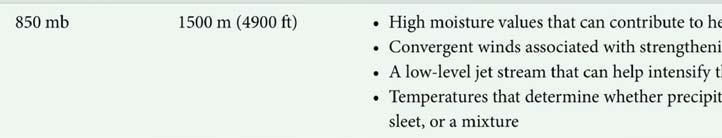
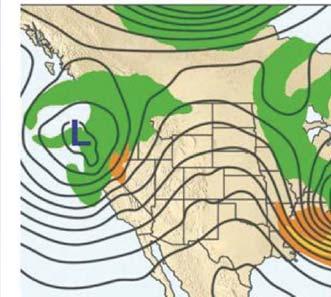
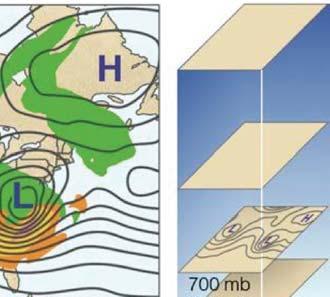
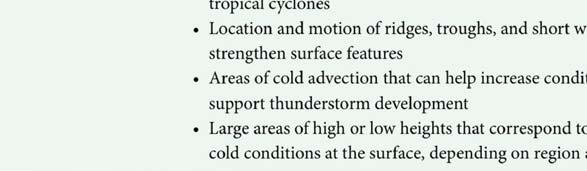
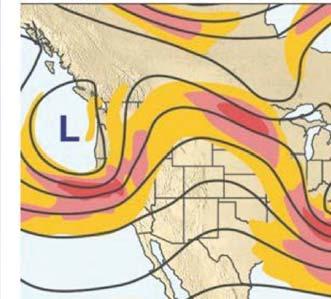
11 Upper Level Maps We can look at pressure maps at a some particular altitude but the mathematics becomes very complicated Instead, we look at altitude of a specific pressure level. The figures to the right show the height (in meters) of the 850 hpa surface. Fig 2-8 Weather: A Concise Introduction 21 Upper Level Maps The station model provides slightly different information than at the surface. The height of the pressure surface is in the position where pressure used to be. Maps of this information are called isobaric maps Fig 2-9 Weather: A Concise Introduction 22
. Notice that the fastest winds in the central US are almost above the position of the surface low pressure.")
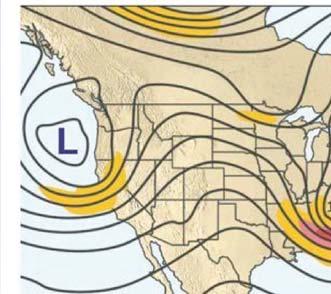
12 Weather Maps: Surface We can combine the different ways of looking at surface data to create what you may recognize as a modern weather map Fig 2-2 Weather: A Concise Introduction 23 Weather Maps: 500 mb The color contours represent wind speed (in knots). Notice that the fastest winds in the central US are almost above the position of the surface low pressure. Here the black lines are in decameters. Fig 2-10 Weather: A Concise Introduction 24
13 Weather Maps: 500 mb The height of the layer can indicate surface temperatures. Why? Fig 2-10 Weather: A Concise Introduction 25 Weather Maps: 500 mb Sometimes this information is plotted as the hpa thickness Fig 2-10 Weather: A Concise Introduction 26

14 Prognostic Charts Fig 9.5: Essentials of Meteorology 27 Prognostic Charts Fig 9.5: Essentials of Meteorology 28


15 Prognostic Charts Fig 9.5: Essentials of Meteorology 29 Prognostic Charts Fig 9.5: Essentials of Meteorology 30
Fun with Weather Maps! (no, really stop laughing) AOSC 200 Tim Canty
 AOSC 200 Tim Canty") Fun with Weather Maps! (no, really stop laughing) AOSC 200 Tim Canty Class Web Site: http://www.atmos.umd.edu/~tcanty/aosc200 Topics for today: Observations Station Model Temperature Maps Pressure Maps
Fun with Weather Maps! (no, really stop laughing) AOSC 200 Tim Canty Class Web Site: http://www.atmos.umd.edu/~tcanty/aosc200 Topics for today: Observations Station Model Temperature Maps Pressure Maps
Maps and Remote Sensing AOSC 200 Tim Canty
 Maps and Remote Sensing AOSC 200 Tim Canty Class Web Site: http://www.atmos.umd.edu/~tcanty/aosc200 Topics for today: Weather Maps Radar Satellite Observations Lecture 04 Feb 7 2019 1 Today s Weather Map
Remote Sensing Observations AOSC 200 Tim Canty
 Remote Sensing Observations AOSC 200 Tim Canty Class Web Site: http://www.atmos.umd.edu/~tcanty/aosc200 Topics for today: Maps Radar Satellite Observations Lecture 04 Feb 7 2019 1 Today s Weather Map http://www.wpc.ncep.noaa.gov/sfc/namussfcwbg.gif
Temperature, Observations, and Maps AOSC 200 Tim Canty. Weather and Climate
 Temperature, Observations, and Maps AOSC 200 Tim Canty Class Web Site: http://www.atmos.umd.edu/~tcanty/aosc200 Topics for today: Climate Weather Observations Weather Maps Lecture 03 Feb 5 2019 1 Weather
The Water Cycle. Water in the Atmosphere AOSC 200 Tim Canty. Class Web Site:
 Water in the Atmosphere AOSC 200 Tim Canty Class Web Site: http://www.atmos.umd.edu/~tcanty/aosc200 Topics for today: Latent Heat Evaporation & Saturation Relative Humidity Dew Point Lecture 11 Oct 2 2018
Module 11: Meteorology Topic 5 Content: Weather Maps Notes
 Introduction A variety of weather maps are produced by the National Weather Service and National Oceanographic Atmospheric Administration. These maps are used to help meteorologists accurately predict
ESCI 1010 Lab 6 Midlatitude Cyclones and Thunderstorms
 ESCI 1010 Lab 6 Midlatitude Cyclones and Thunderstorms Before Lab: Review pages 244-324 in your Weather and Climate textbook. Pay special attention to the sections entitled Fronts, Life Cyclone of a Midlatitude
Tropical Cyclones: When Nature Attacks!! AOSC 200 Tim Canty. Tropical Cyclone: African Easterly Jet
 Tropical Cyclones: When Nature Attacks!! AOSC 200 Tim Canty Class Web Site: http://www.atmos.umd.edu/~tcanty/aosc200 Topics for today: Really powerful low pressure systems Lecture 25 Nov 27 2018 1 Tropical
Lab 19.2 Synoptic Weather Maps
 Lab 19.2 Synoptic Weather Maps Name: Partner: Purpose The purpose of this lab is to have you read and interpret the information displayed on synoptic weather maps. You will also learn the techniques used
Chapter 1 Anatomy of a Cyclone
 Chapter 1 Anatomy of a Cyclone The Beast in the East 15-17 February 2003 Extra-tropical cyclone an area of low pressure outside of the tropics Other names for extra-tropical cyclones: Cyclone Mid-latitude
Precipitation AOSC 200 Tim Canty. Cloud Development: Orographic Lifting
 Precipitation AOSC 200 Tim Canty Class Web Site: http://www.atmos.umd.edu/~tcanty/aosc200 Topics for today: Precipitation formation Rain Ice Lecture 14 Oct 11 2018 1 Cloud Development: Orographic Lifting
PRACTICAL ACTIVITY: DRAWING ISOLINES OR CONTOURS
 COME RAIN OR SHINE PRACTICAL ACTIVITY: DRAWING ISOLINES OR CONTOURS Ideally you would need a pencil for this activity (rather than a pen) and coloured pencils are useful too. These activities maybe a little
Synoptic Meteorology II: Frontogenesis Examples Figure 1
 Synoptic Meteorology II: Frontogenesis Examples The below images, taken from the 1200 UTC 17 January 2019 GFS forecast run, provide examples of the contributions of deformation and divergence to frontogenesis.
AOSC 200 Tim Canty. Class Web Site: Topics for today: Air Masses. Fronts. Lecture 19 Apr
 Air Masses AOSC 200 Tim Canty Class Web Site: http://www.atmos.umd.edu/~tcanty/aosc200 Topics for today: Air Masses Fronts Lecture 19 Apr 11 2019 1 Today s Weather Map http://www.wpc.ncep.noaa.gov/#page=sfc
Precipitation and Wind AOSC 200 Tim Canty. Current Weather
 Precipitation and Wind AOSC 200 Tim Canty Class Web Site: http://www.atmos.umd.edu/~tcanty/aosc200 Topics for today: Precipitation cont. RADAR Pressure Coriolis force Lecture 12 Oct 5 2017 1 Current Weather
Earth Science. Lab 21: Weather Patterns
 Name: Lab 21: Weather Patterns Earth Science Date: Introduction: A basic principle in Earth Science is that energy is constantly bringing about changes. In order to understand the changing Earth, we must
Quick Review: Pressure
 Quick Review: Pressure The pressure force is the force exerted by an air mass on its surroundings (and vice-versa) In the atmosphere, the surroundings are usually other air masses three air masses, each
ESCI 1010 Lab 1 Introduction to Weather Data
 ESCI 1010 Lab 1 Introduction to Weather Data Before Lab: Review pages 1-51 in your Weather and Climate textbook. Pay special attention to the sections entitled Location and Time on Earth and Some Weather
WEATHER PATTERNS NAME DATE. VOCABULARY: Synoptic weather map- Isotherm- Barometric Pressure- Isobar- Convergence- Divergence- Cyclone- Anticyclone-
 NAME DATE VOCABULARY: Synoptic weather map- WEATHER PATTERNS Isotherm- Barometric Pressure- Isobar- Convergence- Divergence- Cyclone- Anticyclone- Air mass- Source region- Front- OBJECTIVE: Construct a
Synoptic Meteorology II: Petterssen-Sutcliffe Development Theory Application March 2015
 Synoptic Meteorology II: Petterssen-Sutcliffe Development Theory Application 10-12 March 2015 In our lecture on Petterssen-Sutcliffe Development Theory, we outlined the principle of selfdevelopment in
Energy and the Earth AOSC 200 Tim Canty
 Energy and the Earth AOSC 200 Tim Canty Class Web Site: http://www.atmos.umd.edu/~tcanty/aosc200 Topics for today: Energy absorption Radiative Equilibirum Lecture 08 Feb 21 2019 1 Today s Weather Map http://www.wpc.ncep.noaa.gov/sfc/namussfcwbg.gif
Forecasting AOSC 200 Tim Canty. Class Web Site: Lecture 26 Nov 29, Weather Forecasting
 Forecasting AOSC 200 Tim Canty Class Web Site: http://www.atmos.umd.edu/~tcanty/aosc200 Topics for today: Forecasting Lecture 26 Nov 29, 2018 1 Weather Forecasting People have been trying to predict the
MET 3502 Synoptic Meteorology. Lecture 5: Surface Weather Elements
 MET 3502 Synoptic Meteorology Lecture 5: Surface Weather Elements Surface Weather Elements Not observations of the surface, but Observations made by an observer (or instrument) at the surface Example:
Global Winds AOSC 200 Tim Canty
 Global Winds AOSC 200 Tim Canty Class Web Site: http://www.atmos.umd.edu/~tcanty/aosc200 Topics for today: Air Masses Fronts Lecture 18 Oct 31 2017 1 Air Masses What is an air mass? Large body of air whose
Three-dimensional Structure in Midlatitude Cyclones. ATMS 370 Due Friday, March 9, 2018
 Three-dimensional Structure in Midlatitude Cyclones ATMS 370 Due Friday, March 9, 2018 In this lab, we exam a cross-section for a case that occurred in January 1996 and use backwards calculated trajectories
Metr 201 Quiz #2 100 pts. A. Short Answer and Definitions. (4 points each for a total of 28 points in this section).
.") Department of Earth & Climate Sciences Name San Francisco State University February 23, 2015 Metr 201 Quiz #2 100 pts. A. Short Answer and Definitions. (4 points each for a total of 28 points in this section).
Department of Earth & Climate Sciences Name San Francisco State University February 23, 2015 Metr 201 Quiz #2 100 pts. A. Short Answer and Definitions. (4 points each for a total of 28 points in this section).
Cyclones and Anticyclones, Ridges and Troughs
 Cyclones and Anticyclones, Ridges and Troughs Isobars on surface maps often have a closed appearance (as illustrated) Areas of low pressure are called cyclones, while areas with high pressure are called
Mesoscale Meteorology Assignment #3 Q-G Theory Exercise. Due 23 February 2017
 Mesoscale Meteorology Assignment #3 Q-G Theory Exercise 1. Consider the sounding given in Fig. 1 below. Due 23 February 2017 Figure 1. Skew T-ln p diagram from Tallahassee, FL (TLH). The observed temperature
XC Meteorology. And other bullshit
 XC Meteorology And other bullshit (c) Jim White 2014 Why do Met? Choose whether to turn up Choose best task for day Choose glider configuration Choose pilot configuration! Avoid being in wrong place Achieve
Temperature AOSC 200 Tim Canty
 Temperature AOSC 200 Tim Canty Class Web Site: http://www.atmos.umd.edu/~tcanty/aosc200 Topics for today: Daily Temperatures Role of clouds, latitude, land/water Lecture 09 Feb 26 2019 1 Today s Weather
Chapter 12 Fronts & Air Masses
 Chapter overview: Anticyclones or highs Air Masses o Classification o Source regions o Air masses of North America Fronts o Stationary fronts o Cold fronts o Warm fronts o Fronts and the jet stream o Frontogenesis
GEO165 LAB EXERCISE #3
 GEO165 LAB EXERCISE #3 Tools of the Meteorologist Part 2: Fronts Introduction 1. A front is the leading edge of a new air mass invading a region. Because Vilhelm Bjerknes was reminded of the bloody battle
Analyzing/Forecasting Weather
 Analyzing/Forecasting Weather Focus Question Dude Its wind. It blows everywhere. Meteorologist to Nicholas Cage in The Weatherman VA SOL SOL 3 The student will investigate and understand how to read and
Meteorology Final Exam Study Guide Part 2
 Name: Teacher Science 8. Date: Water in the Air 1. Define the following terms: Meteorology Final Exam Study Guide Part 2 Evaporation Condensation Relative Humidity Dew Point Humidity Saturation Condensation
2. What are the four most common gasses in the atmosphere and their percentages?
 Meteorology Review Directions: Answer the following open ended review questions. Utilize a diagram where appropriate and do make sure that you label and describe the drawing. Atmospheric Composition 1.
Chapter 12: Meteorology
 Chapter 12: Meteorology Section 1: The Causes of Weather 1. Compare and contrast weather and climate. 2. Analyze how imbalances in the heating of Earth s surface create weather. 3. Describe how and where
Pressure Conversion in Millibars
 Name Date The Weather Map Biggie Lab: Make it Colorful and Purty! Now that you have learned about all of the different variables that contribute to daily changes in weather, it is now time to bring it
In this chapter, we will examine
 In this chapter, we will examine Surface and upper level pressure charts The forces that influence the winds The equations that govern atmospheric motion Simple balanced flows Geostrophic wind (quantitative)
Lightning AOSC 200 Tim Canty. Multicell Thunderstorms
 Lightning AOSC 200 Tim Canty Class Web Site: http://www.atmos.umd.edu/~tcanty/aosc200 Topics for today: Thunderstorms Lightning Initiation Lightning Detection Upward lightning Lecture 22 Nov 14, 2017 1
5. Which type of front is represented by letter X?
 Name Weather Regents Review ased your answers to questions 1 through 4 on the four weather station models,,,, and D, below. D 82 012 56 999 78 978 32 002 62 75 24 1. List the letters of the four station
Department of Geosciences San Francisco State University Spring Metr 201 Monteverdi Quiz #5 Key (100 points)
") Department of Geosciences Name San Francisco State University Spring 2012 Metr 201 Monteverdi Quiz #5 Key (100 points) 1. Fill in the Blank or short definition. (3 points each for a total of 15 points)
Department of Geosciences Name San Francisco State University Spring 2012 Metr 201 Monteverdi Quiz #5 Key (100 points) 1. Fill in the Blank or short definition. (3 points each for a total of 15 points)
Department of Earth & Climate Sciences San Francisco State University
 Department of Earth & Climate Sciences San Francisco State University Name ERTH 260: Inclass Exercise #5 Working With Weather Maps and Soundings: Finding Pressure Features and Fronts Due Wednesday 28 February
Dr. Christopher M. Godfrey University of North Carolina at Asheville
 Surface and Upper-Air Observations Surface Observations Collect information for synoptic-scale weather Most surface observations are automated (e.g., Automated Surface Observing System) Also mesoscale
Meteorology Unit Study Guide
 Name: Key Pd. Date: 1. Define meteorology Meteorology Unit Study Guide Study of the atmosphere including weather and weather patterns 2. The most abundant gas in the atmosphere by volume is. This gas comprises
Quick Review: Pressure
 Quick Review: Pressure The pressure force is the force exerted by an air mass on its surroundings (and vice-versa) In the atmosphere, the surroundings are usually other air masses three air masses, each
Meteorology Lab Activity: Interpreting Surface Observation Symbols
 Meteorology Lab Activity: Interpreting Surface Observation Symbols Introduction: Routine surface meteorological observations are represented on weather maps by a standard notation of symbols and numbers.
Mesoscale Atmospheric Systems. Surface fronts and frontogenesis. 06 March 2018 Heini Wernli. 06 March 2018 H. Wernli 1
 Mesoscale Atmospheric Systems Surface fronts and frontogenesis 06 March 2018 Heini Wernli 06 March 2018 H. Wernli 1 Temperature (degc) Frontal passage in Mainz on 26 March 2010 06 March 2018 H. Wernli
Module 9 Weather Systems
 Module 9 Weather Systems In this module the theory of atmospheric dynamics is applied to different weather phenomena. The first section deals with extratropical cyclones, low and high pressure areas of
Name: Date: Period: MATCHING: Select the letter of the word in Column B that best matches the phrases in Column A.
 Name: Date: Period: MATCHING: Select the letter of the word in Column B that best matches the phrases in Column A. COLUMN A 1. a unit of atmospheric pressure 2. a line joining points of equal air pressure
Weather Practice Test
 Name: Weather Practice Test 1. The diagram below shows weather instruments A and B. Which table correctly indicates the name of the weather instrument and the weather variable that it measures? A) B) C)
Quasi-Geostrophic ω-equation. 1. The atmosphere is approximately hydrostatic. 2. The atmosphere is approximately geostrophic.
 Quasi-Geostrophic ω-equation For large-scale flow in the atmosphere, we have learned about two very important characteristics:. The atmosphere is approximately hydrostatic.. The atmosphere is approximately
Synoptic Meteorology I: Lab 1 Discussion. 25 September From page 14 of Meteorological Data and an Introduction to Synoptic Analysis,
 Synoptic Meteorology I: Lab 1 Discussion 25 September 2014 Overview On the following pages, isoplethed analyses of sea-level pressure (every 4 hpa; Figure 1), 2-m temperature (every 5 F; Figure 2), 2-m
Key. Name: OBJECTIVES
 Name: Key OBJECTIVES Correctly define: air mass, air pressure, anemometer, barometer, cyclone, dew point, front, isobar, isotherm, meteorology, precipitation, psychrometer, relative humidity, saturated,
February 2011: A Month of Below Average Temperatures, A Record Cold Snap, and a Sharp Frontal Passage with Snow
 1 Steven Mullen February 2011: A Month of Below Average Temperatures, A Record Cold Snap, and a Sharp Frontal Passage with Snow Overview of the Weather and Detail Diagnosis for Feb 25 th -27 th Daily surface
Mid-Latitude Cyclones and Fronts. Lecture 12 AOS 101
 Mid-Latitude Cyclones and Fronts Lecture 12 AOS 101 Homework 4 COLDEST TEMPS GEOSTROPHIC BALANCE Homework 4 FASTEST WINDS L Consider an air parcel rising through the atmosphere The parcel expands as it
DOWNLOAD PDF READING CLIMATE MAPS
 Chapter 1 : Template:Climate chart/how to read a climate chart - Wikipedia Maps don't just tell you which way to go they can tell you practically everything about an area of land, even the weather. Learn
Chapter 5: Weather. Only Section 1: What is Weather?
 Chapter 5: Weather Only Section 1: What is Weather? Find the definitions of: Meteorology, meteorologist, weather, climate Not in book? Use the dictionaries **Meteorology - Meteorology is the study of the
Summary of High Wind Event of 7 March 2004
 Summary of High Wind Event of 7 March 2004 This event was characterized by a very strong jet streak that developed over North Carolina by 00 UTC 8 March, as seen in the Eta model analysis at 300 mb, with
SPI Analyze data to identify events associated with heat convection in the atmosphere. SPI Recognize the connection between the
 SPI 0607.8.1 - Analyze data to identify events associated with heat convection in the atmosphere. SPI 0607.8.2 - Recognize the connection between the sun s energy and the wind. o Energy from the Sun creates
Meteorology Lecture 15
 Meteorology Lecture 15 Robert Fovell rfovell@albany.edu 1 Important notes These slides show some figures and videos prepared by Robert G. Fovell (RGF) for his Meteorology course, published by The Great
Learning scale: Identify weather systems based on data including temperature, pressure and moisture. the formation of weather.
 Learning goal: How the of through the Earth s atmosphere, the Earth s, absorption and radiation of create patterns and Learning goal: How the of through the Earth s atmosphere, the Earth s, absorption
ATS 351, Spring 2010 Lab #11 Severe Weather 54 points
 ATS 351, Spring 2010 Lab #11 Severe Weather 54 points Question 1 (10 points): Thunderstorm development a) Sketch and describe the stages of development of a single cell thunderstorm. About how long does
7 - DE Website Document Weather Meteorology
 Date: Subject: 7 - DE Website Document Weather Meteorology Name: Section: E.ES.07.71 - Compare and contrast the difference and relationship between climate and weather. E.ES.07.74 - Describe weather conditions
Counselor s Name: Counselor s Ph #: 1) Define meteorology. Explain how the weather affects farmers, sailors, aviators,
 Define meteorology. Explain how the weather affects farmers, sailors, aviators,") Weather Merit Badge Workbook This workbook is not required but is designed to help you with this merit badge. No one can add or subtract from the Boy Scout Requirements #33215. Use page backs & add pages
Weather Merit Badge Workbook This workbook is not required but is designed to help you with this merit badge. No one can add or subtract from the Boy Scout Requirements #33215. Use page backs & add pages
PLOTTING WEATHER DATA to perform a SURFACE ANALYSIS
 PLOTTING WEATHER DATA to perform a SURFACE ANALYSIS The surface analysis permits one to identify and locate the large scale features of the sea level pressure field and the surface fronts. Isobars with
Answers to Clicker Questions
 Answers to Clicker Questions Chapter 1 What component of the atmosphere is most important to weather? A. Nitrogen B. Oxygen C. Carbon dioxide D. Ozone E. Water What location would have the lowest surface
Dynamical Meteorology 1
 Dynamical Meteorology 1 Lecture 5 Sahraei Physics Department, Razi University http://www.razi.ac.ir/sahraei Structure of the Static Atmosphere جو ایستا: در صورتی که در جو هیچگونه ناپایداری وجود نداشته
Science Olympiad Meteorology Quiz #1 Page 1 of 7
 1) What is generally true about the stratosphere: a) Has turbulent updrafts and downdrafts. b) Has either a stable or increasing temperature profile with altitude. c) Where the auroras occur. d) Both a)
Synoptic Meteorology I: Isoplething Example. From page 15 of Meteorological Data and an Introduction to Synoptic Analysis,
 Synoptic Meteorology I: Isoplething Example Overview On the following pages, isoplethed analyses of sea-level pressure (every 4 hpa; Figure 1), 2-m temperature (every 5 F; Figure 2), 2-m dew point temperature
NATS 101. Lecture 15 Surface and Upper-Air Maps
 NATS 101 Lecture 15 Surface and Upper-Air Maps Due Today Turn in 4 by 6 card, include Comments on Lecture PIN (Optional) Signature (Mandatory and Legible) Supplemental References for Today s s Lecture
Fronts in November 1998 Storm
 Fronts in November 1998 Storm Much of the significant weather observed in association with extratropical storms tends to be concentrated within narrow bands called frontal zones. Fronts in November 1998
Weather & Atmospheric Variables Review
 Weather & Atmospheric Variables Review Words that are bold, italicized and/or underlined are vocabulary you must KNOW! A) Atmospheric variables: a) Temperature as it relates to: 1) duration of insolation...longer
YOU MUST USE WHAT YOU KNOW ABOUT THE MOVEMENT OF AIR MASSES DUE TO THE CORIOLIS EFFECT TO FORECAST!
 For this project you will apply past and present data to predict and future weather patterns and events and justify the predictions in terms of energy transfer between various systems. You will use this
Final Examination. Part A Answer ONLY TWELVE QUESTIONS in Part A. (Each question is 3 points)
") ATS 210 Spring Term 2001 NAME: Final Examination This is a 2 hour, closed-book examination. Calculators may be used. All answers should be written on the examination paper. Use the final sheet for any
ATS 210 Spring Term 2001 NAME: Final Examination This is a 2 hour, closed-book examination. Calculators may be used. All answers should be written on the examination paper. Use the final sheet for any
DEPARTMENT OF GEOSCIENCES SAN FRANCISCO STATE UNIVERSITY. Metr Fall 2012 Test #1 200 pts. Part I. Surface Chart Interpretation.
 DEPARTMENT OF GEOSCIENCES SAN FRANCISCO STATE UNIVERSITY NAME Metr 356.01 Fall 2012 Test #1 200 pts Part I. Surface Chart Interpretation. Figure 1. Surface Chart for 1500Z 7 September 2007 1 1. Pressure
FORMATION OF AIR MASSES
 Chapter 24: Weather (air mass, fronts, Weather instruments, and forecasting the weather) Name: Period: Due Date: Air Mass Use the terms from the following list to complete the sentences below. Each term
Polar Front Theory. Cyclogenesis. Day 1. Days 2-5. What Happens Aloft. Up Above
 Cyclogenesis Tor Bergeron lecturing Mid latitude cyclones are born on the Polar Front as a developing wave Theory of cyclogenesis (formation of cyclones) first developed by the Norwegian meteorologists
Atmospheric Pressure and Wind Frode Stordal, University of Oslo
 Chapter 4 Lecture Understanding Weather and Climate Seventh Edition Atmospheric Pressure and Wind Frode Stordal, University of Oslo Redina L. Herman Western Illinois University The Concept of Pressure
Weather and Energy Review
 Weather and Energy Review Name 1. Base your answer to the following question on the diagram below, which represents the greenhouse effect in which heat energy is trapped in Earth's atmosphere Which type
The lesson essential questions that will guide our investigations are:
 Properties of the Atmosphere: Understanding Patterns Through Observation and Data Collection that Lead to Prediction of Local and Global Weather and Climate. Up until this point in class you have learned
Plot manual. Synop of a landstation The basic form of the SYNOP bulletin for a landstation is: Plotmanual 1
 Plotmanual 1 Plot manual Introduction Meteorological bulletins are distributed worldwide and must be readable by persons have all nationalities and backgrounds. That is one of the reasons these bulletins
Unit: Weather Study Guide
 Name: Period: Unit: Weather Study Guide Define each vocabulary word on a separate piece of paper or index card. Weather Climate Temperature Wind chill Heat index Sky conditions UV index Visibility Wind
Topic 1: Scientific Method Observation vs. Inference 1. Write 2 observations about this cartoon.
 Name: Section: Earth Science Review Topic 1: Scientific Method Observation vs. Inference 1. Write 2 observations about this cartoon. Observation 1: Observation 2: 2. Write 2 inferences about this cartoon.
Weather Part I- Weather Variables
 Weather Part I- Weather Variables 3-1-19 Definitions Meteorology- is the study of the atmosphere- including weather. Weather-the daily conditions of the atmosphere. It can change from time to time and
The Mid Latitude Low trends Check the clouds: Check the barometer: Check the wind: Check the temperature:
 The Mid Latitude Low Mid Latitude lows tend to develop along stationary fronts. In particular, they tend to develop along a boundary between a cold, polar air mass and a warm, tropical air mass. As they
AOSC201: Weather and Climate Lab
 AOSC201: Weather and Climate Lab Week 8: Forecasting - Analysis Section 107/108 Instructor: Agniv Sengupta q Lab #7 of Lab Manual (pages 41-49) q 50 points in total q INDIVIDUAL Work for the entire lab
Occlusion Cyclogenesis
 Occlusion Cyclogenesis Part I: Occlusion cloud bands in comparison to CF and WFs Concepts for cyclogenesis Different types of cyclogenesis and examples Numerical parameters on isobaric and isentropic surfaces
WEATHER MAPS NAME. Temperature: Dew Point: Wind Direction: Wind Velocity: % of Sky Covered: Current Pressure:
 NAME WEATHER MAPS For decades hundreds of weather stations throughout the United States have been making standard observations of temperature, moisture, air pressure and winds. The data are collected centrally
The atmosphere in motion: forces and wind. AT350 Ahrens Chapter 9
 The atmosphere in motion: forces and wind AT350 Ahrens Chapter 9 Recall that Pressure is force per unit area Air pressure is determined by the weight of air above A change in pressure over some distance
Quiz 2 Review Questions
 Quiz 2 Review Questions Chapter 7 Lectures: Winds and Global Winds and Global Winds cont 1) What is the thermal circulation (thermal wind) and how does it form? When we have this type of circulation, how
4 Forecasting Weather
 CHAPTER 16 4 Forecasting Weather SECTION Understanding Weather BEFORE YOU READ After you read this section, you should be able to answer these questions: What instruments are used to forecast weather?
Chapter Introduction. Weather. Patterns. Forecasts Chapter Wrap-Up
 Chapter Introduction Lesson 1 Lesson 2 Lesson 3 Describing Weather Weather Patterns Weather Forecasts Chapter Wrap-Up How do scientists describe and predict weather? What do you think? Before you begin,
The Atmosphere in the Vertical ACTIVITY. Introduction. Materials. Investigations
 ACTIVITY Activity The Atmosphere in the Vertical After completing this activity, you should be able to: Describe the vertical structure of the atmosphere in the troposphere (the "weather" layer) and in
MASTERY ASSIGNMENT 2015
 Climate & Meteorology MASTERY ASSIGNMENT 2015 Directions: You must submit this document via Google Docs to lzimmerman@wcpss.net. The document must include the questions and pictures must be hand drawn
Weather - is the state of the atmosphere at a specific time & place
 Weather Section 1 Weather - is the state of the atmosphere at a specific time & place Includes such conditions as air pressure, wind, temperature, and moisture in the air The Sun s heat evaporates water
Guided Notes Weather. Part 1: Weather Factors Temperature Humidity Air Pressure Winds Station Models
 Guided Notes Weather Part 1: Weather Factors Temperature Humidity Air Pressure Winds Station Models. 1. What is weather? Weather: short-term atmospheric conditions in a specific area at a specific time
" max. T = 2.898#10 $3 metres Kelvin
 Question 1 The Earth s climate and weather is driven by energy coming from the Sun. The temperature of the Earth is determined by a balance between incoming radiation from the Sun and that radiated back
Forecast Models. General Meteorology Laboratory #11
 General Meteorology Laboratory #11 Name Partners Forecast Models Date _ Section Purpose: Develop the ability to contour two dimensional data and use the resulting information to locate a cold front. Equipment:
3. As warm, moist air moves into a region, barometric pressure readings in the region will generally 1. decrease 2. increase 3.
 Teacher: Mr. Prizzi Castle Learning Review 1 1. Which process most directly results in cloud formation? 1. condensation 3. precipitation 2. transpiration 4. radiation 2. An air mass originating over north
NATS 101 Section 13: Lecture 3. Weather vs. Climate
 NATS 101 Section 13: Lecture 3 Weather vs. Climate Definition of Weather Weather: Condition of the atmosphere at a particular time and place. Comprised of: Air temperature: Degree of hotness or coldness