Fun with Weather Maps! (no, really stop laughing) AOSC 200 Tim Canty
|
|
|
- Gary Cook
- 5 years ago
- Views:
Transcription

1 Fun with Weather Maps! (no, really stop laughing) AOSC 200 Tim Canty Class Web Site: Topics for today: Observations Station Model Temperature Maps Pressure Maps Fronts Lecture 03 Feb Today s Weather Map 2

2 Today s Forecast 3 Tomorrow s Forecast 4


3 Thursday s Forecast 5 Rain: rain gauge Measures total rainfall over a time period but it has to be emptied periodically Fig 1-17 Weather: A Concise Introduction Rainfall less than 1mm is reported as a trace amount 6

")
4 Rain: tipping bucket rain gauge After the bucket fills and tips, a small signal is sent and recorded 7 Meteorological Observations Automated Surface Observing System (ASOS) ASOS ASOS 8

5 Meteorological Observations Automated Surface Observing System (ASOS) Measures: cloud height visibility precipitation pressure temperature dew point wind direction wind speed rainfall amount 9 Meteorological Observations: College Park 10

6 Meteorological Observations: Meteogram 11 Radiosondes Weather doesn t just happen at the surface!!! 12

7 Radiosondes Position of balloon Temperature Dew Pt Dew Point Hygrometer When temperature is above the dew point, observed light is unchanged Fig 5-3a Meteorology: Understanding the Atmosphere 14
8 Humidity: Dew Point Hygrometer When temperature reaches dew point, water condenses on surface and observed light is scattered Fig 5-3b Meteorology: Understanding the Atmosphere 15 Weather Station Model The weather station model tells you what the conditions are like at the surface Fig Weather: A Concise Introduction 16
9 Weather Station Model The central circle indicates cloud cover Fig Weather: A Concise Introduction 17 Weather Station Model The symbol located between the air temperature and dew point temperature indicates significant weather Fig Weather: A Concise Introduction 18
10 Weather Station Model The line indicates the direction the wind is coming from (in this case from the Northeast) and the barbs and pennants indicate wind speed Fig Weather: A Concise Introduction 19 Weather Station Model The line indicates the direction the wind is coming from (in this case from the Northeast) and the barbs and pennants indicate wind speed Fig Weather: A Concise Introduction 20
11 Weather Station Model Sometimes weather maps use a shorthand to represent pressure. Fig Weather: A Concise Introduction 21 Weather Station Model If reported value greater than 500: Initial 9 is missing. Place it on left, then divide by 10. For example: 827 becomes mb. Fig Weather: A Concise Introduction 22


 the surface")
12 Weather Station Model If reported value less than 500: Initial 10 is missing. Place it on left, then divide by 10. For example: 027 becomes mb. Fig Weather: A Concise Introduction 23 Temperature Maps Temperature maps are often colored based on how warm (red) or cold (blue) the surface temperatures are Fig 2-2 Weather: A Concise Introduction 24
13 Temperature Maps The black lines indicate isotherms or lines of constant temperature. These maps help us identify the air masses that are controlling surface conditions and the temperature frontal boundaries between them Fig 2-2 Weather: A Concise Introduction 25 Temperature Fronts A cold front is a region where cold air is replacing warm air. It s indicated by a blue line with blue triangles pointing in the direction the air mass is moving. Fig 2-3 Weather: A Concise Introduction 26
14 Temperature Fronts A warm front is a region where warm air is replacing cold air. It s indicated by a red line with red half circles pointing in the direction the air mass is moving. Fig 2-3 Weather: A Concise Introduction 27 Temperature Fronts Recognize the fronts by the symbols!!! You might have a black and white map (like on a test.hint hint!!) and can t rely on the colors to tell you which type of front you re looking at. Fig 2-3 Weather: A Concise Introduction 28
15 Pressure Maps The black lines indicate isobars or lines of constant pressure. These maps help us identify regions of high pressure ( H ) and low pressure ( L ). They also give some indication of surface wind speed and direction. The numbers are the actual pressure (no conversion needed) Fig 2-4 Weather: A Concise Introduction 29 Pressure Maps Generally, isobars are plotted at 4 hpa intervals If it helps, consider this like a map of surface height and you ll get an idea of where are is flowing too and how fast it s moving. Fig 2-4 Weather: A Concise Introduction 30
16 Pressure Maps Closed contours define regions of high pressure and low pressure. Fig 2-5 Weather: A Concise Introduction 31 Pressure Maps Isobars that aren t closed can still help us define regions of increasing ( ridges ) and decreasing ( troughs ) pressure. Fig 2-6 Weather: A Concise Introduction 32
17 Temperature Maps We can combine the different ways of looking at surface data to create what you may recognize as a modern weather map Fig 2-2 Weather: A Concise Introduction 33 Weather Maps We can combine the different ways of looking at surface data to create what you may recognize as a modern weather map Fig 2-2 Weather: A Concise Introduction 34
18 Upper Level Maps We can look at pressure maps at a some particular altitude but the mathematics becomes very complicated Instead, we look at altitude of a specific pressure level. The figures to the right show the height (in meters) of the 850 hpa surface. Fig 2-8 Weather: A Concise Introduction 35 Upper Level Maps The station model provides slightly different information than at the surface. The height of the pressure surface is in the position where pressure used to be. Maps of this information are called isobaric maps Fig 2-9 Weather: A Concise Introduction 36
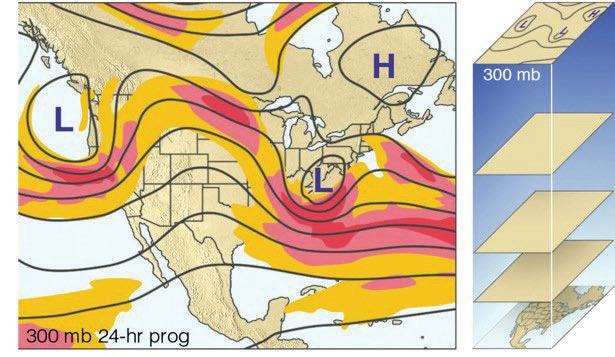
. Notice that the fastest winds in the central US are almost above the position of the surface low pressure.")
19 Weather Maps: Surface We can combine the different ways of looking at surface data to create what you may recognize as a modern weather map Fig 2-2 Weather: A Concise Introduction 37 Weather Maps: 500 mb The color contours represent wind speed (in knots). Notice that the fastest winds in the central US are almost above the position of the surface low pressure. Here the black lines are in decameters. Fig 2-10 Weather: A Concise Introduction 38
20 Weather Maps: 500 mb The height of the layer can indicate surface temperatures. Why? Fig 2-10 Weather: A Concise Introduction 39 Weather Maps: 500 mb Sometimes this information is plotted as the hpa thickness Fig 2-10 Weather: A Concise Introduction 40

21 Mean Sea Level Pressure Pressure and altitude are connected: pressure decreases with height The air pressure at the top of a mountain is lower than at the beach. If you didn t account for this then your forecasts would assumer there s always a low pressure system over the mountains. You need to correct for this by determining what the pressure on the top of the mountain would be if you brought it to sea level (~10mbar for every 100m) Fig Weather: A Concise Introduction 41 Prognostic Charts Fig 9.5: Essentials of Meteorology 42


22 Prognostic Charts Fig 9.5: Essentials of Meteorology 43 Prognostic Charts Fig 9.5: Essentials of Meteorology 44


23 Prognostic Charts Fig 9.5: Essentials of Meteorology 45
Weather Station Model
 Fun with Weather Maps! (no, really stop laughing) AOSC 200 Tim Canty Class Web Site: http://www.atmos.umd.edu/~tcanty/aosc200 Topics for today: Station Model Temperature Maps Pressure Maps Fronts Lecture
Maps and Remote Sensing AOSC 200 Tim Canty
 Maps and Remote Sensing AOSC 200 Tim Canty Class Web Site: http://www.atmos.umd.edu/~tcanty/aosc200 Topics for today: Weather Maps Radar Satellite Observations Lecture 04 Feb 7 2019 1 Today s Weather Map
Temperature, Observations, and Maps AOSC 200 Tim Canty. Weather and Climate
 Temperature, Observations, and Maps AOSC 200 Tim Canty Class Web Site: http://www.atmos.umd.edu/~tcanty/aosc200 Topics for today: Climate Weather Observations Weather Maps Lecture 03 Feb 5 2019 1 Weather
Remote Sensing Observations AOSC 200 Tim Canty
 Remote Sensing Observations AOSC 200 Tim Canty Class Web Site: http://www.atmos.umd.edu/~tcanty/aosc200 Topics for today: Maps Radar Satellite Observations Lecture 04 Feb 7 2019 1 Today s Weather Map http://www.wpc.ncep.noaa.gov/sfc/namussfcwbg.gif
The Water Cycle. Water in the Atmosphere AOSC 200 Tim Canty. Class Web Site:
 Water in the Atmosphere AOSC 200 Tim Canty Class Web Site: http://www.atmos.umd.edu/~tcanty/aosc200 Topics for today: Latent Heat Evaporation & Saturation Relative Humidity Dew Point Lecture 11 Oct 2 2018
ESCI 1010 Lab 6 Midlatitude Cyclones and Thunderstorms
 ESCI 1010 Lab 6 Midlatitude Cyclones and Thunderstorms Before Lab: Review pages 244-324 in your Weather and Climate textbook. Pay special attention to the sections entitled Fronts, Life Cyclone of a Midlatitude
Precipitation AOSC 200 Tim Canty. Cloud Development: Orographic Lifting
 Precipitation AOSC 200 Tim Canty Class Web Site: http://www.atmos.umd.edu/~tcanty/aosc200 Topics for today: Precipitation formation Rain Ice Lecture 14 Oct 11 2018 1 Cloud Development: Orographic Lifting
Module 11: Meteorology Topic 5 Content: Weather Maps Notes
 Introduction A variety of weather maps are produced by the National Weather Service and National Oceanographic Atmospheric Administration. These maps are used to help meteorologists accurately predict
Chapter 1 Anatomy of a Cyclone
 Chapter 1 Anatomy of a Cyclone The Beast in the East 15-17 February 2003 Extra-tropical cyclone an area of low pressure outside of the tropics Other names for extra-tropical cyclones: Cyclone Mid-latitude
Lab 19.2 Synoptic Weather Maps
 Lab 19.2 Synoptic Weather Maps Name: Partner: Purpose The purpose of this lab is to have you read and interpret the information displayed on synoptic weather maps. You will also learn the techniques used
Dr. Christopher M. Godfrey University of North Carolina at Asheville
 Surface and Upper-Air Observations Surface Observations Collect information for synoptic-scale weather Most surface observations are automated (e.g., Automated Surface Observing System) Also mesoscale
Chapter 12: Meteorology
 Chapter 12: Meteorology Section 1: The Causes of Weather 1. Compare and contrast weather and climate. 2. Analyze how imbalances in the heating of Earth s surface create weather. 3. Describe how and where
Energy and the Earth AOSC 200 Tim Canty
 Energy and the Earth AOSC 200 Tim Canty Class Web Site: http://www.atmos.umd.edu/~tcanty/aosc200 Topics for today: Energy absorption Radiative Equilibirum Lecture 08 Feb 21 2019 1 Today s Weather Map http://www.wpc.ncep.noaa.gov/sfc/namussfcwbg.gif
AOSC 200 Tim Canty. Class Web Site: Topics for today: Air Masses. Fronts. Lecture 19 Apr
 Air Masses AOSC 200 Tim Canty Class Web Site: http://www.atmos.umd.edu/~tcanty/aosc200 Topics for today: Air Masses Fronts Lecture 19 Apr 11 2019 1 Today s Weather Map http://www.wpc.ncep.noaa.gov/#page=sfc
Temperature AOSC 200 Tim Canty
 Temperature AOSC 200 Tim Canty Class Web Site: http://www.atmos.umd.edu/~tcanty/aosc200 Topics for today: Daily Temperatures Role of clouds, latitude, land/water Lecture 09 Feb 26 2019 1 Today s Weather
Meteorology Final Exam Study Guide Part 2
 Name: Teacher Science 8. Date: Water in the Air 1. Define the following terms: Meteorology Final Exam Study Guide Part 2 Evaporation Condensation Relative Humidity Dew Point Humidity Saturation Condensation
2. What are the four most common gasses in the atmosphere and their percentages?
 Meteorology Review Directions: Answer the following open ended review questions. Utilize a diagram where appropriate and do make sure that you label and describe the drawing. Atmospheric Composition 1.
Observing Weather: Making the Invisible Visible. Dr. Michael J. Passow
 Observing Weather: Making the Invisible Visible Dr. Michael J. Passow What Is Weather? Weather refers to the conditions of the atmosphere at a certain place and time. Weather differs from Climate, which
Precipitation and Wind AOSC 200 Tim Canty. Current Weather
 Precipitation and Wind AOSC 200 Tim Canty Class Web Site: http://www.atmos.umd.edu/~tcanty/aosc200 Topics for today: Precipitation cont. RADAR Pressure Coriolis force Lecture 12 Oct 5 2017 1 Current Weather
MET 3502 Synoptic Meteorology. Lecture 5: Surface Weather Elements
 MET 3502 Synoptic Meteorology Lecture 5: Surface Weather Elements Surface Weather Elements Not observations of the surface, but Observations made by an observer (or instrument) at the surface Example:
Tropical Cyclones: When Nature Attacks!! AOSC 200 Tim Canty. Tropical Cyclone: African Easterly Jet
 Tropical Cyclones: When Nature Attacks!! AOSC 200 Tim Canty Class Web Site: http://www.atmos.umd.edu/~tcanty/aosc200 Topics for today: Really powerful low pressure systems Lecture 25 Nov 27 2018 1 Tropical
Department of Earth & Climate Sciences San Francisco State University
 Department of Earth & Climate Sciences San Francisco State University Name ERTH 260: Inclass Exercise #5 Working With Weather Maps and Soundings: Finding Pressure Features and Fronts Due Wednesday 28 February
Forecasting AOSC 200 Tim Canty. Class Web Site: Lecture 26 Nov 29, Weather Forecasting
 Forecasting AOSC 200 Tim Canty Class Web Site: http://www.atmos.umd.edu/~tcanty/aosc200 Topics for today: Forecasting Lecture 26 Nov 29, 2018 1 Weather Forecasting People have been trying to predict the
Chapter 5: Weather. Only Section 1: What is Weather?
 Chapter 5: Weather Only Section 1: What is Weather? Find the definitions of: Meteorology, meteorologist, weather, climate Not in book? Use the dictionaries **Meteorology - Meteorology is the study of the
Lecture 5: Precipitation
 Lecture 5: Precipitation Key Questions 1. What physical concepts control the formation of precipitation (air pressure, expanding gases and cooling, and vapor pressure)? 2. What are some air mass lifting
PRACTICAL ACTIVITY: DRAWING ISOLINES OR CONTOURS
 COME RAIN OR SHINE PRACTICAL ACTIVITY: DRAWING ISOLINES OR CONTOURS Ideally you would need a pencil for this activity (rather than a pen) and coloured pencils are useful too. These activities maybe a little
CHAPTER 13 WEATHER ANALYSIS AND FORECASTING MULTIPLE CHOICE QUESTIONS
 CHAPTER 13 WEATHER ANALYSIS AND FORECASTING MULTIPLE CHOICE QUESTIONS 1. The atmosphere is a continuous fluid that envelops the globe, so that weather observation, analysis, and forecasting require international
Answers to Clicker Questions
 Answers to Clicker Questions Chapter 1 What component of the atmosphere is most important to weather? A. Nitrogen B. Oxygen C. Carbon dioxide D. Ozone E. Water What location would have the lowest surface
4 Forecasting Weather
 CHAPTER 16 4 Forecasting Weather SECTION Understanding Weather BEFORE YOU READ After you read this section, you should be able to answer these questions: What instruments are used to forecast weather?
Global Winds AOSC 200 Tim Canty
 Global Winds AOSC 200 Tim Canty Class Web Site: http://www.atmos.umd.edu/~tcanty/aosc200 Topics for today: Air Masses Fronts Lecture 18 Oct 31 2017 1 Air Masses What is an air mass? Large body of air whose
Forecast Models. General Meteorology Laboratory #11
 General Meteorology Laboratory #11 Name Partners Forecast Models Date _ Section Purpose: Develop the ability to contour two dimensional data and use the resulting information to locate a cold front. Equipment:
Unit 5 Lesson 3 How is Weather Predicted? Copyright Houghton Mifflin Harcourt Publishing Company
 Tracking the Weather Warm up 1 Why is it important to watch the weather forecast before traveling to another country? Tracking the Weather A meteorologist is a scientist who studies weather. Meteorologists
DEPARTMENT OF GEOSCIENCES SAN FRANCISCO STATE UNIVERSITY. Metr Fall 2012 Test #1 200 pts. Part I. Surface Chart Interpretation.
 DEPARTMENT OF GEOSCIENCES SAN FRANCISCO STATE UNIVERSITY NAME Metr 356.01 Fall 2012 Test #1 200 pts Part I. Surface Chart Interpretation. Figure 1. Surface Chart for 1500Z 7 September 2007 1 1. Pressure
ESCI 1010 Lab 1 Introduction to Weather Data
 ESCI 1010 Lab 1 Introduction to Weather Data Before Lab: Review pages 1-51 in your Weather and Climate textbook. Pay special attention to the sections entitled Location and Time on Earth and Some Weather
Deliverable 4-2: Assessment items. Activity-oriented Quiz for Weather or Not? Investigation in Exploring the Environment
 Deliverable 4-2: Assessment items Activity-oriented Quiz for Weather or Not? Investigation in Exploring the Environment In Weather or Not? you predicted the weather using satellite images and other kinds
XC Meteorology. And other bullshit
 XC Meteorology And other bullshit (c) Jim White 2014 Why do Met? Choose whether to turn up Choose best task for day Choose glider configuration Choose pilot configuration! Avoid being in wrong place Achieve
Climate & Earth System Science. Introduction to Meteorology & Climate. Chapter 05 SOME OBSERVING INSTRUMENTS. Instrument Enclosure.
 Climate & Earth System Science Introduction to Meteorology & Climate MAPH 10050 Peter Lynch Peter Lynch Meteorology & Climate Centre School of Mathematical Sciences University College Dublin Meteorology
General Meteorology Laboratory #11. Forecast Models
 General Meteorology Laboratory #11 Name Partners Forecast Models Date _ Section Purpose: Develop the ability to contour two dimensional data and use the resulting information to locate a cold front. Equipment:
25.1 Air Masses. Section 25.1 Objectives
 Section 25.1 Objectives Explain how an air mass forms. List the four main types of air masses. Describe how air masses affect the weather of North America. Air Masses 25.1 Air Masses Differences in air
Meteorology B Station 1 AIR MASSES. Examine this weather map. Please share nicely, as two teams will need to use the map.
 Meteorology B Station 1 AIR MASSES Examine this weather map. Please share nicely, as two teams will need to use the map. 1. Which air mass is associated with clear skies on this map? a. continental polar
Science Olympiad Meteorology Quiz #1 Page 1 of 7
 1) What is generally true about the stratosphere: a) Has turbulent updrafts and downdrafts. b) Has either a stable or increasing temperature profile with altitude. c) Where the auroras occur. d) Both a)
7 - DE Website Document Weather Meteorology
 Date: Subject: 7 - DE Website Document Weather Meteorology Name: Section: E.ES.07.71 - Compare and contrast the difference and relationship between climate and weather. E.ES.07.74 - Describe weather conditions
Module 11: Meteorology Topic 3 Content: Weather Instruments Notes
 Introduction In order for meteorologists to accurately predict the weather, they take thousands of different weather measurements each day. Meteorologists need to use many tools in order to draw an accurate
Counselor s Name: Counselor s Ph #: 1) Define meteorology. Explain how the weather affects farmers, sailors, aviators,
 Define meteorology. Explain how the weather affects farmers, sailors, aviators,") Weather Merit Badge Workbook This workbook is not required but is designed to help you with this merit badge. No one can add or subtract from the Boy Scout Requirements #33215. Use page backs & add pages
Weather Merit Badge Workbook This workbook is not required but is designed to help you with this merit badge. No one can add or subtract from the Boy Scout Requirements #33215. Use page backs & add pages
Page 1. Name:
 Name: 1) As the difference between the dewpoint temperature and the air temperature decreases, the probability of precipitation increases remains the same decreases 2) Which statement best explains why
Weather and the Atmosphere. RAP Short Course
 Weather and the Atmosphere RAP Short Course Syllabus 1) Vertical structure and composition of the atmosphere, basic weather variables 2) Warming Earth and its atmosphere the diurnal and seasonal cycles
Earth Science. Lab 21: Weather Patterns
 Name: Lab 21: Weather Patterns Earth Science Date: Introduction: A basic principle in Earth Science is that energy is constantly bringing about changes. In order to understand the changing Earth, we must
NATS 101 Section 13: Lecture 3. Weather vs. Climate
 NATS 101 Section 13: Lecture 3 Weather vs. Climate Definition of Weather Weather: Condition of the atmosphere at a particular time and place. Comprised of: Air temperature: Degree of hotness or coldness
Meteorology Unit Study Guide
 Name: Key Pd. Date: 1. Define meteorology Meteorology Unit Study Guide Study of the atmosphere including weather and weather patterns 2. The most abundant gas in the atmosphere by volume is. This gas comprises
What is the atmosphere? What is the difference between weather and climate? What elements influence climate? Could you explain what the wind is?
 WEATHER AND CLIMATE What is the atmosphere? What is the difference between weather and climate? What elements influence climate? Could you explain what the wind is? What are the Earth s main climate? What
CURRICULUM OUTLINE. DEPARTMENT: Science DATE: January, 2004
 PARAMUS ELEMENTARY SCHOOL PARAMUS, NEW JERSEY CURRICULUM OUTLINE DEPARTMENT: Science DATE: January, 2004 COURSE: The Earth s Atmosphere GRADE LEVEL: Grade 6 I. COURSE DESCRIPTION: The student will explore
Metr 201 Quiz #2 100 pts. A. Short Answer and Definitions. (4 points each for a total of 28 points in this section).
.") Department of Earth & Climate Sciences Name San Francisco State University February 23, 2015 Metr 201 Quiz #2 100 pts. A. Short Answer and Definitions. (4 points each for a total of 28 points in this section).
Department of Earth & Climate Sciences Name San Francisco State University February 23, 2015 Metr 201 Quiz #2 100 pts. A. Short Answer and Definitions. (4 points each for a total of 28 points in this section).
Name: Date: Period: MATCHING: Select the letter of the word in Column B that best matches the phrases in Column A.
 Name: Date: Period: MATCHING: Select the letter of the word in Column B that best matches the phrases in Column A. COLUMN A 1. a unit of atmospheric pressure 2. a line joining points of equal air pressure
Chapter 12 Fronts & Air Masses
 Chapter overview: Anticyclones or highs Air Masses o Classification o Source regions o Air masses of North America Fronts o Stationary fronts o Cold fronts o Warm fronts o Fronts and the jet stream o Frontogenesis
DOWNLOAD PDF READING CLIMATE MAPS
 Chapter 1 : Template:Climate chart/how to read a climate chart - Wikipedia Maps don't just tell you which way to go they can tell you practically everything about an area of land, even the weather. Learn
FORMATION OF AIR MASSES
 Chapter 24: Weather (air mass, fronts, Weather instruments, and forecasting the weather) Name: Period: Due Date: Air Mass Use the terms from the following list to complete the sentences below. Each term
4 Forecasting Weather
 CHAPTER 2 4 Forecasting Weather SECTION Understanding Weather BEFORE YOU READ After you read this section, you should be able to answer these questions: What instruments are used to forecast weather? How
WEATHER PATTERNS NAME DATE. VOCABULARY: Synoptic weather map- Isotherm- Barometric Pressure- Isobar- Convergence- Divergence- Cyclone- Anticyclone-
 NAME DATE VOCABULARY: Synoptic weather map- WEATHER PATTERNS Isotherm- Barometric Pressure- Isobar- Convergence- Divergence- Cyclone- Anticyclone- Air mass- Source region- Front- OBJECTIVE: Construct a
Forecast for 6/28-7/31. Forecaster: Matthew Brewer Forecast made at: 12z 6/27/2017
 Forecast for 6/28-7/31 Forecaster: Matthew Brewer Forecast made at: 12z 6/27/2017 Whiteface lodge Mesonet Meteogram for the past 24 hours http://www.nysmesonet.org/data/meteogram#?stid=wfmb Whiteface Summit
Chapter Introduction. Weather. Patterns. Forecasts Chapter Wrap-Up
 Chapter Introduction Lesson 1 Lesson 2 Lesson 3 Describing Weather Weather Patterns Weather Forecasts Chapter Wrap-Up How do scientists describe and predict weather? What do you think? Before you begin,
Synoptic Meteorology II: Frontogenesis Examples Figure 1
 Synoptic Meteorology II: Frontogenesis Examples The below images, taken from the 1200 UTC 17 January 2019 GFS forecast run, provide examples of the contributions of deformation and divergence to frontogenesis.
Module 9 Weather Systems
 Module 9 Weather Systems In this module the theory of atmospheric dynamics is applied to different weather phenomena. The first section deals with extratropical cyclones, low and high pressure areas of
Earth Science Lesson Plan Quarter 2, Week 4, Day 1
 Earth Science Lesson Plan Quarter 2, Week 4, Day 1 1 Outcomes for Today PREPARE 1. Background knowledge necessary for today s reading. In order to make forecasts, meteorologists must gather accurate weather
Polar Front Theory. Cyclogenesis. Day 1. Days 2-5. What Happens Aloft. Up Above
 Cyclogenesis Tor Bergeron lecturing Mid latitude cyclones are born on the Polar Front as a developing wave Theory of cyclogenesis (formation of cyclones) first developed by the Norwegian meteorologists
STATION If relative humidity is 60% and saturation vapor pressure is 35 mb, what is the actual vapor pressure?
 STATION 1 Vapor pressure is a measure of relative humidity and saturation vapor pressure. Using this information and the information given in the problem, answer the following question. 1. If relative
Weather Practice Test
 Name: Weather Practice Test 1. The diagram below shows weather instruments A and B. Which table correctly indicates the name of the weather instrument and the weather variable that it measures? A) B) C)
Key. Name: OBJECTIVES
 Name: Key OBJECTIVES Correctly define: air mass, air pressure, anemometer, barometer, cyclone, dew point, front, isobar, isotherm, meteorology, precipitation, psychrometer, relative humidity, saturated,
Weather, Air Masses, Fronts and Global Wind Patterns. Meteorology
 Weather, Air Masses, Fronts and Global Wind Patterns Meteorology Weather is what conditions of the atmosphere are over a short period of time. Climate is how the atmosphere "behaves" over long periods
Weather and Climate 1. Elements of the weather
 Weather and Climate 1 affect = to have an effect on, influence, change altitude = the height of a place above the sea axis = the line around which an object rotates certain = special consist of = to be
East Penn School District Curriculum and Instruction
 East Penn School District Curriculum and Instruction Curriculum for: Meteorology Course(s): Meteorology Grades: 10-12 Department: Science Length of Period (average minutes): 42 Periods per cycle: 6 Length
Analyzing/Forecasting Weather
 Analyzing/Forecasting Weather Focus Question Dude Its wind. It blows everywhere. Meteorologist to Nicholas Cage in The Weatherman VA SOL SOL 3 The student will investigate and understand how to read and
Summary of High Wind Event of 7 March 2004
 Summary of High Wind Event of 7 March 2004 This event was characterized by a very strong jet streak that developed over North Carolina by 00 UTC 8 March, as seen in the Eta model analysis at 300 mb, with
Mid-Latitude Cyclones and Fronts. Lecture 12 AOS 101
 Mid-Latitude Cyclones and Fronts Lecture 12 AOS 101 Homework 4 COLDEST TEMPS GEOSTROPHIC BALANCE Homework 4 FASTEST WINDS L Consider an air parcel rising through the atmosphere The parcel expands as it
Weather Maps. Name:& & &&&&&Advisory:& & 1.! A&weather&map&is:& & & & 2.! Weather&fronts&are:& & & & & &
 Name: Advisory: Weather Maps 1. Aweathermapis: 2. Weatherfrontsare: a. Labelthefrontsbelow: 1. 2. 3. 4. 3. Clovercoversymbols 4. Precipitationsymbols 5. 6. 7. 8. 5. RadarEchoIntensityshows 6. Isobarsare
GEO165 LAB EXERCISE #3
 GEO165 LAB EXERCISE #3 Tools of the Meteorologist Part 2: Fronts Introduction 1. A front is the leading edge of a new air mass invading a region. Because Vilhelm Bjerknes was reminded of the bloody battle
Unit: Weather Study Guide
 Name: Period: Unit: Weather Study Guide Define each vocabulary word on a separate piece of paper or index card. Weather Climate Temperature Wind chill Heat index Sky conditions UV index Visibility Wind
Three-dimensional Structure in Midlatitude Cyclones. ATMS 370 Due Friday, March 9, 2018
 Three-dimensional Structure in Midlatitude Cyclones ATMS 370 Due Friday, March 9, 2018 In this lab, we exam a cross-section for a case that occurred in January 1996 and use backwards calculated trajectories
Quick Review: Pressure
 Quick Review: Pressure The pressure force is the force exerted by an air mass on its surroundings (and vice-versa) In the atmosphere, the surroundings are usually other air masses three air masses, each
PREDICTING THE WEATHER
 NAME DATE PARTNER(S) PREDICTING THE WEATHER How well does your local weatherman do in predicting the weather? Is he or she more accurate for the next day or for a week in the future? Why do you think that
3. As warm, moist air moves into a region, barometric pressure readings in the region will generally 1. decrease 2. increase 3.
 Teacher: Mr. Prizzi Castle Learning Review 1 1. Which process most directly results in cloud formation? 1. condensation 3. precipitation 2. transpiration 4. radiation 2. An air mass originating over north
Weather - is the state of the atmosphere at a specific time & place
 Weather Section 1 Weather - is the state of the atmosphere at a specific time & place Includes such conditions as air pressure, wind, temperature, and moisture in the air The Sun s heat evaporates water
Weather vs. Climate. Tucson NWS homepage:
 Weather vs. Climate Tucson NWS homepage: www.nws.noaa.gov/twc/ A Weather Forecaster? Betty claims to know exactly when it s going to rain because her knee starts to hurt. Ms. Betty Martin of Newburgh,
Department of Geosciences San Francisco State University Spring Metr 201 Monteverdi Quiz #5 Key (100 points)
") Department of Geosciences Name San Francisco State University Spring 2012 Metr 201 Monteverdi Quiz #5 Key (100 points) 1. Fill in the Blank or short definition. (3 points each for a total of 15 points)
Department of Geosciences Name San Francisco State University Spring 2012 Metr 201 Monteverdi Quiz #5 Key (100 points) 1. Fill in the Blank or short definition. (3 points each for a total of 15 points)
YOU MUST USE WHAT YOU KNOW ABOUT THE MOVEMENT OF AIR MASSES DUE TO THE CORIOLIS EFFECT TO FORECAST!
 For this project you will apply past and present data to predict and future weather patterns and events and justify the predictions in terms of energy transfer between various systems. You will use this
Clouds. What they tell us about the weather
 Clouds What they tell us about the weather Spring funnel cloud over Willard, Utah 2003 Cloud coverage 581-586 How to show Cloud Coverage On a weather map meteorologists use circles shaded differently to
GEOGRAPHY AND HISTORY
 GEOGRAPHY AND HISTORY YEAR 1, PART 1 www.vicensvives.es Contents 01 Our planet Earth 02 The representation of the Earth: maps 03 The Earth s relief 04 Rivers and seas 05 Weather and climate 06 Climates
Final Examination. Part A Answer ONLY TWELVE QUESTIONS in Part A. (Each question is 3 points)
") ATS 210 Spring Term 2001 NAME: Final Examination This is a 2 hour, closed-book examination. Calculators may be used. All answers should be written on the examination paper. Use the final sheet for any
ATS 210 Spring Term 2001 NAME: Final Examination This is a 2 hour, closed-book examination. Calculators may be used. All answers should be written on the examination paper. Use the final sheet for any
Weather & Atmospheric Variables Review
 Weather & Atmospheric Variables Review Words that are bold, italicized and/or underlined are vocabulary you must KNOW! A) Atmospheric variables: a) Temperature as it relates to: 1) duration of insolation...longer
Precipitation. Prof. M.M.M. Najim
 Precipitation Prof. M.M.M. Najim Learning Outcome At the end of this section students will be able to Explain different forms of precipitation Identify different types of rain gauges Measure rainfall using
NAME: Log onto YouTube and search for jocrisci channel.
 NAME: Log onto YouTube and search for jocrisci channel. REFERENCE TABLES (Videos 8.1 & 8.2 ESRT 12, 13a, 14b) 1. Use the temperature scales on page 13. (notes-air temperature conversions) a. 80 C to F
Mr. P s Science Test!
 WEATHER- 2017 Mr. P s Science Test! # Name Date 1. Draw and label a weather station model. (10 pts) 2. The is the layer of the atmosphere with our weather. 3. Meteorologists classify clouds in about different
Use the terms from the following list to complete the sentences below. Each term may be used only once.
 Skills Worksheet Directed Reading Section: Air Masses Use the terms from the following list to complete the sentences below. Each term may be used only once. high pressure poles low pressure equator wind
Weather Practice. 4. As wind velocity decreases, the distance between isobars on a weather map will A) decrease B) increase C) remain the same
 decrease B) increase C) remain the same") 1. The chart below shows the air temperature and the dewpoint temperature near the ground at a given location for four consecutive days. All temperatures were recorded at noon. Which statement is best
1. The chart below shows the air temperature and the dewpoint temperature near the ground at a given location for four consecutive days. All temperatures were recorded at noon. Which statement is best
Revision Topic 8. Kingdom Schools Science Department Grade 5 Term 2. Name: Date: Section: 8A 8-1 8B 8-2
 Kingdom Schools Science Department Grade 5 Term 2 Name: Date: Section: Revision Topic 8 Nb Lesson Assessed Skills Test Items 8A 8-1 Understand how air pressure relates to altitude, convection currents,
Chapter 12 Section 12.1 The causes of weather
 Chapter 12 Section 12.1 The causes of weather Main Idea: Air masses have different temperatures and amounts of moisture because of the uneven heating of earth's surface. What is Meteorology The study of
Predicting Weather Conditions. Do you have a career as a meteorologist?
 Predicting Weather Conditions Do you have a career as a meteorologist? It is essential for students for know 1. Weather conditions and patterns can be based on weather data collected from various sources.
Forecasting Weather: Air Masses and Fronts
 Forecasting Weather: Air Masses and Fronts Weather is a combination of local conditions at any one time. It's what's happening outside right now, right here. Weather includes: Temperature Humidity Air
Weather Merit Badge Worksheet Hiller Aviation Museum
 Weather Merit Badge Worksheet Hiller Aviation Museum This worksheet is not required but is designed to help you complete the Aviation Merit Badge requirements. No one can add to or subtract from the Boy
Weather Part I- Weather Variables
 Weather Part I- Weather Variables 3-1-19 Definitions Meteorology- is the study of the atmosphere- including weather. Weather-the daily conditions of the atmosphere. It can change from time to time and
Practical Atmospheric Analysis
 Chapter 12 Practical Atmospheric Analysis With the ready availability of computer forecast models and statistical forecast data, it is very easy to prepare a forecast without ever looking at actual observations,