Maps and Remote Sensing AOSC 200 Tim Canty
|
|
|
- Beverly Kelly
- 5 years ago
- Views:
Transcription

1 Maps and Remote Sensing AOSC 200 Tim Canty Class Web Site: Topics for today: Weather Maps Radar Satellite Observations Lecture 04 Feb Today s Weather Map 2
2 Thursday s Forecast from Tuesday 3 Today s Forecast 4

3 Tomorrow s Forecast 5 Saturday s Forecast 6
4 Temperature Maps Temperature maps are often colored based on how warm (red) or cold (blue) the surface temperatures are Fig 2-2 Weather: A Concise Introduction 7 Temperature Maps The black lines indicate isotherms or lines of constant temperature. These maps help us identify the air masses that are controlling surface conditions and the temperature frontal boundaries between them Fig 2-2 Weather: A Concise Introduction 8
5 Temperature Fronts A cold front is a region where cold air is replacing warm air. It s indicated by a blue line with blue triangles pointing in the direction the air mass is moving. Fig 2-3 Weather: A Concise Introduction 9 Temperature Fronts A warm front is a region where warm air is replacing cold air. It s indicated by a red line with red half circles pointing in the direction the air mass is moving. Fig 2-3 Weather: A Concise Introduction 10
 and can t rely on the colors to tell you which type of front you re looking at.")
6 Temperature Fronts Recognize the fronts by the symbols!!! You might have a black and white map (like on a test.hint hint!!) and can t rely on the colors to tell you which type of front you re looking at. Fig 2-3 Weather: A Concise Introduction 11 Pressure Maps The black lines indicate isobars or lines of constant pressure. These maps help us identify regions of high pressure ( H ) and low pressure ( L ). They also give some indication of surface wind speed and direction. The numbers are the actual pressure (no conversion needed) Fig 2-4 Weather: A Concise Introduction 12
7 Pressure Maps Generally, isobars are plotted at 4 hpa intervals If it helps, consider this like a map of surface height and you ll get an idea of where are is flowing too and how fast it s moving. Fig 2-4 Weather: A Concise Introduction 13 Pressure Maps Closed contours define regions of high pressure and low pressure. Fig 2-5 Weather: A Concise Introduction 14

8 Pressure Maps Isobars that aren t closed can still help us define regions of increasing ( ridges ) and decreasing ( troughs ) pressure. Fig 2-6 Weather: A Concise Introduction 15 Temperature Maps We can combine the different ways of looking at surface data to create what you may recognize as a modern weather map Fig 2-2 Weather: A Concise Introduction 16
9 Weather Maps We can combine the different ways of looking at surface data to create what you may recognize as a modern weather map Fig 2-2 Weather: A Concise Introduction 17 Upper Level Maps We can look at pressure maps at a some particular altitude but the mathematics becomes very complicated Instead, we look at altitude of a specific pressure level. The figures to the right show the height (in meters) of the 850 hpa surface. Fig 2-8 Weather: A Concise Introduction 18
10 Upper Level Maps The station model provides slightly different information than at the surface. The height of the pressure surface is in the position where pressure used to be. Maps of this information are called isobaric maps Fig 2-9 Weather: A Concise Introduction 19 Weather Maps: Surface We can combine the different ways of looking at surface data to create what you may recognize as a modern weather map Fig 2-2 Weather: A Concise Introduction 20
11 Weather Maps: 500 mb The color contours represent wind speed (in knots). Notice that the fastest winds in the central US are almost above the position of the surface low pressure. Here the black lines are in decameters. Fig 2-10 Weather: A Concise Introduction 21 Weather Maps: 500 mb Sometimes this information is plotted as the hpa thickness Fig 2-10 Weather: A Concise Introduction 22


12 Mean Sea Level Pressure Pressure and altitude are connected: pressure decreases with height The air pressure at the top of a mountain is lower than at the beach. If you didn t account for this then your forecasts would assumer there s always a low pressure system over the mountains. You need to correct for this by determining what the pressure on the top of the mountain would be if you brought it to sea level (~10mbar for every 100m) Fig Weather: A Concise Introduction 23 RADAR: RAdio Detection and Ranging RADAR measures the time it takes for the signal to return Fig 5.45: Essentials of Meteorology 24


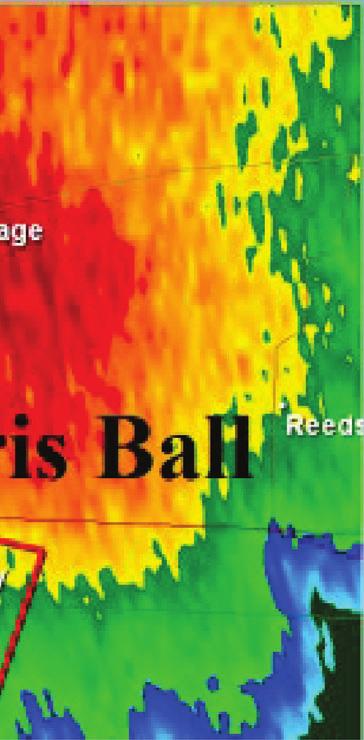
13 RADAR: RAdio Detection and Ranging Doppler Doppler RADAR measures changes in the return signal Fig 5-22 Meteorology: Understanding the Atmosphere 25 RADAR: RAdio Detection and Ranging Dual Polarization Can provide information about precipitation types rain, hail, snow, sleet 26

14 RADAR Coverage: United States Fig 2-12 Weather: A Concise Introduction 27 Geostationary satellites: Orbits the Earth at the same angular speed as the Earth. They are parked in orbit over Earth and stay over the same location. Provide a lot of information at all times but only at one location and have difficulty seeing the polar regions Fig 2-19 Weather: A Concise Introduction 28


15 Polar orbiting satellites: Travel over the poles. Orbits wrap around the Earth. Need to travel quickly to provide cover the globe. Can be very high resolution because they orbit closer to the surface than geostationary satellites Problems: Data gaps in time and space. Fig 2-24 Weather: A Concise Introduction 29 Satellite Imagery: Visible Fig 2-13 Weather: A Concise Introduction 30

 This is a false color image.")

16 Satellite Imagery: Visible What s the main limitation of the visible image? You need light to see anything! Fig 2-14 Weather: A Concise Introduction 31 Satellite Imagery: Infrared (heat) This is a false color image. The lighter the color, the colder the temperature. What does this tell us about clouds? Fig 2-14 Weather: A Concise Introduction 32


17 Satellite Imagery: Infrared (heat) This is a false color image. The lighter the color, the colder the temperature. What does this tell us about clouds? Can you think of a limitation of the infrared image? Fig 2-14 Weather: A Concise Introduction 33 Satellite Imagery: Water Vapor This is a false color image. Water vapor absorbs and emits energy. You can tune an instrument to only see the wavelengths where water vapor absorbs and emits energy Fig 2-18 Weather: A Concise Introduction 34
Remote Sensing Observations AOSC 200 Tim Canty
 Remote Sensing Observations AOSC 200 Tim Canty Class Web Site: http://www.atmos.umd.edu/~tcanty/aosc200 Topics for today: Maps Radar Satellite Observations Lecture 04 Feb 7 2019 1 Today s Weather Map http://www.wpc.ncep.noaa.gov/sfc/namussfcwbg.gif
Fun with Weather Maps! (no, really stop laughing) AOSC 200 Tim Canty
 AOSC 200 Tim Canty") Fun with Weather Maps! (no, really stop laughing) AOSC 200 Tim Canty Class Web Site: http://www.atmos.umd.edu/~tcanty/aosc200 Topics for today: Observations Station Model Temperature Maps Pressure Maps
Fun with Weather Maps! (no, really stop laughing) AOSC 200 Tim Canty Class Web Site: http://www.atmos.umd.edu/~tcanty/aosc200 Topics for today: Observations Station Model Temperature Maps Pressure Maps
Weather Station Model
 Fun with Weather Maps! (no, really stop laughing) AOSC 200 Tim Canty Class Web Site: http://www.atmos.umd.edu/~tcanty/aosc200 Topics for today: Station Model Temperature Maps Pressure Maps Fronts Lecture
Precipitation and Wind AOSC 200 Tim Canty. Current Weather
 Precipitation and Wind AOSC 200 Tim Canty Class Web Site: http://www.atmos.umd.edu/~tcanty/aosc200 Topics for today: Precipitation cont. RADAR Pressure Coriolis force Lecture 12 Oct 5 2017 1 Current Weather
Energy and the Earth AOSC 200 Tim Canty
 Energy and the Earth AOSC 200 Tim Canty Class Web Site: http://www.atmos.umd.edu/~tcanty/aosc200 Topics for today: Energy absorption Radiative Equilibirum Lecture 08 Feb 21 2019 1 Today s Weather Map http://www.wpc.ncep.noaa.gov/sfc/namussfcwbg.gif
Temperature, Observations, and Maps AOSC 200 Tim Canty. Weather and Climate
 Temperature, Observations, and Maps AOSC 200 Tim Canty Class Web Site: http://www.atmos.umd.edu/~tcanty/aosc200 Topics for today: Climate Weather Observations Weather Maps Lecture 03 Feb 5 2019 1 Weather
Chapter Introduction. Weather. Patterns. Forecasts Chapter Wrap-Up
 Chapter Introduction Lesson 1 Lesson 2 Lesson 3 Describing Weather Weather Patterns Weather Forecasts Chapter Wrap-Up How do scientists describe and predict weather? What do you think? Before you begin,
Module 11: Meteorology Topic 5 Content: Weather Maps Notes
 Introduction A variety of weather maps are produced by the National Weather Service and National Oceanographic Atmospheric Administration. These maps are used to help meteorologists accurately predict
The Water Cycle. Water in the Atmosphere AOSC 200 Tim Canty. Class Web Site:
 Water in the Atmosphere AOSC 200 Tim Canty Class Web Site: http://www.atmos.umd.edu/~tcanty/aosc200 Topics for today: Latent Heat Evaporation & Saturation Relative Humidity Dew Point Lecture 11 Oct 2 2018
Remote Sensing in Meteorology: Satellites and Radar. AT 351 Lab 10 April 2, Remote Sensing
 Remote Sensing in Meteorology: Satellites and Radar AT 351 Lab 10 April 2, 2008 Remote Sensing Remote sensing is gathering information about something without being in physical contact with it typically
AOSC 200 Tim Canty. Class Web Site: Topics for today: Air Masses. Fronts. Lecture 19 Apr
 Air Masses AOSC 200 Tim Canty Class Web Site: http://www.atmos.umd.edu/~tcanty/aosc200 Topics for today: Air Masses Fronts Lecture 19 Apr 11 2019 1 Today s Weather Map http://www.wpc.ncep.noaa.gov/#page=sfc
Temperature AOSC 200 Tim Canty
 Temperature AOSC 200 Tim Canty Class Web Site: http://www.atmos.umd.edu/~tcanty/aosc200 Topics for today: Daily Temperatures Role of clouds, latitude, land/water Lecture 09 Feb 26 2019 1 Today s Weather
Clouds. What they tell us about the weather
 Clouds What they tell us about the weather Spring funnel cloud over Willard, Utah 2003 Cloud coverage 581-586 How to show Cloud Coverage On a weather map meteorologists use circles shaded differently to
4 Forecasting Weather
 CHAPTER 16 4 Forecasting Weather SECTION Understanding Weather BEFORE YOU READ After you read this section, you should be able to answer these questions: What instruments are used to forecast weather?
Chapter 1 Anatomy of a Cyclone
 Chapter 1 Anatomy of a Cyclone The Beast in the East 15-17 February 2003 Extra-tropical cyclone an area of low pressure outside of the tropics Other names for extra-tropical cyclones: Cyclone Mid-latitude
Analyzing/Forecasting Weather
 Analyzing/Forecasting Weather Focus Question Dude Its wind. It blows everywhere. Meteorologist to Nicholas Cage in The Weatherman VA SOL SOL 3 The student will investigate and understand how to read and
Deliverable 4-2: Assessment items. Activity-oriented Quiz for Weather or Not? Investigation in Exploring the Environment
 Deliverable 4-2: Assessment items Activity-oriented Quiz for Weather or Not? Investigation in Exploring the Environment In Weather or Not? you predicted the weather using satellite images and other kinds
Answers to Clicker Questions
 Answers to Clicker Questions Chapter 1 What component of the atmosphere is most important to weather? A. Nitrogen B. Oxygen C. Carbon dioxide D. Ozone E. Water What location would have the lowest surface
Unit: Weather Study Guide
 Name: Period: Unit: Weather Study Guide Define each vocabulary word on a separate piece of paper or index card. Weather Climate Temperature Wind chill Heat index Sky conditions UV index Visibility Wind
AOSC201: Weather and Climate Lab
 AOSC201: Weather and Climate Lab Week 8: Forecasting - Analysis Section 107/108 Instructor: Agniv Sengupta q Lab #7 of Lab Manual (pages 41-49) q 50 points in total q INDIVIDUAL Work for the entire lab
Precipitation AOSC 200 Tim Canty. Cloud Development: Orographic Lifting
 Precipitation AOSC 200 Tim Canty Class Web Site: http://www.atmos.umd.edu/~tcanty/aosc200 Topics for today: Precipitation formation Rain Ice Lecture 14 Oct 11 2018 1 Cloud Development: Orographic Lifting
Moisture, Clouds, and Precipitation: Clouds and Precipitation. Dr. Michael J Passow
 Moisture, Clouds, and Precipitation: Clouds and Precipitation Dr. Michael J Passow What Processes Lift Air? Clouds require three things: water vapor, a condensation nucleus, and cooling Cooling usually
Chapter 5: Weather. Only Section 1: What is Weather?
 Chapter 5: Weather Only Section 1: What is Weather? Find the definitions of: Meteorology, meteorologist, weather, climate Not in book? Use the dictionaries **Meteorology - Meteorology is the study of the
Unit 5 Lesson 3 How is Weather Predicted? Copyright Houghton Mifflin Harcourt Publishing Company
 Tracking the Weather Warm up 1 Why is it important to watch the weather forecast before traveling to another country? Tracking the Weather A meteorologist is a scientist who studies weather. Meteorologists
FORMATION OF AIR MASSES
 Chapter 24: Weather (air mass, fronts, Weather instruments, and forecasting the weather) Name: Period: Due Date: Air Mass Use the terms from the following list to complete the sentences below. Each term
ESCI 1010 Lab 6 Midlatitude Cyclones and Thunderstorms
 ESCI 1010 Lab 6 Midlatitude Cyclones and Thunderstorms Before Lab: Review pages 244-324 in your Weather and Climate textbook. Pay special attention to the sections entitled Fronts, Life Cyclone of a Midlatitude
2. What are the four most common gasses in the atmosphere and their percentages?
 Meteorology Review Directions: Answer the following open ended review questions. Utilize a diagram where appropriate and do make sure that you label and describe the drawing. Atmospheric Composition 1.
4 Forecasting Weather
 CHAPTER 2 4 Forecasting Weather SECTION Understanding Weather BEFORE YOU READ After you read this section, you should be able to answer these questions: What instruments are used to forecast weather? How
Chapter 12 Section 12.1 The causes of weather
 Chapter 12 Section 12.1 The causes of weather Main Idea: Air masses have different temperatures and amounts of moisture because of the uneven heating of earth's surface. What is Meteorology The study of
Lab 19.2 Synoptic Weather Maps
 Lab 19.2 Synoptic Weather Maps Name: Partner: Purpose The purpose of this lab is to have you read and interpret the information displayed on synoptic weather maps. You will also learn the techniques used
Clouds and Rain Unit (3 pts)
") Name: Section: Clouds and Rain Unit (Topic 8A-2) page 1 Clouds and Rain Unit (3 pts) As air rises, it cools due to the reduction in atmospheric pressure Air mainly consists of oxygen molecules and nitrogen
Name: Section: Clouds and Rain Unit (Topic 8A-2) page 1 Clouds and Rain Unit (3 pts) As air rises, it cools due to the reduction in atmospheric pressure Air mainly consists of oxygen molecules and nitrogen
Global Winds AOSC 200 Tim Canty
 Global Winds AOSC 200 Tim Canty Class Web Site: http://www.atmos.umd.edu/~tcanty/aosc200 Topics for today: Air Masses Fronts Lecture 18 Oct 31 2017 1 Air Masses What is an air mass? Large body of air whose
Climate & Earth System Science. Introduction to Meteorology & Climate. Chapter 05 SOME OBSERVING INSTRUMENTS. Instrument Enclosure.
 Climate & Earth System Science Introduction to Meteorology & Climate MAPH 10050 Peter Lynch Peter Lynch Meteorology & Climate Centre School of Mathematical Sciences University College Dublin Meteorology
Weather Unit Part 2: Meteorology
 Name: Earth Science Date: Period: Weather Unit Part 2: Meteorology 1 The map below shows North America and its surrounding bodies of water. Country borders are shown. On the map, label the following locations:
Earth Science Lesson Plan Quarter 2, Week 4, Day 1
 Earth Science Lesson Plan Quarter 2, Week 4, Day 1 1 Outcomes for Today PREPARE 1. Background knowledge necessary for today s reading. In order to make forecasts, meteorologists must gather accurate weather
Use the terms from the following list to complete the sentences below. Each term may be used only once.
 Skills Worksheet Directed Reading Section: Air Masses Use the terms from the following list to complete the sentences below. Each term may be used only once. high pressure poles low pressure equator wind
25.1 Air Masses. Section 25.1 Objectives
 Section 25.1 Objectives Explain how an air mass forms. List the four main types of air masses. Describe how air masses affect the weather of North America. Air Masses 25.1 Air Masses Differences in air
STATION If relative humidity is 60% and saturation vapor pressure is 35 mb, what is the actual vapor pressure?
 STATION 1 Vapor pressure is a measure of relative humidity and saturation vapor pressure. Using this information and the information given in the problem, answer the following question. 1. If relative
Forecasting AOSC 200 Tim Canty. Class Web Site: Lecture 26 Nov 29, Weather Forecasting
 Forecasting AOSC 200 Tim Canty Class Web Site: http://www.atmos.umd.edu/~tcanty/aosc200 Topics for today: Forecasting Lecture 26 Nov 29, 2018 1 Weather Forecasting People have been trying to predict the
Tropical Cyclones: When Nature Attacks!! AOSC 200 Tim Canty. Tropical Cyclone: African Easterly Jet
 Tropical Cyclones: When Nature Attacks!! AOSC 200 Tim Canty Class Web Site: http://www.atmos.umd.edu/~tcanty/aosc200 Topics for today: Really powerful low pressure systems Lecture 25 Nov 27 2018 1 Tropical
Chapter 12: Meteorology
 Chapter 12: Meteorology Section 1: The Causes of Weather 1. Compare and contrast weather and climate. 2. Analyze how imbalances in the heating of Earth s surface create weather. 3. Describe how and where
Mr. P s Science Test!
 WEATHER- 2017 Mr. P s Science Test! # Name Date 1. Draw and label a weather station model. (10 pts) 2. The is the layer of the atmosphere with our weather. 3. Meteorologists classify clouds in about different
Weather vs. Climate. Tucson NWS homepage:
 Weather vs. Climate Tucson NWS homepage: www.nws.noaa.gov/twc/ A Weather Forecaster? Betty claims to know exactly when it s going to rain because her knee starts to hurt. Ms. Betty Martin of Newburgh,
Weather, Air Masses, Fronts and Global Wind Patterns. Meteorology
 Weather, Air Masses, Fronts and Global Wind Patterns Meteorology Weather is what conditions of the atmosphere are over a short period of time. Climate is how the atmosphere "behaves" over long periods
Guided Notes Weather. Part 2: Meteorology Air Masses Fronts Weather Maps Storms Storm Preparation
 Guided Notes Weather Part 2: Meteorology Air Masses Fronts Weather Maps Storms Storm Preparation The map below shows North America and its surrounding bodies of water. Country borders are shown. On the
What is the atmosphere? What is the difference between weather and climate? What elements influence climate? Could you explain what the wind is?
 WEATHER AND CLIMATE What is the atmosphere? What is the difference between weather and climate? What elements influence climate? Could you explain what the wind is? What are the Earth s main climate? What
Learning scale: Identify weather systems based on data including temperature, pressure and moisture. the formation of weather.
 Learning goal: How the of through the Earth s atmosphere, the Earth s, absorption and radiation of create patterns and Learning goal: How the of through the Earth s atmosphere, the Earth s, absorption
ESCI 1010 Lab 1 Introduction to Weather Data
 ESCI 1010 Lab 1 Introduction to Weather Data Before Lab: Review pages 1-51 in your Weather and Climate textbook. Pay special attention to the sections entitled Location and Time on Earth and Some Weather
Weather What is weather? Weather. is the study of our atmosphere. Atmosphere literally means vapor (atmos) of a sphere.
 of a sphere.") Weather What is weather? Weather is the study of our atmosphere. Atmosphere literally means vapor (atmos) of a sphere. Our atmosphere is made up of 4 basic layers: The outermost layer is the thermosphere
Weather What is weather? Weather is the study of our atmosphere. Atmosphere literally means vapor (atmos) of a sphere. Our atmosphere is made up of 4 basic layers: The outermost layer is the thermosphere
PRACTICAL ACTIVITY: DRAWING ISOLINES OR CONTOURS
 COME RAIN OR SHINE PRACTICAL ACTIVITY: DRAWING ISOLINES OR CONTOURS Ideally you would need a pencil for this activity (rather than a pen) and coloured pencils are useful too. These activities maybe a little
Final Weather Unit Study Guide
 Name: Atmospheric Composition and Layers Altitude Atmosphere Composition Troposphere Air Pressure Stratosphere Mesosphere Thermosphere Exosphere Ionosphere Sample Questions: Final Weather Unit Study Guide
Metr 201 Quiz #2 100 pts. A. Short Answer and Definitions. (4 points each for a total of 28 points in this section).
.") Department of Earth & Climate Sciences Name San Francisco State University February 23, 2015 Metr 201 Quiz #2 100 pts. A. Short Answer and Definitions. (4 points each for a total of 28 points in this section).
Department of Earth & Climate Sciences Name San Francisco State University February 23, 2015 Metr 201 Quiz #2 100 pts. A. Short Answer and Definitions. (4 points each for a total of 28 points in this section).
God Gives Us Spring and Rain
 Lesson 8 God Gives Us Spring and Rain Vocabulary equator: an imaginary circle around the center of the earth halfway between the North Pole and South Pole water cycle: the cycle that occurs when water
Earth Science. Lab 21: Weather Patterns
 Name: Lab 21: Weather Patterns Earth Science Date: Introduction: A basic principle in Earth Science is that energy is constantly bringing about changes. In order to understand the changing Earth, we must
SPI Analyze data to identify events associated with heat convection in the atmosphere. SPI Recognize the connection between the
 SPI 0607.8.1 - Analyze data to identify events associated with heat convection in the atmosphere. SPI 0607.8.2 - Recognize the connection between the sun s energy and the wind. o Energy from the Sun creates
Meteorology Unit Study Guide
 Name: Key Pd. Date: 1. Define meteorology Meteorology Unit Study Guide Study of the atmosphere including weather and weather patterns 2. The most abundant gas in the atmosphere by volume is. This gas comprises
Weather and the Atmosphere. RAP Short Course
 Weather and the Atmosphere RAP Short Course Syllabus 1) Vertical structure and composition of the atmosphere, basic weather variables 2) Warming Earth and its atmosphere the diurnal and seasonal cycles
February 2011: A Month of Below Average Temperatures, A Record Cold Snap, and a Sharp Frontal Passage with Snow
 1 Steven Mullen February 2011: A Month of Below Average Temperatures, A Record Cold Snap, and a Sharp Frontal Passage with Snow Overview of the Weather and Detail Diagnosis for Feb 25 th -27 th Daily surface
Weather - is the state of the atmosphere at a specific time & place
 Weather Section 1 Weather - is the state of the atmosphere at a specific time & place Includes such conditions as air pressure, wind, temperature, and moisture in the air The Sun s heat evaporates water
Go With the Flow From High to Low Investigating Isobars
 Go With the Flow From High to Low Investigating Isobars Science 10 Mrs. Purba Air Masses The air over a warm surface can be heated, causing it to rise above more dense air. The result is the formation
DEPARTMENT OF GEOSCIENCES SAN FRANCISCO STATE UNIVERSITY. Metr Fall 2012 Test #1 200 pts. Part I. Surface Chart Interpretation.
 DEPARTMENT OF GEOSCIENCES SAN FRANCISCO STATE UNIVERSITY NAME Metr 356.01 Fall 2012 Test #1 200 pts Part I. Surface Chart Interpretation. Figure 1. Surface Chart for 1500Z 7 September 2007 1 1. Pressure
Atmospheric Basics AOSC 200 Tim Canty
 Atmospheric Basics AOSC 200 Tim Canty Class Web Site: http://www.atmos.umd.edu/~tcanty/aosc200 Topics for today: Structure of the Atmosphere Temperature vs height Atmospheric pressure Atmospheric composition
CURRICULUM OUTLINE. DEPARTMENT: Science DATE: January, 2004
 PARAMUS ELEMENTARY SCHOOL PARAMUS, NEW JERSEY CURRICULUM OUTLINE DEPARTMENT: Science DATE: January, 2004 COURSE: The Earth s Atmosphere GRADE LEVEL: Grade 6 I. COURSE DESCRIPTION: The student will explore
Weather. Describing Weather
 Weather Describing Weather What is weather? Weather is the atmospheric conditions, along with short-term changes, of a certain place at a certain time. Have you ever been caught in a rainstorm on what
Cyclones and Anticyclones, Ridges and Troughs
 Cyclones and Anticyclones, Ridges and Troughs Isobars on surface maps often have a closed appearance (as illustrated) Areas of low pressure are called cyclones, while areas with high pressure are called
May 17, earthsciencechapter24.notebook. Apr 8 10:54 AM Review. Grade:9th. Subject:Earth Science. Date:4/8.
 Apr 8 10:54 AM 24.1 Review Grade:9th Subject:Earth Science Date:4/8 Apr 8 9:29 AM 1 1 As lower layers of air are warmed... A the air rises B winds form C the air dries D the air sinks Apr 8 9:49 AM 2 What
Science Olympiad Meteorology Quiz #1 Page 1 of 7
 1) What is generally true about the stratosphere: a) Has turbulent updrafts and downdrafts. b) Has either a stable or increasing temperature profile with altitude. c) Where the auroras occur. d) Both a)
Pilots watch the clouds, because clouds can indicate the kind of weather in store for a flight.
 Low stratus Cumulonimbus Pilots watch the clouds, because clouds can indicate the kind of weather in store for a flight. FILL IN THE BLANKS OR CIRCLE ONE: A. Stratus means flat or on one level. Low stratus
 http://www.ssec.wisc.edu/data/composites.html Red curve: Incoming solar radiation Blue curve: Outgoing infrared radiation. Three-cell model of general circulation Mid-latitudes: 30 to 60 latitude MID-LATITUDES
Weather Maps. Name:& & &&&&&Advisory:& & 1.! A&weather&map&is:& & & & 2.! Weather&fronts&are:& & & & & &
 Name: Advisory: Weather Maps 1. Aweathermapis: 2. Weatherfrontsare: a. Labelthefrontsbelow: 1. 2. 3. 4. 3. Clovercoversymbols 4. Precipitationsymbols 5. 6. 7. 8. 5. RadarEchoIntensityshows 6. Isobarsare
Weather Practice. 4. As wind velocity decreases, the distance between isobars on a weather map will A) decrease B) increase C) remain the same
 decrease B) increase C) remain the same") 1. The chart below shows the air temperature and the dewpoint temperature near the ground at a given location for four consecutive days. All temperatures were recorded at noon. Which statement is best
1. The chart below shows the air temperature and the dewpoint temperature near the ground at a given location for four consecutive days. All temperatures were recorded at noon. Which statement is best
Page 1. Name:
 Name: 1) As the difference between the dewpoint temperature and the air temperature decreases, the probability of precipitation increases remains the same decreases 2) Which statement best explains why
Meteorology Final Exam Study Guide Part 2
 Name: Teacher Science 8. Date: Water in the Air 1. Define the following terms: Meteorology Final Exam Study Guide Part 2 Evaporation Condensation Relative Humidity Dew Point Humidity Saturation Condensation
III. Section 3.3 Vertical air motion can cause severe storms
 III. Section 3.3 Vertical air motion can cause severe storms http://www.youtube.com/watch?v=nxwbr60tflg&feature=relmfu A. Thunderstorms form from rising moist air Electrical charges build up near the tops
3 Severe Weather. Critical Thinking
 CHAPTER 2 3 Severe Weather SECTION Understanding Weather BEFORE YOU READ After you read this section, you should be able to answer these questions: What are some types of severe weather? How can you stay
1 What Is Climate? TAKE A LOOK 2. Explain Why do areas near the equator tend to have high temperatures?
 CHAPTER 17 1 What Is Climate? SECTION Climate BEFORE YOU READ After you read this section, you should be able to answer these questions: What is climate? What factors affect climate? How do climates differ
What do you think of when someone says weather?
 Weather Our World: What is Weather? video What do you think of when someone says weather? Questions from Bill Nye video 1. What causes wind? 2. What are two things that were mentioned by Bill Nye that
Dr. Christopher M. Godfrey University of North Carolina at Asheville
 Surface and Upper-Air Observations Surface Observations Collect information for synoptic-scale weather Most surface observations are automated (e.g., Automated Surface Observing System) Also mesoscale
Figure 1. Idealized global atmospheric circulation (C = surface convergence, D = surface divergence).
.") page - Laboratory Exercise #8 - Introduction to Atmospheric Science: Global Circulation and Weather Makers Section A - Global Atmospheric Circulation: To understand weather you need to understand how the
page - Laboratory Exercise #8 - Introduction to Atmospheric Science: Global Circulation and Weather Makers Section A - Global Atmospheric Circulation: To understand weather you need to understand how the
Lecture 4: Radiation Transfer
 Lecture 4: Radiation Transfer Spectrum of radiation Stefan-Boltzmann law Selective absorption and emission Reflection and scattering Remote sensing Importance of Radiation Transfer Virtually all the exchange
Temperature (T) degrees Celsius ( o C) arbitrary scale from 0 o C at melting point of ice to 100 o C at boiling point of water Also (Kelvin, K) = o C
 degrees Celsius ( o C) arbitrary scale from 0 o C at melting point of ice to 100 o C at boiling point of water Also (Kelvin, K) = o C") 1 2 3 4 Temperature (T) degrees Celsius ( o C) arbitrary scale from 0 o C at melting point of ice to 100 o C at boiling point of water Also (Kelvin, K) = o C plus 273.15 0 K is absolute zero, the minimum
1 2 3 4 Temperature (T) degrees Celsius ( o C) arbitrary scale from 0 o C at melting point of ice to 100 o C at boiling point of water Also (Kelvin, K) = o C plus 273.15 0 K is absolute zero, the minimum
above the land to be warmer, causing convection currents because of the difference in air pressure.
 Name Date Period Earth Science Unit Test Review Sheet Directions: Use my web site and/or your lab book to help to answer the following questions. 1. What type of weather does a low pressure system bring?
Forecast for 6/28-7/31. Forecaster: Matthew Brewer Forecast made at: 12z 6/27/2017
 Forecast for 6/28-7/31 Forecaster: Matthew Brewer Forecast made at: 12z 6/27/2017 Whiteface lodge Mesonet Meteogram for the past 24 hours http://www.nysmesonet.org/data/meteogram#?stid=wfmb Whiteface Summit
Guided Notes Weather. Part 1: Weather Factors Temperature Humidity Air Pressure Winds Station Models
 Guided Notes Weather Part 1: Weather Factors Temperature Humidity Air Pressure Winds Station Models. 1. What is weather? Weather: short-term atmospheric conditions in a specific area at a specific time
Climates are described by the same conditions used to describe
 58 The Causes of Climate R EA D I N G Climates are described by the same conditions used to describe weather, such as temperature, precipitation, and wind. You now know that oceans have an important effect
WEATHER FORECASTING Acquisition of Weather Information WFO Regions Weather Forecasting Tools Weather Forecasting Tools Weather Forecasting Methods
 1 2 3 4 5 6 7 8 WEATHER FORECASTING Chapter 13 Acquisition of Weather Information 10,000 land-based stations, hundreds of ships and buoys; four times a day, airports hourly Upper level: radiosonde, aircraft,
1/14/2019. INTRODUCTIONS Part 1. INTRODUCTIONS part 2. Weather and Climate Jim Keller & Paul Belanger. Classroom assistant: Fritz Ihrig
 Weather and Climate Jim Keller & Paul Belanger Classroom assistant: Fritz Ihrig Week 1: January 15 th, 2019 1 INTRODUCTIONS Part 1 Fritz Ihrig; classroom assistant, liaison to OLLI: fgihrig@msn.com ; h.
Key. Name: OBJECTIVES
 Name: Key OBJECTIVES Correctly define: air mass, air pressure, anemometer, barometer, cyclone, dew point, front, isobar, isotherm, meteorology, precipitation, psychrometer, relative humidity, saturated,
CHAPTER 13 WEATHER ANALYSIS AND FORECASTING MULTIPLE CHOICE QUESTIONS
 CHAPTER 13 WEATHER ANALYSIS AND FORECASTING MULTIPLE CHOICE QUESTIONS 1. The atmosphere is a continuous fluid that envelops the globe, so that weather observation, analysis, and forecasting require international
Weather Forecasting. pencils, colored daily weather maps for consecutive days (5)
") Long-Term Projects Weather Forecasting Every three hours, the National Weather Service collects data from about 800 weather stations located around the world. Daily newspapers summarize this weather data
Long-Term Projects Weather Forecasting Every three hours, the National Weather Service collects data from about 800 weather stations located around the world. Daily newspapers summarize this weather data
INTRODUCTIONS Part 1
 Weather and Climate Jim Keller & Paul Belanger Classroom assistant: Fritz Ihrig Week 1: January 15 th, 2019 1 INTRODUCTIONS Part 1 Fritz Ihrig; classroom assistant, liaison to OLLI: fgihrig@msn.com ; h.
Weather & Climate. Sanjay S. Limaye Space Science & Engineering Center University of Wisconsin-Madison
 Weather & Climate Sanjay S. Limaye Space Science & Engineering Center University of Wisconsin-Madison 1 What is Weather? Webster s New Collegiate Dictionary: state of the atmosphere with respect to heat
Forecast Models. General Meteorology Laboratory #11
 General Meteorology Laboratory #11 Name Partners Forecast Models Date _ Section Purpose: Develop the ability to contour two dimensional data and use the resulting information to locate a cold front. Equipment:
WEATHER PATTERNS NAME DATE. VOCABULARY: Synoptic weather map- Isotherm- Barometric Pressure- Isobar- Convergence- Divergence- Cyclone- Anticyclone-
 NAME DATE VOCABULARY: Synoptic weather map- WEATHER PATTERNS Isotherm- Barometric Pressure- Isobar- Convergence- Divergence- Cyclone- Anticyclone- Air mass- Source region- Front- OBJECTIVE: Construct a
Introduction. Sunny Partly Cloudy Cloudy. Flurries Snow Ice. Showers Thunderstorms Rain. High Pressure Low Pressure FRONTS. Cold Warm Stationary
 Introduction Weather can change from minute to minute, hour to hour, day to day, or season to season. Meteorologists are scientists who study Earth s atmosphere in order to predict these changes. Meteorologists
2) What general circulation wind belt is the place of origin for hurricanes? A) westerlies B) trade winds C) doldrums D) horse latitudes
 What general circulation wind belt is the place of origin for hurricanes? A) westerlies B) trade winds C) doldrums D) horse latitudes") Meteo 1010 Homework 6 1) What is the difference between a typhoon and a hurricane? A) A hurricane is a true tropical cyclone, but a typhoon is not. B) A hurricane is stronger than a typhoon. C) They represent
Meteo 1010 Homework 6 1) What is the difference between a typhoon and a hurricane? A) A hurricane is a true tropical cyclone, but a typhoon is not. B) A hurricane is stronger than a typhoon. C) They represent
Thermal / Solar. When air is warmed it... Rises. Solar Energy. Evaporation. Condensation Forms Clouds
 Thermal / Solar Light from the Sun is transformed into what type of energy when it hits Earth's surface? Rises When air is warmed it... Solar Energy Water moves through the water cycle using what type
Weather and Climate 1. Elements of the weather
 Weather and Climate 1 affect = to have an effect on, influence, change altitude = the height of a place above the sea axis = the line around which an object rotates certain = special consist of = to be
3 Weather and Climate
 CHAPTER 22 3 Weather and Climate SECTION The Atmosphere KEY IDEAS As you read this section, keep these questions in mind: What are fronts? What are some types of severe weather? How is climate different
Introduction to Weather Moisture in the Air Vapor Pressure and Dew Point
 Introduction to Weather Moisture in the Air Vapor Pressure and Dew Point No study of weather would be complete without a discussion of precipitation. Here in Seattle it seems like it can rain for days