GEO165 LAB EXERCISE #3
|
|
|
- Meghan French
- 5 years ago
- Views:
Transcription
1 GEO165 LAB EXERCISE #3 Tools of the Meteorologist Part 2: Fronts Introduction 1. A front is the leading edge of a new air mass invading a region. Because Vilhelm Bjerknes was reminded of the bloody battle fronts of WWI he named these air mass boundaries, which is where cold and war air battle for dominance after the front in war. 2. All fronts are found in troughs of low pressure because surface convergence in a low pressure system causes the differences in the two air masses to be concentrated along the front, as a front approaches the pressure drops. Pressure bottoms out as the front passes and then rises. As is the case with most atmospheric variables pressure change is usually more distinct with a cold front. 3. A trof (meteorological shorthand for trough) is an elongated area of low pressure. All fronts are found in trofs but not all trofs are fronts. 4. A cold front is the leading edge of a cold air mass (ca, cpk, mpk) and it moves in the direction the triangles point. 5. A warm front is the leading edge of a warm air mass (ct, mt, cpw, mpw) and it moves in the direction the semi-circles are pointing. 6. Fronts are not paper-thin boundaries, in fact weak fronts may be 100 miles or more across and for that reason a front is often called a frontal zone. 7. Cold fronts are easier to find than warm fronts, they are more distinct. Sometimes satellite images, precipitation data or fog occurrence is necessary to locate a warm front, this is rarely the case with a cold front. 8. Review the information on the station model, map symbols and air masses found at: 9. A stationary front is a front that is almost stationary, more accurately it is called a quasi-stationary front. 10. An occluded front, which we will cover in the next lab, is a special case found late in the life cycle of the mid-latitude cyclone.
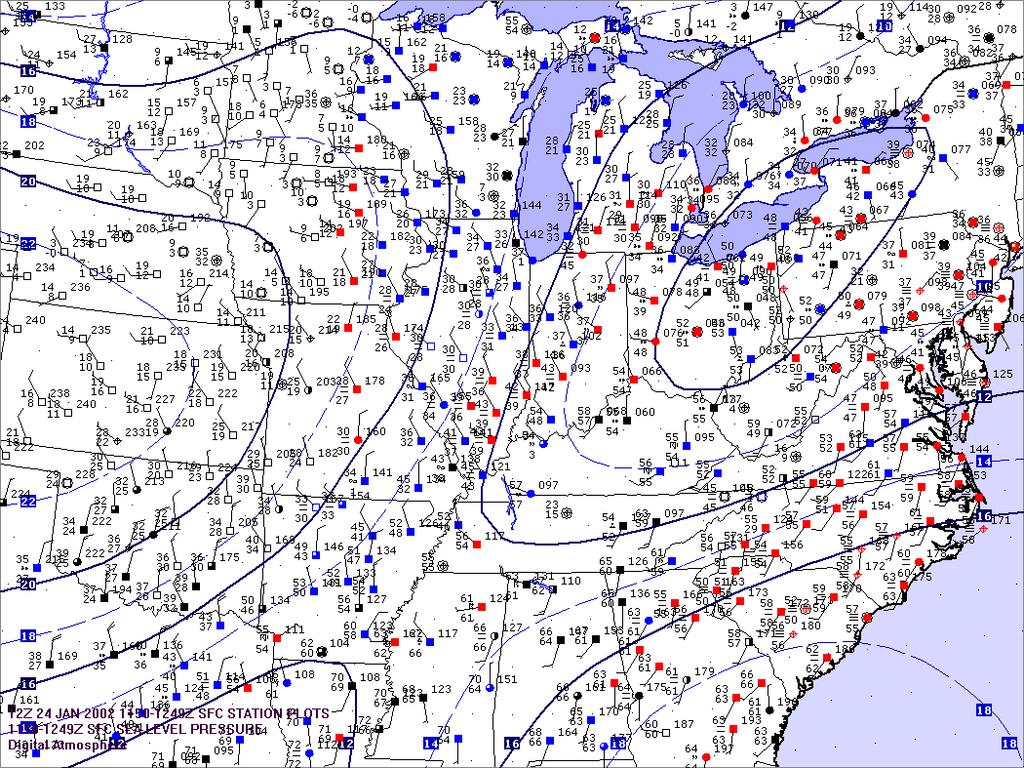
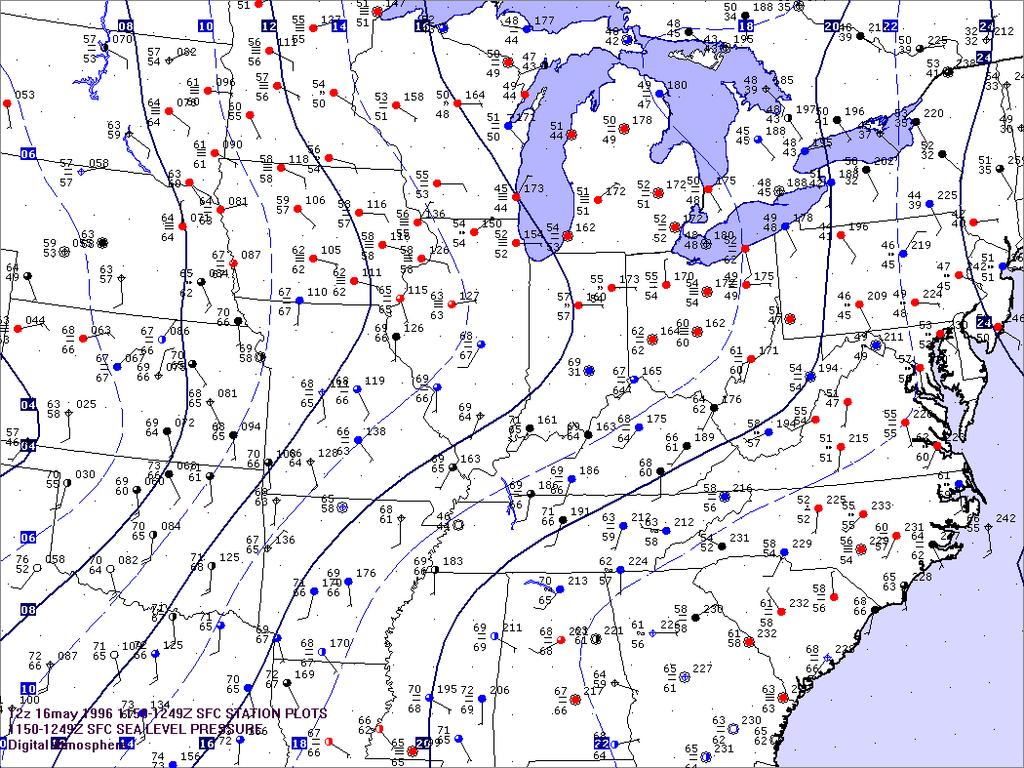
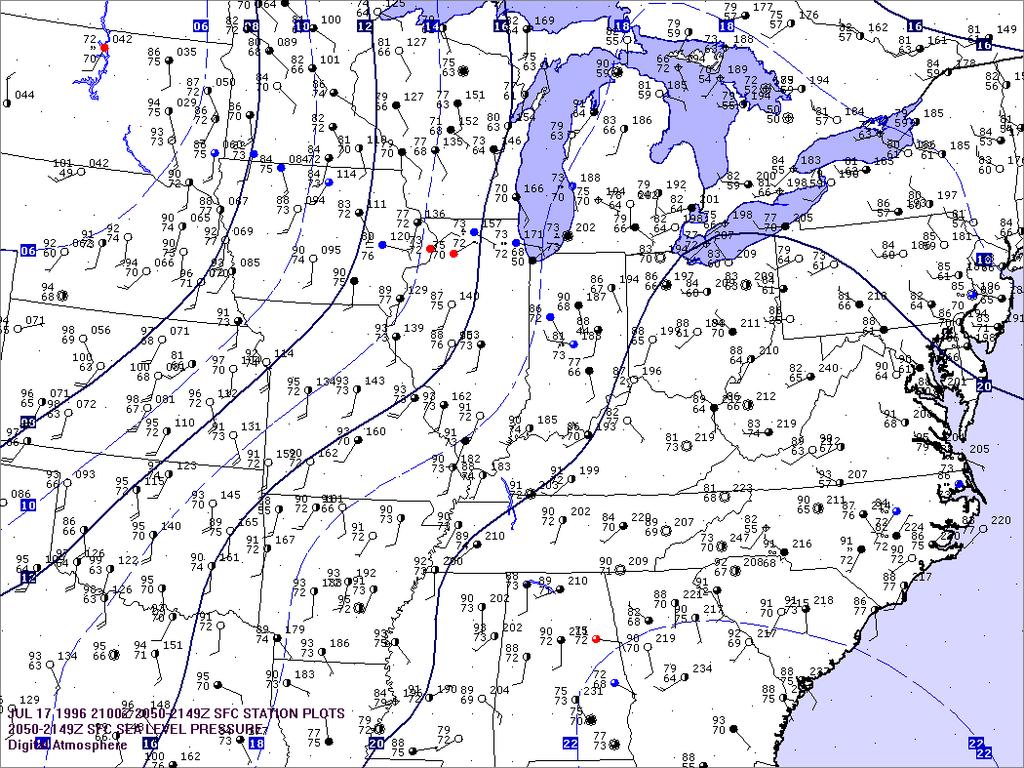
2 Maps for Lab #3 COLD FRONT MAPS 23z 30 DEC 2002, 12Z 24 JAN 2002 WARM FRONT MAPS 12Z 16 MAY 1996, 21Z 17 JUL 1996 Assignment 1. Analyze all maps following the procedures found at: and especially the detailed information at: 2. Create 3d surface graphs of pressure pattern using the MS Excel data sheet for the 24 JAN 2002 cold front and for the 17 JUL 1996 warm front. DPlot instructions: 3D SURFACE GRAPHS You are to create and save 2-3D surface graphs, one for the Cold front and another for the warm front. COLD FRONT 3D GRAPH 24JAN Z Select all values in the 3 columns for the anticyclone data. Click on DPlot on the menu bar. Click on XYZSurface Save the graph as a jpeg file. Select Options and click on Contour Options Click on View in 3D Set Azimuth to 76 Set Elevation to 41 Click on Draw Sides Set Intervals to 18 Set Lower to 1006 Set Higher to 1024 Click OK Double Click on the title data from lab2.xls and create an appropriate title that tells the viewer of the 3D Surface graph What he/she is viewing The date Axis Values When finished save the 3D surface graph.
3 WARM FRONT 3D GRAPH 17JUL Z For the middle warm front follow the same instructions but substitute the following values Set Azimuth to 76 Set Elevation to 41 Click on Draw Sides Set Intervals to 19 Set Lower to 1004 Set Higher to 1023 If the scale on the right has decimal numbers (it should not), go back to contour options and be sure the lower, higher, and interval values are correct. 3. Use the data in the other columns to create line graphs that illustrate the change of weather variables across a front. a. temperature and dew point temperature for 16MAY1996 b. temperature and dew point temperature for 30DEC2002 COLD FRONT LINE GRAPHS 30DEC Z Select the upper left temperature cell. Hold shift and click to lower right temperature cell. RELEASE SHIFT HOLD CTRL and select the upper left dew point cell RELEASE CTRL HOLD SHIFT Select lower right dew point cell. Select DPlot Select XYXY Label the graph as explained above. WARM FRONT LINE GRAPHS 16MAY Z REPEAT INSTRUCTIONS IMMEDIATELY ABOVE 4. Answer the questions.
4 NAME Lab #2 Questions 1. Compare the trofs of the cold front and warm front shown on the 3d surface graphs. a. Which trof is more distinct the cold front or warm front? b. Would you be able to locate the warm front based on the pressure pattern alone? c. Would you be able to locate the cold front on the pressure pattern alone? d. When analyzing a weather map which type of front should be easier to find? Why? 2. In what general directions are the winds from on either side of the cold front? WEST SIDE EAST SIDE
5 3. In what general directions are the winds from on either side of the warm front? NORTH SIDE SOUTH SIDE 4. On the 16May1996 warm front map what do you find that helps locate the warm front? Though pressure and dew point change are often weak this occurrence often helps the meteorologist to locate the warm front. Look in your text book and explain why this happens.
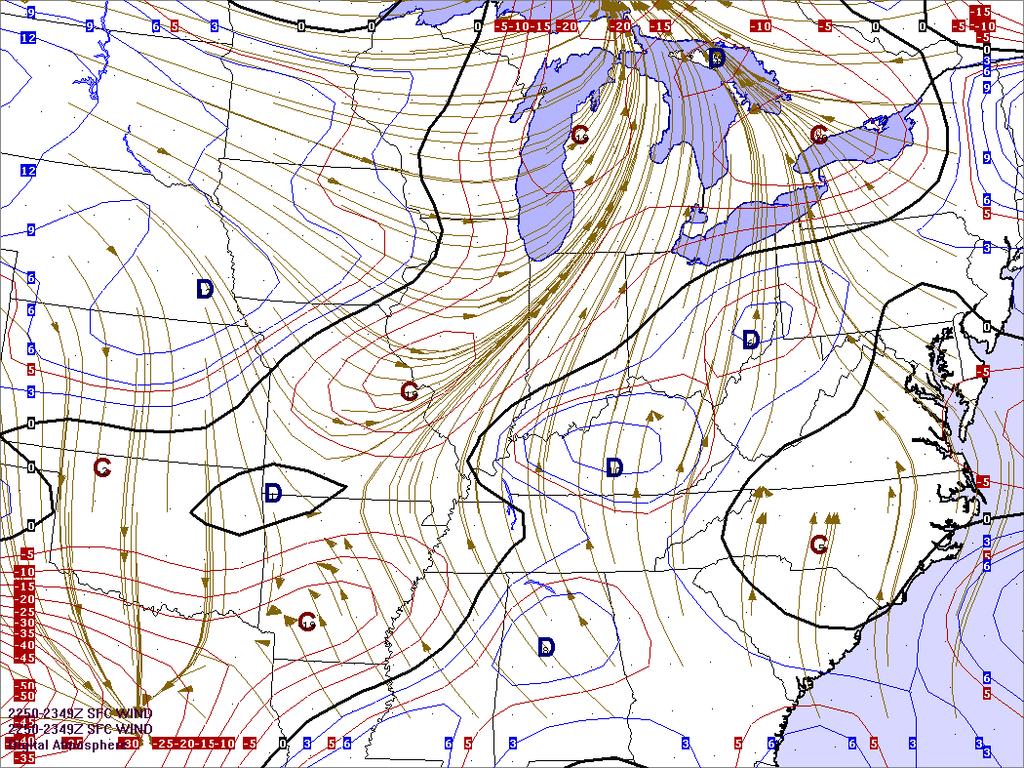
6 5. Describe what happens on the line graphs as you proceed from west to east across the cold front and from north to south across the warm front. Explain why this happens by referencing the general wind directions on either side of both fronts. 6. The last map (page 11) shows wind streamlines and indicates convergence and divergence at the surface at 23z 30DEC What is convergence, and explain why it is found where it is using the wind streamlines and pressure pattern.

7
8
9
10
11
Chapter22 Weather Maps
 Name Teacher Period Date hapter22 Weather Maps hapter 22 Skill Sheet 1: Fronts Air masses are bodies of air that are relatively uniform in temperature and humidity. These bodies of air take on the characteristic
WEATHER AND CLIMATE COMPLETING THE WEATHER OBSERVATION PROJECT CAMERON DOUGLAS CRAIG
 WEATHER AND CLIMATE COMPLETING THE WEATHER OBSERVATION PROJECT CAMERON DOUGLAS CRAIG Introduction The Weather Observation Project is an important component of this course that gets you to look at real
Air Masses of North America cp and ca air masses Air mass characterized by very cold and dry conditions
 Chapter 8: Air Masses, Fronts, and Middle-Latitude Cyclones Air masses Fronts Middle-latitude cyclones Air Masses Air mass an extremely large body of air whose properties of temperature and humidity are
Chapter 12 Fronts & Air Masses
 Chapter overview: Anticyclones or highs Air Masses o Classification o Source regions o Air masses of North America Fronts o Stationary fronts o Cold fronts o Warm fronts o Fronts and the jet stream o Frontogenesis
Forecasting Weather: Air Masses and Fronts
 Forecasting Weather: Air Masses and Fronts Weather is a combination of local conditions at any one time. It's what's happening outside right now, right here. Weather includes: Temperature Humidity Air
Chapter 1 Anatomy of a Cyclone
 Chapter 1 Anatomy of a Cyclone The Beast in the East 15-17 February 2003 Extra-tropical cyclone an area of low pressure outside of the tropics Other names for extra-tropical cyclones: Cyclone Mid-latitude
Earth Science. Lab 21: Weather Patterns
 Name: Lab 21: Weather Patterns Earth Science Date: Introduction: A basic principle in Earth Science is that energy is constantly bringing about changes. In order to understand the changing Earth, we must
2. What are the four most common gasses in the atmosphere and their percentages?
 Meteorology Review Directions: Answer the following open ended review questions. Utilize a diagram where appropriate and do make sure that you label and describe the drawing. Atmospheric Composition 1.
CURRICULUM OUTLINE. DEPARTMENT: Science DATE: January, 2004
 PARAMUS ELEMENTARY SCHOOL PARAMUS, NEW JERSEY CURRICULUM OUTLINE DEPARTMENT: Science DATE: January, 2004 COURSE: The Earth s Atmosphere GRADE LEVEL: Grade 6 I. COURSE DESCRIPTION: The student will explore
Mid-latitude Cyclones & Air Masses
 Lab 9 Mid-latitude Cyclones & Air Masses This lab will introduce students to the patterns of surface winds around the center of a midlatitude cyclone of low pressure. The types of weather associated with
ESCI 1010 Lab 1 Introduction to Weather Data
 ESCI 1010 Lab 1 Introduction to Weather Data Before Lab: Review pages 1-51 in your Weather and Climate textbook. Pay special attention to the sections entitled Location and Time on Earth and Some Weather
Weather Station Model
 Fun with Weather Maps! (no, really stop laughing) AOSC 200 Tim Canty Class Web Site: http://www.atmos.umd.edu/~tcanty/aosc200 Topics for today: Station Model Temperature Maps Pressure Maps Fronts Lecture
FORMATION OF AIR MASSES
 Chapter 24: Weather (air mass, fronts, Weather instruments, and forecasting the weather) Name: Period: Due Date: Air Mass Use the terms from the following list to complete the sentences below. Each term
Studying Topography, Orographic Rainfall, and Ecosystems (STORE)
") Studying Topography, Orographic Rainfall, and Ecosystems (STORE) Introduction Basic Lesson 3: Using Microsoft Excel to Analyze Weather Data: Topography and Temperature This lesson uses NCDC data to compare
Studying Topography, Orographic Rainfall, and Ecosystems (STORE) Introduction Basic Lesson 3: Using Microsoft Excel to Analyze Weather Data: Topography and Temperature This lesson uses NCDC data to compare
DEPARTMENT OF GEOSCIENCES SAN FRANCISCO STATE UNIVERSITY. Metr Fall 2012 Test #1 200 pts. Part I. Surface Chart Interpretation.
 DEPARTMENT OF GEOSCIENCES SAN FRANCISCO STATE UNIVERSITY NAME Metr 356.01 Fall 2012 Test #1 200 pts Part I. Surface Chart Interpretation. Figure 1. Surface Chart for 1500Z 7 September 2007 1 1. Pressure
PRACTICAL ACTIVITY: DRAWING ISOLINES OR CONTOURS
 COME RAIN OR SHINE PRACTICAL ACTIVITY: DRAWING ISOLINES OR CONTOURS Ideally you would need a pencil for this activity (rather than a pen) and coloured pencils are useful too. These activities maybe a little
Lab 19.2 Synoptic Weather Maps
 Lab 19.2 Synoptic Weather Maps Name: Partner: Purpose The purpose of this lab is to have you read and interpret the information displayed on synoptic weather maps. You will also learn the techniques used
MET 3502 Synoptic Meteorology. Lecture 5: Surface Weather Elements
 MET 3502 Synoptic Meteorology Lecture 5: Surface Weather Elements Surface Weather Elements Not observations of the surface, but Observations made by an observer (or instrument) at the surface Example:
7 - DE Website Document Weather Meteorology
 Date: Subject: 7 - DE Website Document Weather Meteorology Name: Section: E.ES.07.71 - Compare and contrast the difference and relationship between climate and weather. E.ES.07.74 - Describe weather conditions
Fun with Weather Maps! (no, really stop laughing) AOSC 200 Tim Canty
 AOSC 200 Tim Canty") Fun with Weather Maps! (no, really stop laughing) AOSC 200 Tim Canty Class Web Site: http://www.atmos.umd.edu/~tcanty/aosc200 Topics for today: Observations Station Model Temperature Maps Pressure Maps
Fun with Weather Maps! (no, really stop laughing) AOSC 200 Tim Canty Class Web Site: http://www.atmos.umd.edu/~tcanty/aosc200 Topics for today: Observations Station Model Temperature Maps Pressure Maps
LAB J - WORLD CLIMATE ZONES
 Introduction LAB J - WORLD CLIMATE ZONES The objective of this lab is to familiarize the student with the various climates around the world and the climate controls that influence these climates. Students
1. Which weather map symbol is associated with extremely low air pressure? A) B) C) D) 2. The diagram below represents a weather instrument.
 B) C) D) 2. The diagram below represents a weather instrument.") 1. Which weather map symbol is associated with extremely low air pressure? 2. The diagram below represents a weather instrument. Which weather variable was this instrument designed to measure? A) air pressure
1. Which weather map symbol is associated with extremely low air pressure? 2. The diagram below represents a weather instrument. Which weather variable was this instrument designed to measure? A) air pressure
Module 11: Meteorology Topic 5 Content: Weather Maps Notes
 Introduction A variety of weather maps are produced by the National Weather Service and National Oceanographic Atmospheric Administration. These maps are used to help meteorologists accurately predict
Student Exploration: Hurricane Motion
 Name: Date: Student Exploration: Hurricane Motion Vocabulary: air pressure, Coriolis effect, eye, hurricane, knot, meteorologist, precipitation Prior Knowledge Questions (Do these BEFORE using the Gizmo.)
4/29/2011. Mid-latitude cyclones form along a
 Chapter 10: Cyclones: East of the Rocky Mountain Extratropical Cyclones Environment prior to the development of the Cyclone Initial Development of the Extratropical Cyclone Early Weather Along the Fronts
MASTERY ASSIGNMENT 2015
 Climate & Meteorology MASTERY ASSIGNMENT 2015 Directions: You must submit this document via Google Docs to lzimmerman@wcpss.net. The document must include the questions and pictures must be hand drawn
AOSC201: Weather and Climate Lab
 AOSC201: Weather and Climate Lab Week 8: Forecasting - Analysis Section 107/108 Instructor: Agniv Sengupta q Lab #7 of Lab Manual (pages 41-49) q 50 points in total q INDIVIDUAL Work for the entire lab
SPI Analyze data to identify events associated with heat convection in the atmosphere. SPI Recognize the connection between the
 SPI 0607.8.1 - Analyze data to identify events associated with heat convection in the atmosphere. SPI 0607.8.2 - Recognize the connection between the sun s energy and the wind. o Energy from the Sun creates
Global Winds AOSC 200 Tim Canty
 Global Winds AOSC 200 Tim Canty Class Web Site: http://www.atmos.umd.edu/~tcanty/aosc200 Topics for today: Air Masses Fronts Lecture 18 Oct 31 2017 1 Air Masses What is an air mass? Large body of air whose
ESCI 1010 Lab 6 Midlatitude Cyclones and Thunderstorms
 ESCI 1010 Lab 6 Midlatitude Cyclones and Thunderstorms Before Lab: Review pages 244-324 in your Weather and Climate textbook. Pay special attention to the sections entitled Fronts, Life Cyclone of a Midlatitude
b. The boundary between two different air masses is called a.
 NAME Earth Science Weather WebQuest Part 1. Air Masses 1. Find out what an air mass is. http://okfirst.mesonet.org/train/meteorology/airmasses.html a. What is an air mass? An air mass is b. The boundary
WEATHER PATTERNS NAME DATE. VOCABULARY: Synoptic weather map- Isotherm- Barometric Pressure- Isobar- Convergence- Divergence- Cyclone- Anticyclone-
 NAME DATE VOCABULARY: Synoptic weather map- WEATHER PATTERNS Isotherm- Barometric Pressure- Isobar- Convergence- Divergence- Cyclone- Anticyclone- Air mass- Source region- Front- OBJECTIVE: Construct a
How Can You Predict Weather Changes?
 How Can You Predict Weather Changes? How to Predict Weather Meteorologists make weather predictions daily. They use the same processes that you will. They collect weather data. They plot the data on maps.
DEPARTMENT OF EARTH & CLIMATE SCIENCES Name SAN FRANCISCO STATE UNIVERSITY Nov 29, ERTH 360 Test #2 200 pts
 DEPARTMENT OF EARTH & CLIMATE SCIENCES Name SAN FRANCISCO STATE UNIVERSITY Nov 29, 2018 ERTH 360 Test #2 200 pts Each question is worth 4 points. Indicate your BEST CHOICE for each question on the Scantron
Middle Latitude Cyclones a storm that forms at middle and high latitudes, outside of the tropics.
 Middle Latitude Cyclones a storm that forms at middle and high latitudes, outside of the tropics. Polar Front Theory a theory that explains the life cycle of mid latitude cyclones and their associated
Chapter 5: Weather. Only Section 1: What is Weather?
 Chapter 5: Weather Only Section 1: What is Weather? Find the definitions of: Meteorology, meteorologist, weather, climate Not in book? Use the dictionaries **Meteorology - Meteorology is the study of the
Mr. P s Science Test!
 WEATHER- 2017 Mr. P s Science Test! # Name Date 1. Draw and label a weather station model. (10 pts) 2. The is the layer of the atmosphere with our weather. 3. Meteorologists classify clouds in about different
5. Which type of front is represented by letter X?
 Name Weather Regents Review ased your answers to questions 1 through 4 on the four weather station models,,,, and D, below. D 82 012 56 999 78 978 32 002 62 75 24 1. List the letters of the four station
Grade 9 Geography Chapter 11 - Climate Connections
 Grade 9 Geography Chapter 11 - Climate Connections 1. Define: Weather. 2. In what way has weather affected your activities in the last two weeks? 3. Define: Climate. 4. Canada s climate is a function of
4 Forecasting Weather
 CHAPTER 2 4 Forecasting Weather SECTION Understanding Weather BEFORE YOU READ After you read this section, you should be able to answer these questions: What instruments are used to forecast weather? How
Name SOLUTIONS T.A./Section Atmospheric Science 101 Homework #6 Due Thursday, May 30 th (in class)
") Name SOLUTIONS T.A./Section Atmospheric Science 101 Homework #6 Due Thursday, May 30 th (in class) 1. General Circulation Briefly describe where each of the following features is found in the earth s general
Name SOLUTIONS T.A./Section Atmospheric Science 101 Homework #6 Due Thursday, May 30 th (in class) 1. General Circulation Briefly describe where each of the following features is found in the earth s general
Weather - is the state of the atmosphere at a specific time & place
 Weather Section 1 Weather - is the state of the atmosphere at a specific time & place Includes such conditions as air pressure, wind, temperature, and moisture in the air The Sun s heat evaporates water
Meteorology 311. General Circulation/Fronts Fall 2017
 Meteorology 311 General Circulation/Fronts Fall 2017 Precipitation Types Rain Snow growth of ice crystals through deposition, accretion, and aggregation. Freezing Rain Rain freezes when it hits the surface.
Investigating Weather and Climate with Google Earth Teacher Guide
 Google Earth Weather and Climate Teacher Guide In this activity, students will use Google Earth to explore global temperature changes. They will: 1. Use Google Earth to determine how the temperature of
WebQuest Weather Crisis!
 WebQuest Weather Crisis! Introduction A meteorologist is someone who studies the science behind the weather, and uses that understanding to try and predict what weather is coming up (forecasting). Without
Figure 1. Idealized global atmospheric circulation (C= surface convergence, D= surface divergence).
.") page - 1 Laboratory Exercise #8 - Introduction to Atmospheric Science: Global Circulation and Weather Makers Section A - Global Atmospheric Circulation: To understand weather you need to understand how
page - 1 Laboratory Exercise #8 - Introduction to Atmospheric Science: Global Circulation and Weather Makers Section A - Global Atmospheric Circulation: To understand weather you need to understand how
Weather Unit Part 2: Meteorology
 Name: Earth Science Date: Period: Weather Unit Part 2: Meteorology 1 The map below shows North America and its surrounding bodies of water. Country borders are shown. On the map, label the following locations:
February 2011: A Month of Below Average Temperatures, A Record Cold Snap, and a Sharp Frontal Passage with Snow
 1 Steven Mullen February 2011: A Month of Below Average Temperatures, A Record Cold Snap, and a Sharp Frontal Passage with Snow Overview of the Weather and Detail Diagnosis for Feb 25 th -27 th Daily surface
Use the terms from the following list to complete the sentences below. Each term may be used only once.
 Skills Worksheet Directed Reading Section: Air Masses Use the terms from the following list to complete the sentences below. Each term may be used only once. high pressure poles low pressure equator wind
True or false: The atmosphere is always in hydrostatic balance. A. True B. False
 Clicker Questions and Clicker Quizzes Clicker Questions Chapter 7 Of the four forces that affect the motion of air in our atmosphere, which is to thank for opposing the vertical pressure gradient force
AOSC 200 Tim Canty. Class Web Site: Topics for today: Air Masses. Fronts. Lecture 19 Apr
 Air Masses AOSC 200 Tim Canty Class Web Site: http://www.atmos.umd.edu/~tcanty/aosc200 Topics for today: Air Masses Fronts Lecture 19 Apr 11 2019 1 Today s Weather Map http://www.wpc.ncep.noaa.gov/#page=sfc
Chapter 9: Weather Patterns
 Chapter 9: Weather Patterns Mid Latitude Cyclones: extratropical cyclones, Nor easters Region southern FL to Alaska Lifecycle and associated weather Regional Influence Polar Front Theory: -Norwegian Cyclone
Location Latitude Longitude Durham, NH
 Name: Date: Weather to Climate Investigation: Snow **These are example answers using the Durham, NH dataset. Answers from students using Boise and Little Rock datasets will differ. Guiding Questions: What
Your work from these three exercises will be due Thursday, March 2 at class time.
 GEO231_week5_2012 GEO231, February 23, 2012 Today s class will consist of three separate parts: 1) Introduction to working with a compass 2) Continued work with spreadsheets 3) Introduction to surfer software
Severe Weather and weather mapping Remediation Assignment. Once the page has been approved, Mrs. Blinka will sign here:
 Severe Weather and weather mapping Remediation Assignment Part I: Complete the remediation page attached This will be a single page (front and back) that helps your organize the most important information
Name: Date: Period: MATCHING: Select the letter of the word in Column B that best matches the phrases in Column A.
 Name: Date: Period: MATCHING: Select the letter of the word in Column B that best matches the phrases in Column A. COLUMN A 1. a unit of atmospheric pressure 2. a line joining points of equal air pressure
Clouds. What they tell us about the weather
 Clouds What they tell us about the weather Spring funnel cloud over Willard, Utah 2003 Cloud coverage 581-586 How to show Cloud Coverage On a weather map meteorologists use circles shaded differently to
ATS 351, Spring 2010 Lab #11 Severe Weather 54 points
 ATS 351, Spring 2010 Lab #11 Severe Weather 54 points Question 1 (10 points): Thunderstorm development a) Sketch and describe the stages of development of a single cell thunderstorm. About how long does
Lecture #14 March 29, 2010, Monday. Air Masses & Fronts
 Lecture #14 March 29, 2010, Monday Air Masses & Fronts General definitions air masses source regions fronts Air masses formation types Fronts formation types Air Masses General Definitions a large body
Polar Front Theory. Cyclogenesis. Day 1. Days 2-5. What Happens Aloft. Up Above
 Cyclogenesis Tor Bergeron lecturing Mid latitude cyclones are born on the Polar Front as a developing wave Theory of cyclogenesis (formation of cyclones) first developed by the Norwegian meteorologists
Mid-Latitude Cyclones and Fronts. Lecture 12 AOS 101
 Mid-Latitude Cyclones and Fronts Lecture 12 AOS 101 Homework 4 COLDEST TEMPS GEOSTROPHIC BALANCE Homework 4 FASTEST WINDS L Consider an air parcel rising through the atmosphere The parcel expands as it
Counselor s Name: Counselor s Ph #: 1) Define meteorology. Explain how the weather affects farmers, sailors, aviators,
 Define meteorology. Explain how the weather affects farmers, sailors, aviators,") Weather Merit Badge Workbook This workbook is not required but is designed to help you with this merit badge. No one can add or subtract from the Boy Scout Requirements #33215. Use page backs & add pages
Weather Merit Badge Workbook This workbook is not required but is designed to help you with this merit badge. No one can add or subtract from the Boy Scout Requirements #33215. Use page backs & add pages
Create Satellite Image, Draw Maps
 Create Satellite Image, Draw Maps 1. The goal Using Google Earth, we want to create and import a background file into our Adviser program. From there, we will be creating paddock boundaries. The accuracy
Investigating Factors that Influence Climate
 Investigating Factors that Influence Climate Description In this lesson* students investigate the climate of a particular latitude and longitude in North America by collecting real data from My NASA Data
Figure 1. Idealized global atmospheric circulation (C = surface convergence, D = surface divergence).
.") page - Laboratory Exercise #8 - Introduction to Atmospheric Science: Global Circulation and Weather Makers Section A - Global Atmospheric Circulation: To understand weather you need to understand how the
page - Laboratory Exercise #8 - Introduction to Atmospheric Science: Global Circulation and Weather Makers Section A - Global Atmospheric Circulation: To understand weather you need to understand how the
The Mid Latitude Low trends Check the clouds: Check the barometer: Check the wind: Check the temperature:
 The Mid Latitude Low Mid Latitude lows tend to develop along stationary fronts. In particular, they tend to develop along a boundary between a cold, polar air mass and a warm, tropical air mass. As they
Air Masses and Fronts II
 Air Masses and Fronts II Brief review An air mass is a large body of air whose properties of temperature and humidity are fairly similar in any horizontal direction Source regions for air masses tend to
Weather, Air Masses, Fronts and Global Wind Patterns. Meteorology
 Weather, Air Masses, Fronts and Global Wind Patterns Meteorology Weather is what conditions of the atmosphere are over a short period of time. Climate is how the atmosphere "behaves" over long periods
Science Olympiad Meteorology Quiz #1 Page 1 of 7
 1) What is generally true about the stratosphere: a) Has turbulent updrafts and downdrafts. b) Has either a stable or increasing temperature profile with altitude. c) Where the auroras occur. d) Both a)
Chapter 12: Meteorology
 Chapter 12: Meteorology Section 1: The Causes of Weather 1. Compare and contrast weather and climate. 2. Analyze how imbalances in the heating of Earth s surface create weather. 3. Describe how and where
Scout s Address: City State Zip:
 WEATHER BYU Merit Badge Pow Wow Official Merit Badge Worksheet New 2014 Requirements Scout s Name: Instructor s Name: Scout s Address: City State Zip: Instructions 1. The Scout is to review the merit badge
Remember that C is a constant and ë and n are variables. This equation now fits the template of a straight line:
 CONVERTING NON-LINEAR GRAPHS INTO LINEAR GRAPHS Linear graphs have several important attributes. First, it is easy to recognize a graph that is linear. It is much more difficult to identify if a curved
How fast does a cold front move?
 How fast does a cold front move? An investigation using data from the Met Office WOW network Geoff Jenkins, Royal Meteorological Society. Aim A cold front is one of the features of mid-latitude weather
Meteorology Final Exam Study Guide Part 2
 Name: Teacher Science 8. Date: Water in the Air 1. Define the following terms: Meteorology Final Exam Study Guide Part 2 Evaporation Condensation Relative Humidity Dew Point Humidity Saturation Condensation
The Word Art features of Word allows the user to create stylized text with various special effects such as textures, outlines and shapes.
 Overview: During this lesson, students use Word Art and the text box tool in Microsoft Word to describe a word related to weather. After printing the page they illustrate the weather word. Objectives:
Chapter 10: Mid-latitude Cyclones Mid-Latitude Cyclones
 Chapter 10: Mid-latitude Cyclones Mid-Latitude Cyclones Mid-latitude cyclones form along a boundary separating polar air from warmer air to the south. Life Cycle of Cyclone Cyclone Structures Steering
Chapter 10: Mid-latitude Cyclones
 Chapter 10: Mid-latitude Cyclones Life Cycle of Cyclone Cyclone Structures Steering of Cyclone Mid-Latitude Cyclones Mid-latitude cyclones form along a boundary separating polar air from warmer air to
AIR MASSES. Large bodies of air. SOURCE REGIONS areas where air masses originate
 Large bodies of air AIR MASSES SOURCE REGIONS areas where air masses originate Uniform in composition Light surface winds Dominated by high surface pressure The longer the air mass remains over a region,
SEVERE WEATHER AND FRONTS TAKE HOME QUIZ
 1. Most of the hurricanes that affect the east coast of the United States originally form over the A) warm waters of the Atlantic Ocean in summer B) warm land of the southeastern United States in summer
25.1 Air Masses. Section 25.1 Objectives
 Section 25.1 Objectives Explain how an air mass forms. List the four main types of air masses. Describe how air masses affect the weather of North America. Air Masses 25.1 Air Masses Differences in air
WATER IN THE ATMOSPHERE
 WATER IN THE ATMOSPHERE I. Humidity A. Defined as water vapor or moisture in the air (from evaporation and condensation). B. The atmosphere gains moisture from the evaporation of water from oceans, lakes,
Department of Earth & Climate Sciences San Francisco State University
 Department of Earth & Climate Sciences San Francisco State University Name ERTH 260: Inclass Exercise #5 Working With Weather Maps and Soundings: Finding Pressure Features and Fronts Due Wednesday 28 February
Construction and Interpretation of Weather Station Models
 Fall Semester Regents Earth Science John Dewey High School Mr. Klimetz Construction and Interpretation of Weather Station Models An Exercise in the Construction and Interpretation of Weather Station Models
MET 3502 Synoptic Meteorology. Lecture 8: September 16, AIRMASSES, FRONTS and FRONTAL ANALYSIS (2)
") MET 3502 Synoptic Meteorology Lecture 8: September 16, 2010 AIRMASSES, FRONTS and FRONTAL ANALYSIS (2) Identifying a cold front on a surface weather map: 1. Surface front is located at the leading edge
MET 3502 Synoptic Meteorology Lecture 8: September 16, 2010 AIRMASSES, FRONTS and FRONTAL ANALYSIS (2) Identifying a cold front on a surface weather map: 1. Surface front is located at the leading edge
Remote Sensing Seminar 8 June 2007 Benevento, Italy. Lab 5 SEVIRI and MODIS Clouds and Fires
 Remote Sensing Seminar 8 June 2007 Benevento, Italy Lab 5 SEVIRI and MODIS Clouds and Fires Table: SEVIRI Channel Number, Wavelength (µm), and Primary Application Reflective Bands 1,2 0.635, 0.81 land/cld
Fig Major air masses of the world
 Fig. 9.3 Major air masses of the world CLASSIFICATION FOUR BASIC CATEGORIES OF AIR MASSES: POLAR - P ARCTIC - A TROPICAL - T EQUATORIAL - E TWO DESIGNATIONS OF SURFACE IN SOURCE REGION MARITIME - m. CONTINENTAL
DOWNLOAD PDF READING CLIMATE MAPS
 Chapter 1 : Template:Climate chart/how to read a climate chart - Wikipedia Maps don't just tell you which way to go they can tell you practically everything about an area of land, even the weather. Learn
Weather Review. What is the relative humidity when the temperature equals the dew point?
 Weather Review A measures dew point and relative humidity. What is another name for the DRY BULB? Why is the wet bulb NEVER higher than the dry bulb? What is the dew point? What is the relative humidity?
Lesson Adaptation Activity: Analyzing and Interpreting Data
 Lesson Adaptation Activity: Analyzing and Interpreting Data Related MA STE Framework Standard: 3-ESS2-1. Use graphs and tables of local weather data to describe and predict typical weather during a particular
Final Weather Unit Study Guide
 Name: Atmospheric Composition and Layers Altitude Atmosphere Composition Troposphere Air Pressure Stratosphere Mesosphere Thermosphere Exosphere Ionosphere Sample Questions: Final Weather Unit Study Guide
In this activity, students will compare weather data from to determine if there is a warming trend in their community.
 Overview: In this activity, students will compare weather data from 1910-2000 to determine if there is a warming trend in their community. Objectives: The student will: use the Internet to locate scientific
ATSC 201 Final Exam Name: Fall 2008 (total points = 100) Student Number: 1. (2 points) The two main conditions needed for downbursts to form are: and
 Student Number: 1. (2 points) The two main conditions needed for downbursts to form are: and") Prof. Stull (open book) Fall 2008 (total points = 100) Student Number: 1. (2 points) The two main conditions needed for downbursts to form are: and 2. (6 pts) For the most-used imager channels on weather
Prof. Stull (open book) Fall 2008 (total points = 100) Student Number: 1. (2 points) The two main conditions needed for downbursts to form are: and 2. (6 pts) For the most-used imager channels on weather
LAB 15. Lab 15. Air Masses and Weather Conditions: How Do the Motions and Interactions of Air Masses Result in Changes in Weather Conditions?
 Lab Handout Lab 15. Air Masses and Weather Conditions: How Do the Motions and Interactions of Air Masses Result in Changes in Weather Conditions? Introduction Meteorology is the study of the atmosphere.
MAST ACADEMY OUTREACH. WOW (Weather on Wheels)
") MAST ACADEMY OUTREACH MIDDLE SCHOOL PROGRAM Adventures Aboard WOW (Weather on Wheels) On-Site Highlights Packet MAST Academy Maritime and Science Technology High School Miami-Dade County Public Schools
MAST ACADEMY OUTREACH MIDDLE SCHOOL PROGRAM Adventures Aboard WOW (Weather on Wheels) On-Site Highlights Packet MAST Academy Maritime and Science Technology High School Miami-Dade County Public Schools
Name Period Part I: INVESTIGATING OCEAN CURRENTS: PLOTTING BUOY DATA
 Name Period Part I: INVESTIGATING OCEAN CURRENTS: PLOTTING BUOY DATA INTRODUCTION: Ocean currents are like huge rivers in the sea. They carry drifting organisms, vital dissolved chemical nutrients and
Synoptic Meteorology I: Lab 1 Discussion. 25 September From page 14 of Meteorological Data and an Introduction to Synoptic Analysis,
 Synoptic Meteorology I: Lab 1 Discussion 25 September 2014 Overview On the following pages, isoplethed analyses of sea-level pressure (every 4 hpa; Figure 1), 2-m temperature (every 5 F; Figure 2), 2-m
Unit: Weather Study Guide
 Name: Period: Unit: Weather Study Guide Define each vocabulary word on a separate piece of paper or index card. Weather Climate Temperature Wind chill Heat index Sky conditions UV index Visibility Wind
Map Skills Lesson 1. Materials: maps, pencils, Lesson 1 Worksheet, strips of paper, grid paper
 Map Skills Lesson 1 Use cardinal directions, map grids, scales, and titles to locate places on a map. Interpret a map using information from its title, compass rose, scale, and legend. Vocabulary: map,
Current Weather Studies 4 TEMPERATURE AND AIR MASS ADVECTION
 CWS 4-1 SP19 Current Weather Studies 4 TEMPERATURE AND AIR MASS ADVECTION Reference: Chapter 4 in the Weather Studies textbook. Complete the introductory and other appropriate sections of Investigations
Module 9 Weather Systems
 Module 9 Weather Systems In this module the theory of atmospheric dynamics is applied to different weather phenomena. The first section deals with extratropical cyclones, low and high pressure areas of